. 2021 Mar 16:8:119-132.
doi: 10.2147/JHC.S294108. eCollection 2021.

A Novel Metabolism-Related Signature as a Candidate Prognostic Biomarker for Hepatocellular Carcinoma

Affiliations

A Novel Metabolism-Related Signature as a Candidate Prognostic Biomarker for Hepatocellular Carcinoma

Zhihao Wang et al. J Hepatocell Carcinoma. .

Abstract

Purpose: Given that metabolic reprogramming has been recognized as an essential hallmark of cancer cells, this study sought to investigate the potential prognostic values of metabolism-related genes (MRGs) for the diagnosis and treatment of hepatocellular carcinoma (HCC).

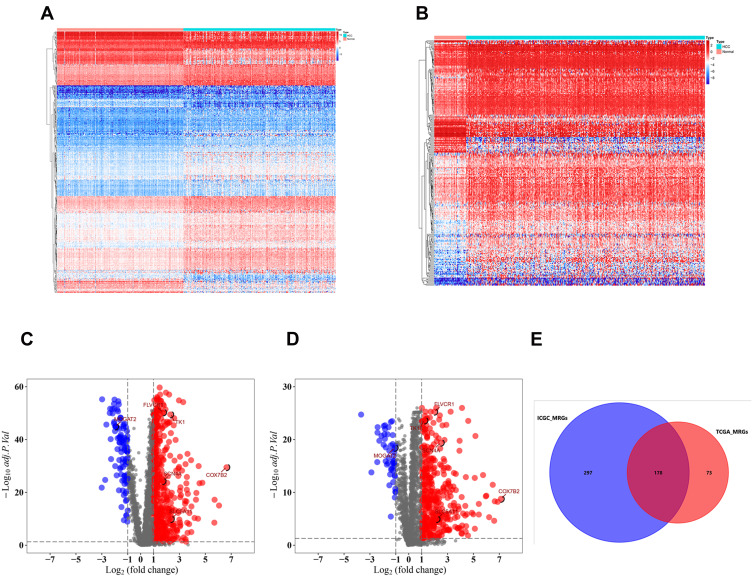
Methods: In total, 2752 metabolism-related gene sequencing data of HCC samples with clinical information were obtained from the International Cancer Genome Consortium (ICGC) and The Cancer Genome Atlas (TCGA). One hundred and seventy-eight the differentially expressed MRGs were identified from the ICGC cohort and TCGA cohort. Then, univariate Cox regression analysis was performed to identify these genes that were related to overall survival (OS). A novel metabolism-related prognostic signature was developed using the least absolute shrinkage and selection operator (Lasso) and multivariate Cox regression analyses in the ICGC dataset. The Broad Institute's Connectivity Map (CMap) was used in predicting which compounds on the basis of the prognostic MRGs. Furthermore, the signature was validated in the TCGA dataset. Finally, the expression levels of hub genes were validated in HCC cell lines by Western blotting (WB) and quantitative real-time PCR (qRT-PCR).

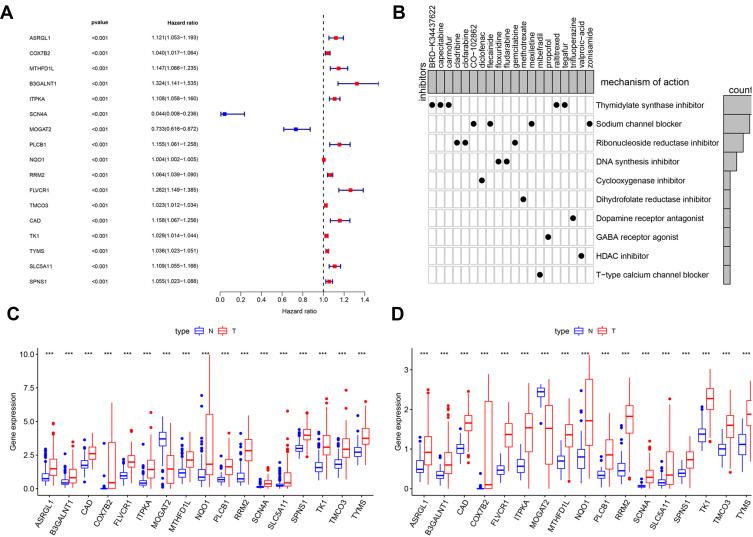
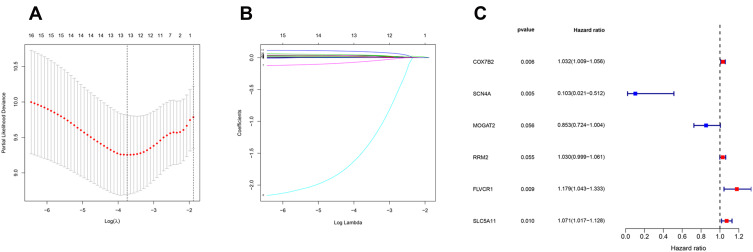
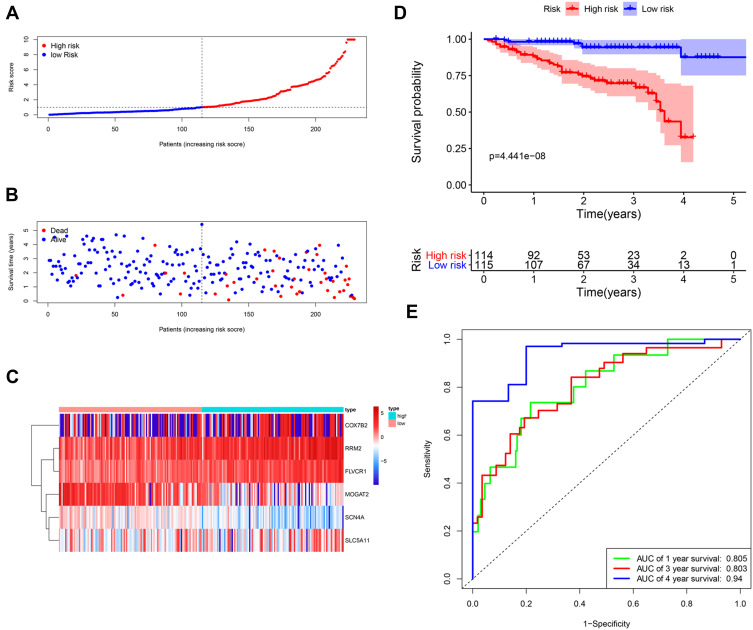
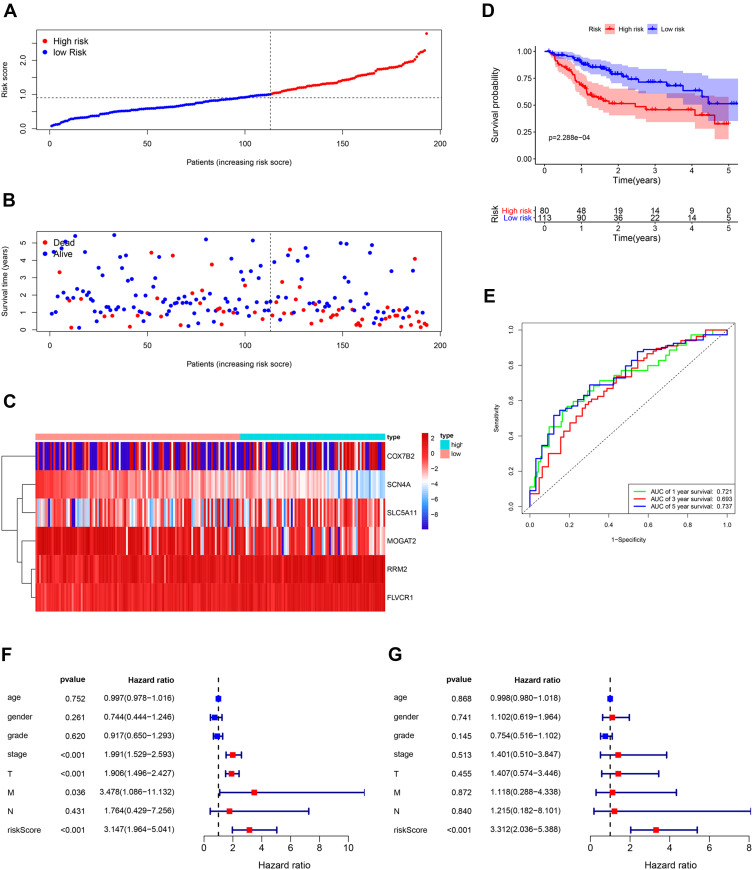
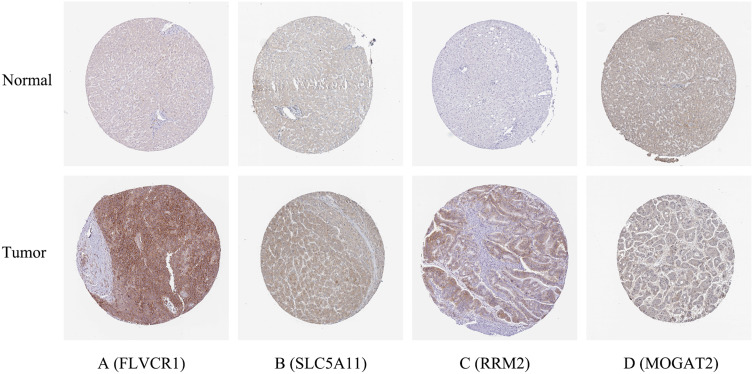
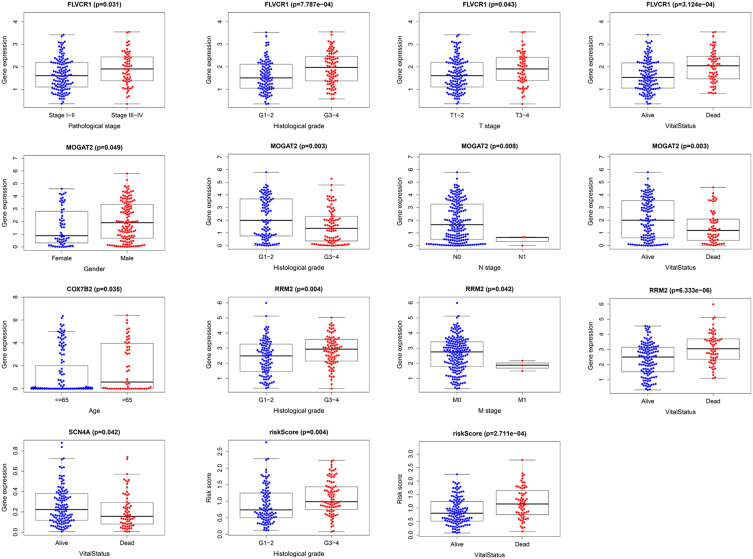
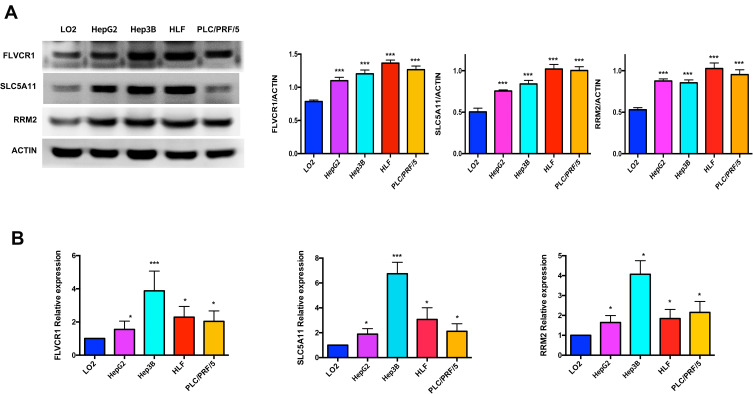
Results: We found that 17 MRGs were most significantly associated with OS in HCC. Then, the Lasso and multivariate Cox regression analyses were applied to construct the novel metabolism-relevant prognostic signature, which consisted of six MRGs. The prognostic value of this prognostic model was further successfully validated in the TCGA dataset. Further analysis indicated that this particular signature could be an independent prognostic indicator after adjusting to other clinical factors. Six MRGs (FLVCR1, MOGAT2, SLC5A11, RRM2, COX7B2, and SCN4A) showed high prognostic performance in predicting HCC outcomes. Candidate drugs that aimed at hub ERGs were identified. Finally, hub genes were chosen for validation and the protein, mRNA expression of FLVCR1, SLC5A11, and RRM2 were significantly increased in human HCC cell lines compared to normal human hepatic cell lines, which were in agreement with the results of differential expression analysis.

Conclusion: Our data provided evidence that the metabolism-related signature could serve as a reliable prognostic and predictive tool for OS in patients with HCC.

Keywords: biomarker; hepatocellular carcinoma; metabolism-related genes; prognostic signature.


Conflict of interest statement

The authors declare that they have no conflicts of interest for this work.

Figures

Figure 1
Figure 1
Differentially expressed metabolism-related genes (MRGs) in hepatocellular carcinoma (HCC). Heatmap of MRGs between HCC and nontumor tissues in ICGC database (A) and TCGA database (B). The color from blue to red represents the progression from low expression to high expression; Volcano plot of MRGs in ICGC database (C) and TCGA database (D). The red dots in the plot represents upregulated genes and blue dots represents downregulated genes with statistical significance. Black dots represent no differentially expressed genes. (E) Venn diagram showing the gene numbers of the MRGs of HCC in ICGC and TCGA database.
Figure 2
Figure 2
The GO and KEGG analysis of differentially expressed MRGs. (A) the top 10 of biological processes GO terms, cellular component GO terms, molecular function GO terms. (B) The correlation between intersection genes and top 5 biological processes GO terms. (C) The KEGG pathway analysis of differentially expressed MRGs.
Figure 3
Figure 3
Identification of survival-related differentially expressed MRGs and candidate drugs. (A) Forest plot of hazard ratios showing survival-related MRGs. p values <0.001 are considered to be statistically significant. (B) CMap database analysis identifies novel candidate drugs targeting the prognostic genes. The expression of 17 metabolism-related prognostic genes between HCC and normal tissues in ICGC database (C) and TCGA database (D), the red box shows the gene expression in HCC and the blue box shows the gene expression in normal liver tissue, ***p < 0.001.
Figure 4
Figure 4
Establishment of metabolism-related prognostic signature. (A) Screening of optimal parameter (lambda) at which the vertical lines were drawn. (B) Lasso coefficient profiles of the seventeen MRGs with non-zero coefficients determined by the optimal lambda. (C) Multivariate analyses assessing relationship between expression levels of MRGs and OS in patients with HCC.
Figure 5
Figure 5
Construction of the metabolism-based prognostic risk signature in the ICGC cohorts. (A) The risk score distribution of HCC patients. (B) Survival status and duration of patients; (C) Heatmap of the metabolism‐related genes expression; (D) Survival curves for the low-risk and high-risk groups. (E) Time-independent receiver operating characteristic (ROC) analysis of risk scores for prediction the overall survival in the ICGC set.
Figure 6
Figure 6
Validation of the metabolism-based prognostic risk signature in the TCGA cohorts. (A) The risk score distribution of HCC patients. (B) Survival status and duration of patients. (C) Heatmap of the metabolism-related genes expression. (D) Survival curves for the low-risk and high-risk groups. (E) Time-independent receiver operating characteristic (ROC) analysis of risk scores for prediction the overall survival in the TCGA set. (F) Univariate Cox regression analysis of discrete clinical factors. (G) Multivariate Cox regression analysis of discrete clinical factors.
Figure 7
Figure 7
Verification of hub MRGs expression in HCC and normal liver tissue using the HPA database. (A) FLVCR1, (B) SLC5A11, (C) RRM2, (D) MOGAT2.
Figure 8
Figure 8
Relationships between MRGs expression and clinicopathological factors in HCC (p < 0.05).
Figure 9
Figure 9
Validation of hub genes by WB and qRT-PCR. The protein and mRNA expression of FLVCR1, SLC5A11 and RRM2 were further validated in HCC cell lines by WB (A) and qRT-PCR (B). *p < 0.05, ***p < 0.001.

References

    1. Bray F, Ferlay J, Soerjomataram I, Siegel RL, Torre LA, Jemal A. Global cancer statistics 2018: GLOBOCAN estimates of incidence and mortality worldwide for 36 cancers in 185 countries. CA Cancer J Clin. 2018;68(6):394–424. doi:10.3322/caac.21492 - DOI - PubMed
    1. Bruix J, Reig M, Sherman M. Evidence-based diagnosis, staging, and treatment of patients with hepatocellular carcinoma. Gastroenterology. 2016;150(4):835–853. doi:10.1053/j.gastro.2015.12.041 - DOI - PubMed
    1. Hanahan D, Weinberg RA. Hallmarks of cancer: the next generation. Cell. 2011;144(5):646–674. doi:10.1016/j.cell.2011.02.013 - DOI - PubMed
    1. Jones RG, Thompson CB. Tumor suppressors and cell metabolism: a recipe for cancer growth. Genes Dev. 2009;23(5):537–548. doi:10.1101/gad.1756509 - DOI - PMC - PubMed
    1. Hsu PP, Sabatini DM. Cancer cell metabolism: warburg and beyond. Cell. 2008;134(5):703–707. doi:10.1016/j.cell.2008.08.021 - DOI - PubMed