

Pan-India novel coronavirus SARS-CoV-2 genomics and global diversity analysis in spike protein
- PMID: 33758785
- PMCID: PMC7972664
- DOI: 10.1016/j.heliyon.2021.e06564
Pan-India novel coronavirus SARS-CoV-2 genomics and global diversity analysis in spike protein
Abstract
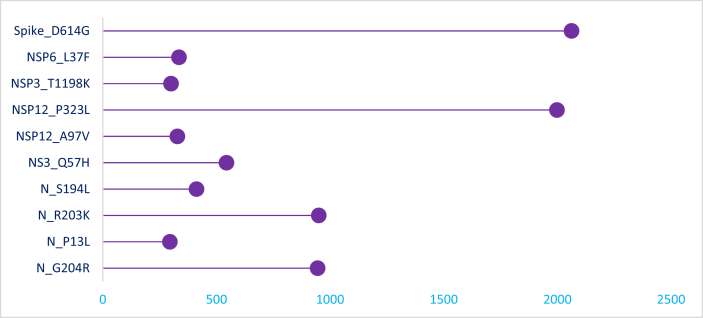
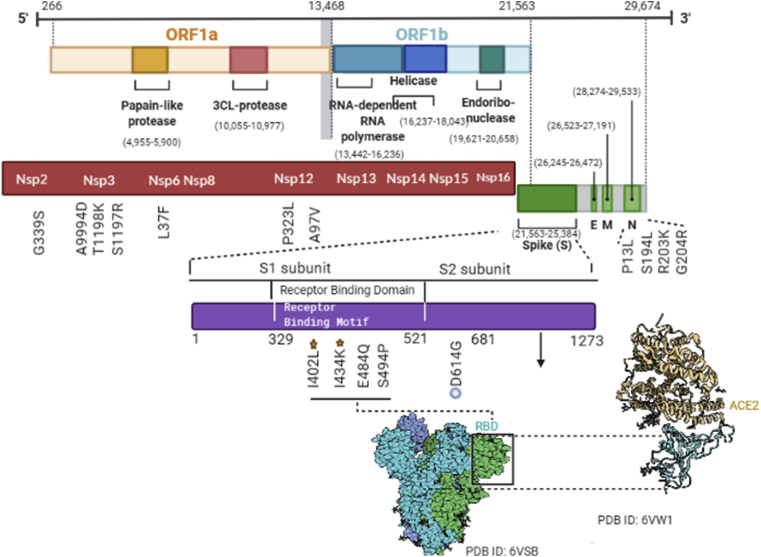
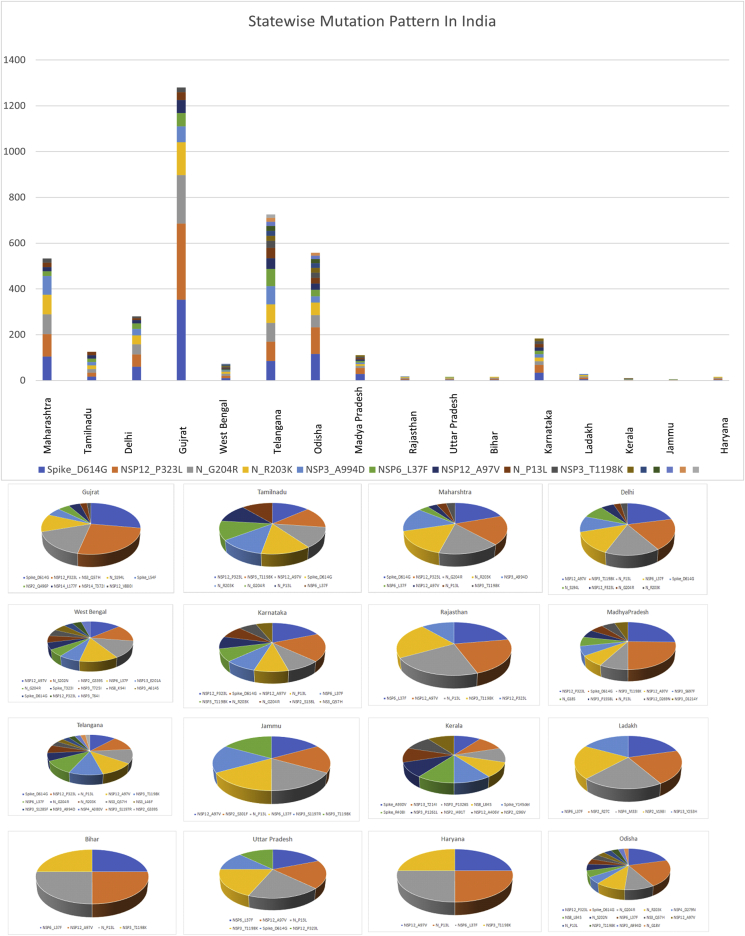
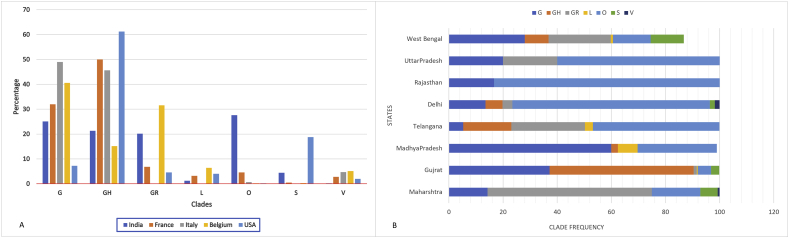
The mortality rates due to COVID-19 have been found disproportionate globally and are currently being researched. India mortality rate with a population of 1.3 billion people is relatively lowest to other countries with high infection rates. Genetic composition of circulating isolates continues to be a key determinant of virulence and pathogenesis. This study aimed to analyse the extent of divergence between genomes of Indian isolates (n = 2525 as compared to reference Wuhan-1 strain and isolates from countries showing higher fatality rates including France, Italy, Belgium, and the USA. The study also analyses the impact of key mutations on interactions with angiotensin converting enzyme 2 (ACE2) and panel of neutralizing monoclonal antibodies. Using 1,44,605 spike protein sequences, global prevalence of mutations in spike protein was observed. The study suggests that SARS-CoV-2 genomes from India share consensus with global trends with respect to D614G as most prevalent mutational event (81.66% among 2525 Indian isolates). Indian isolates did not reported prevalence of N439K mutation in receptor binding motif (RBM) as compared to global isolates (0.54%). Computational docking and molecular dynamics simulation analysis of N439K mutation with respect to ACE 2 binding and reactivity with RBM targeted antibodies viz., B38, BD23, CB6, P2B-F26 and EY6A suggests that variant have relatively higher affinity with ACE 2 receptor which may support higher infectivity. The study warrants large scale monitoring of Indian isolates as SARS-CoV-2 virus is expected to evolve and mutations may appear in unpredictable way.
Keywords: COVID-19; Clades; Comparative genomics; Fatality rate; Neutralizing antibodies; Pandemic; Receptor binding domain; SARS-CoV-2.
© 2021 The Author(s).
Conflict of interest statement
The authors declare no conflict of interest.
Figures
Similar articles
-
Computational modeling of the effect of five mutations on the structure of the ACE2 receptor and their correlation with infectivity and virulence of some emerged variants of SARS-CoV-2 suggests mechanisms of binding affinity dysregulation.Chem Biol Interact. 2022 Dec 1;368:110244. doi: 10.1016/j.cbi.2022.110244. Epub 2022 Nov 3. Chem Biol Interact. 2022. PMID: 36336003 Free PMC article.
-
Characterization of SARS-CoV-2 worldwide transmission based on evolutionary dynamics and specific viral mutations in the spike protein.Infect Dis Poverty. 2021 Aug 21;10(1):112. doi: 10.1186/s40249-021-00895-4. Infect Dis Poverty. 2021. PMID: 34419160 Free PMC article.
-
Mutational analysis in international isolates and drug repurposing against SARS-CoV-2 spike protein: molecular docking and simulation approach.Virusdisease. 2021 Dec;32(4):690-702. doi: 10.1007/s13337-021-00720-4. Epub 2021 Jul 15. Virusdisease. 2021. PMID: 34307771 Free PMC article.
-
Angiotensin-Converting Enzyme 2 (ACE2) in the Pathogenesis of ARDS in COVID-19.Front Immunol. 2021 Dec 22;12:732690. doi: 10.3389/fimmu.2021.732690. eCollection 2021. Front Immunol. 2021. PMID: 35003058 Free PMC article. Review.
-
The expression of hACE2 receptor protein and its involvement in SARS-CoV-2 entry, pathogenesis, and its application as potential therapeutic target.Tumour Biol. 2021;43(1):177-196. doi: 10.3233/TUB-200084. Tumour Biol. 2021. PMID: 34420993 Review.
Cited by
-
The Local Topological Free Energy of the SARS-CoV-2 Spike Protein.Polymers (Basel). 2022 Jul 26;14(15):3014. doi: 10.3390/polym14153014. Polymers (Basel). 2022. PMID: 35893978 Free PMC article.
-
Development of antibody resistance in emerging mutant strains of SARS CoV-2: Impediment for COVID-19 vaccines.Rev Med Virol. 2022 Sep;32(5):e2346. doi: 10.1002/rmv.2346. Epub 2022 Apr 13. Rev Med Virol. 2022. PMID: 35416390 Free PMC article. Review.
-
Cross-sectional genomic perspective of epidemic waves of SARS-CoV-2: A pan India study.Virus Res. 2022 Jan 15;308:198642. doi: 10.1016/j.virusres.2021.198642. Epub 2021 Nov 22. Virus Res. 2022. PMID: 34822953 Free PMC article.
-
Computational prediction of the effect of amino acid changes on the binding affinity between SARS-CoV-2 spike RBD and human ACE2.Proc Natl Acad Sci U S A. 2021 Oct 19;118(42):e2106480118. doi: 10.1073/pnas.2106480118. Proc Natl Acad Sci U S A. 2021. PMID: 34588290 Free PMC article.
-
Comparative genomics, evolutionary epidemiology, and RBD-hACE2 receptor binding pattern in B.1.1.7 (Alpha) and B.1.617.2 (Delta) related to their pandemic response in UK and India.Infect Genet Evol. 2022 Jul;101:105282. doi: 10.1016/j.meegid.2022.105282. Epub 2022 Apr 13. Infect Genet Evol. 2022. PMID: 35427787 Free PMC article.
References
-
- World Health Organization . World Health Organization; Geneva: 2020. WHO Coronavirus Disease (COVID-19) Dashboard [Internet]
LinkOut - more resources
Full Text Sources
Other Literature Sources
Miscellaneous
