

Advances in Chronic Obstructive Pulmonary Disease Imaging
- PMID: 33758787
- PMCID: PMC7983592
- DOI: 10.23866/brnrev:2019-0023
Advances in Chronic Obstructive Pulmonary Disease Imaging
Abstract
Chest computed tomography (CT) imaging is a useful tool that provides in vivo information regarding lung structure. Imaging has contributed to a better understanding of COPD, allowing for the detection of early structural changes and the quantification of extra-pulmonary structures. Novel CT imaging techniques have provided insight into the progression of the main COPD subtypes, such as emphysema and small airway disease. This article serves as a review of new information relevant to COPD imaging. CT abnormalities, such as emphysema and loss of airways, are present even in smokers who do not meet the criteria for COPD and in those with mild-to-moderate disease. Subjects with mild-to-moderate COPD, with the highest loss of airways, also experience the highest decline in lung function. Extra-pulmonary manifestations of COPD, such as right ventricle enlargement and low muscle mass measured on CT, are associated with increased risk for all-cause mortality. CT longitudinal data has also given insight into the progression of COPD. Mechanically affected areas of lung parenchyma adjacent to emphysematous areas are associated with a greater decline in FEV1. Subjects with the greatest percentage of small airway disease, as measured on matched inspiratory-expiratory CT scan, also present with the greatest decline in lung function.
Conflict of interest statement
Conflict of Interest Disclosures: Drs. Dolliver and Diaz have no conflicts of interest to disclose.
Figures
Similar articles
-
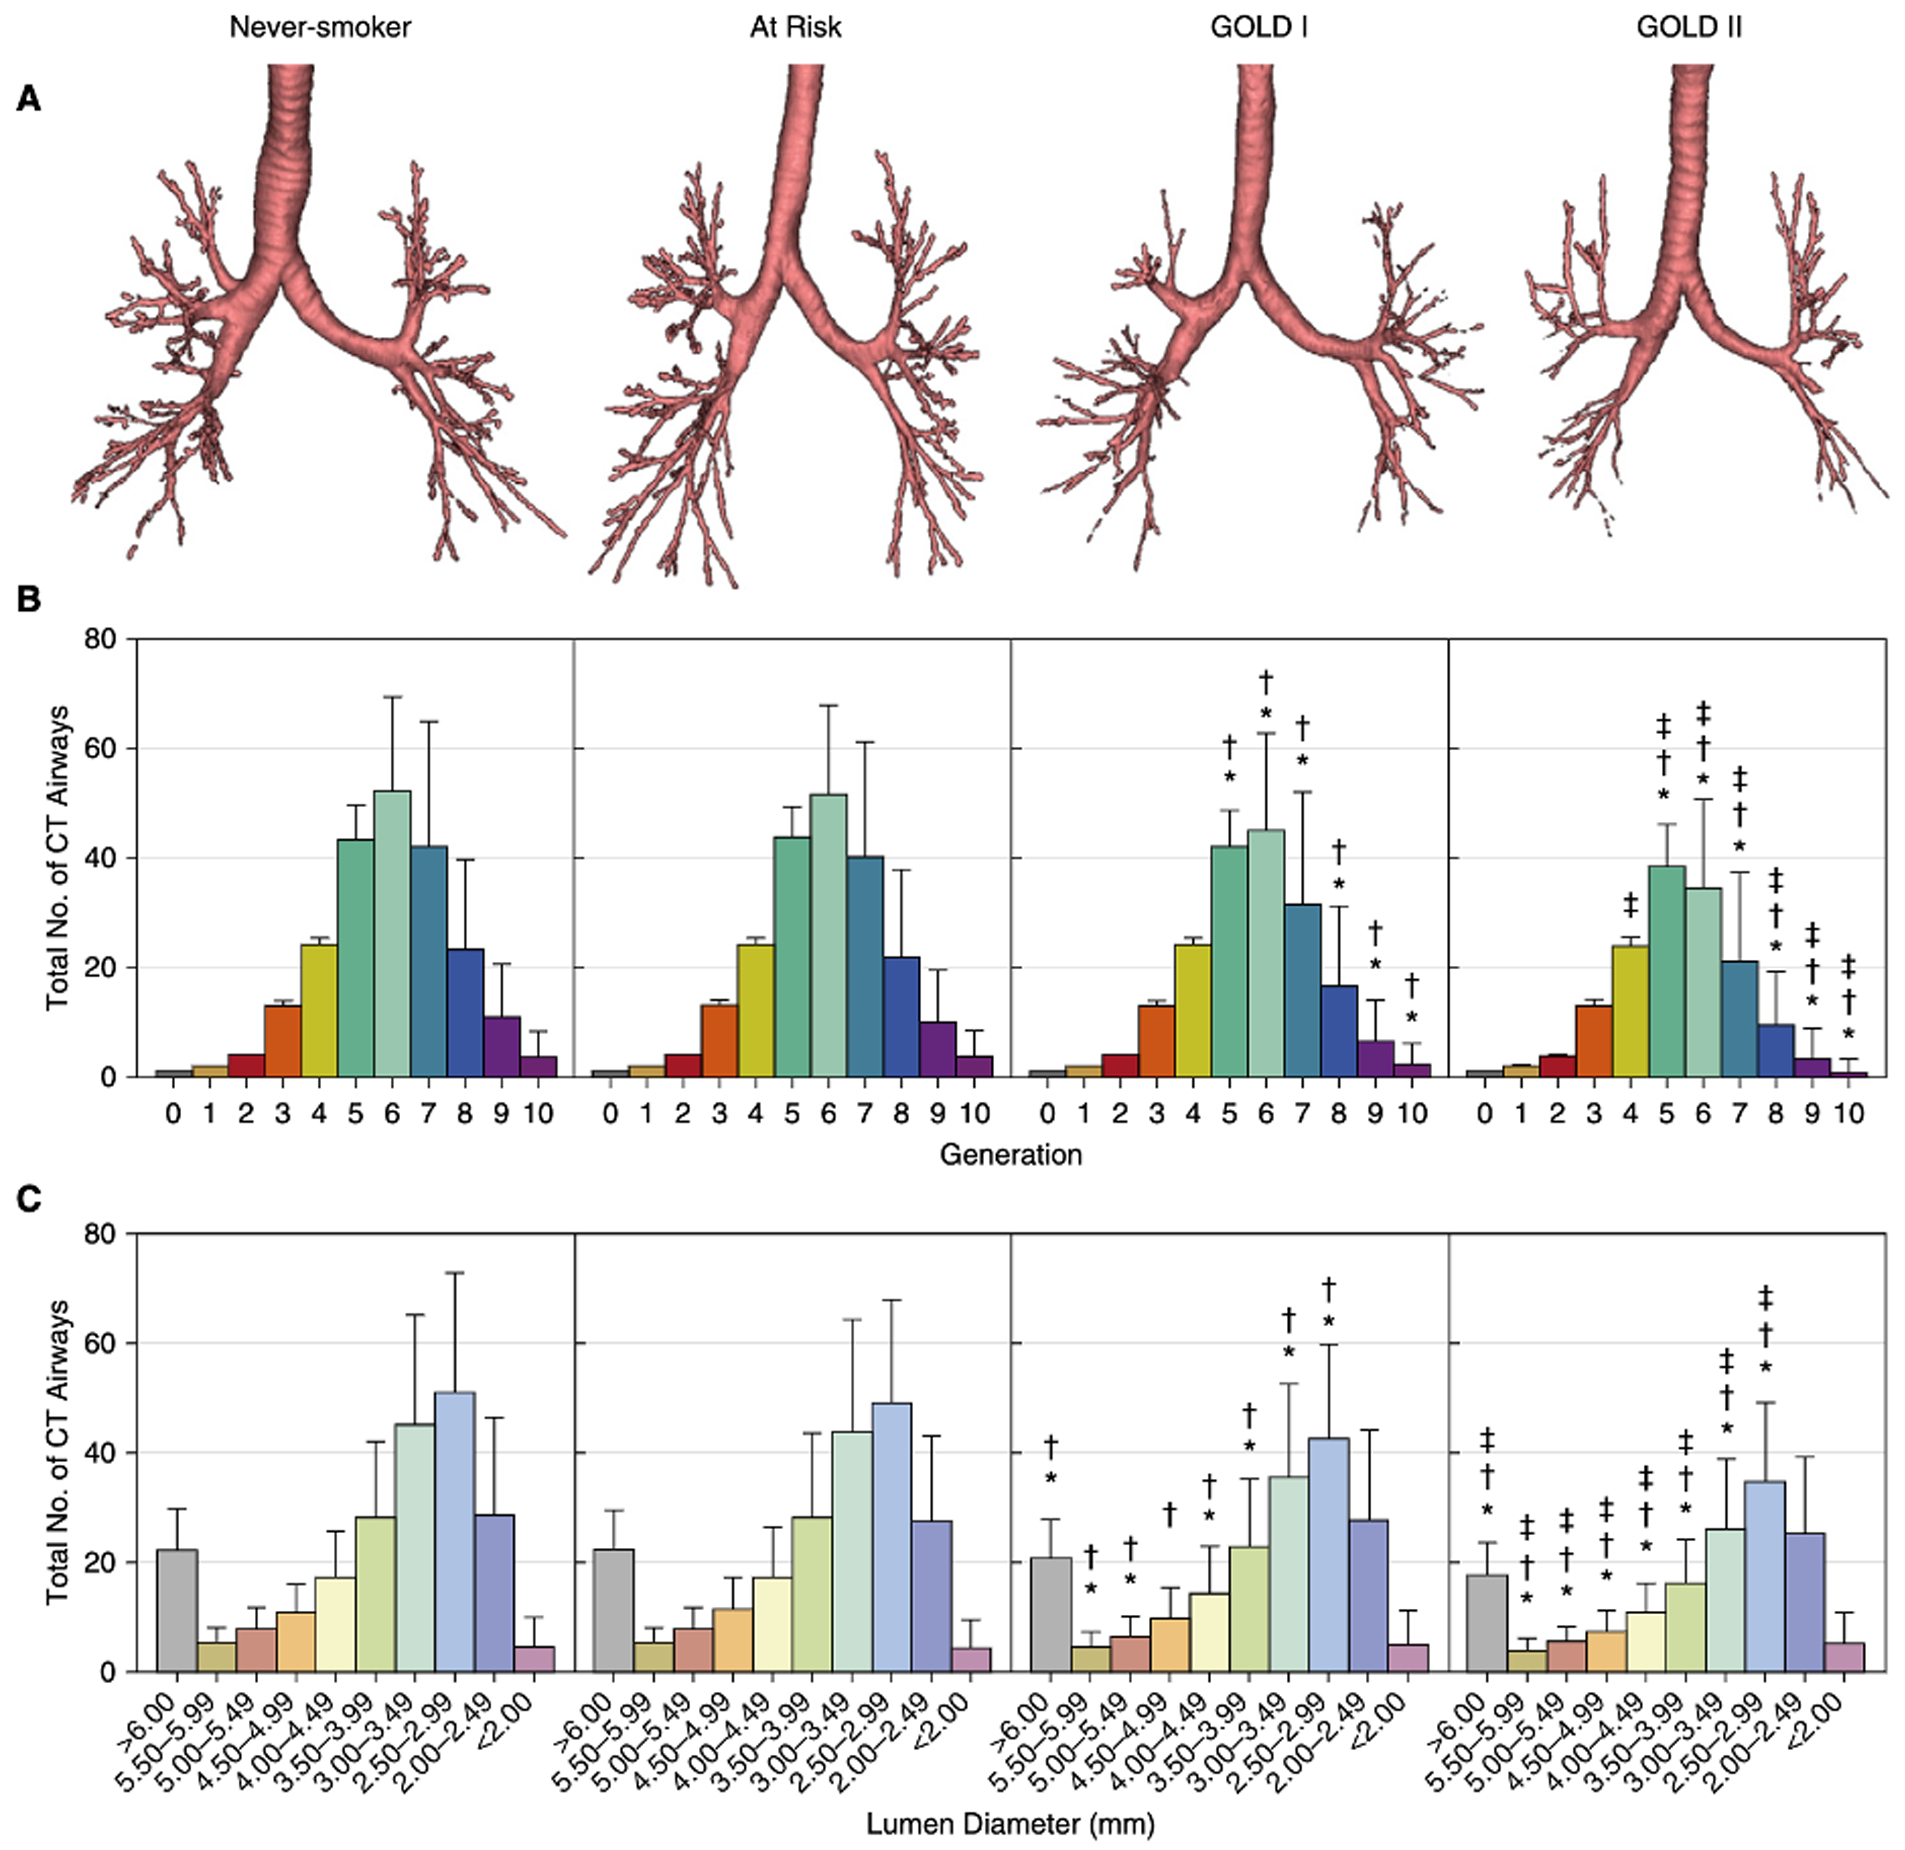
Total Airway Count on Computed Tomography and the Risk of Chronic Obstructive Pulmonary Disease Progression. Findings from a Population-based Study.Am J Respir Crit Care Med. 2018 Jan 1;197(1):56-65. doi: 10.1164/rccm.201704-0692OC. Am J Respir Crit Care Med. 2018. PMID: 28886252
-
Longitudinal changes in structural abnormalities using MDCT in COPD: do the CT measurements of airway wall thickness and small pulmonary vessels change in parallel with emphysematous progression?Int J Chron Obstruct Pulmon Dis. 2017 Feb 13;12:551-560. doi: 10.2147/COPD.S121405. eCollection 2017. Int J Chron Obstruct Pulmon Dis. 2017. PMID: 28243075 Free PMC article.
-
Using Novel Computed Tomography Analysis to Describe the Contribution and Distribution of Emphysema and Small Airways Disease in Chronic Obstructive Pulmonary Disease.Ann Am Thorac Soc. 2019 Aug;16(8):990-997. doi: 10.1513/AnnalsATS.201810-669OC. Ann Am Thorac Soc. 2019. PMID: 30892055
-
Using pulmonary imaging to move chronic obstructive pulmonary disease beyond FEV1.Am J Respir Crit Care Med. 2014 Jul 15;190(2):135-44. doi: 10.1164/rccm.201402-0256PP. Am J Respir Crit Care Med. 2014. PMID: 24873985 Review.
-
Quantitative computed tomography measurements to evaluate airway disease in chronic obstructive pulmonary disease: Relationship to physiological measurements, clinical index and visual assessment of airway disease.Eur J Radiol. 2016 Nov;85(11):2144-2151. doi: 10.1016/j.ejrad.2016.09.010. Epub 2016 Sep 13. Eur J Radiol. 2016. PMID: 27776670 Free PMC article. Review.
Cited by
-
CT-Derived Deep Learning-Based Quantification of Body Composition Associated with Disease Severity in Chronic Obstructive Pulmonary Disease.J Korean Soc Radiol. 2023 Sep;84(5):1123-1133. doi: 10.3348/jksr.2022.0152. Epub 2023 Sep 22. J Korean Soc Radiol. 2023. PMID: 37869106 Free PMC article.
References
-
- Kirby M, Tanabe N, Tan WC, et al. Total Airway Count on Computed Tomography and the Risk of Chronic Obstructive Pulmonary Disease Progression. Findings from a Population-based Study. Am J Respir Crit Care Med. 2018;197(1):56–65. - PubMed
-
- Kirby M, Tanabe N, Vasilescu DM, et al. Computed Tomography Total Airway Count Is Associated with the Number of Micro-Computed Tomography Terminal Bronchioles. Am J Respir Crit Care Med. 2020;201(5):613–615. - PubMed
Grants and funding
LinkOut - more resources
Full Text Sources