[Preprint]. 2021 Mar 17:rs.3.rs-279341.
doi: 10.21203/rs.3.rs-279341/v1.

A humanized mouse model of chronic COVID-19 to evaluate disease mechanisms and treatment options

Affiliations

A humanized mouse model of chronic COVID-19 to evaluate disease mechanisms and treatment options

Esen Sefik et al. Res Sq. .

Update in

  • A humanized mouse model of chronic COVID-19.
    Sefik E, Israelow B, Mirza H, Zhao J, Qu R, Kaffe E, Song E, Halene S, Meffre E, Kluger Y, Nussenzweig M, Wilen CB, Iwasaki A, Flavell RA. Sefik E, et al. Nat Biotechnol. 2022 Jun;40(6):906-920. doi: 10.1038/s41587-021-01155-4. Epub 2021 Dec 17. Nat Biotechnol. 2022. PMID: 34921308 Free PMC article.

Abstract

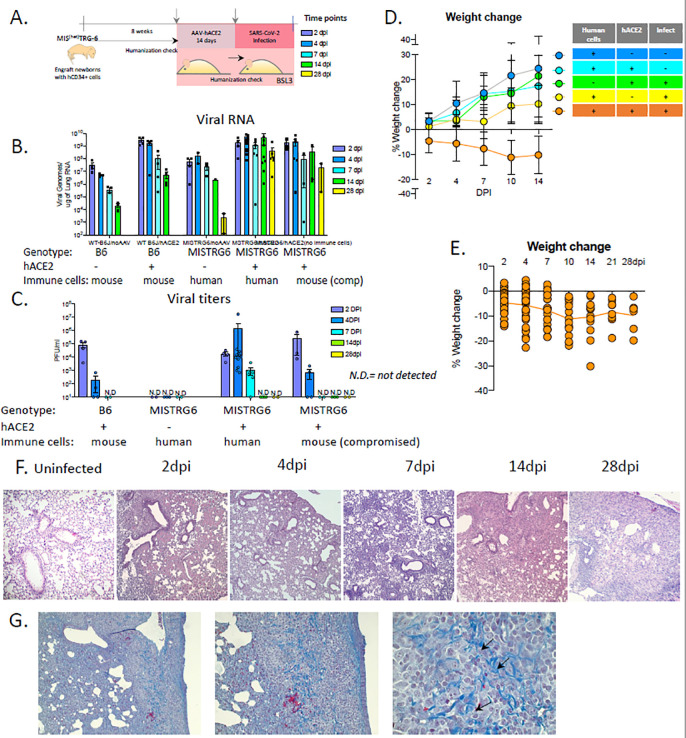
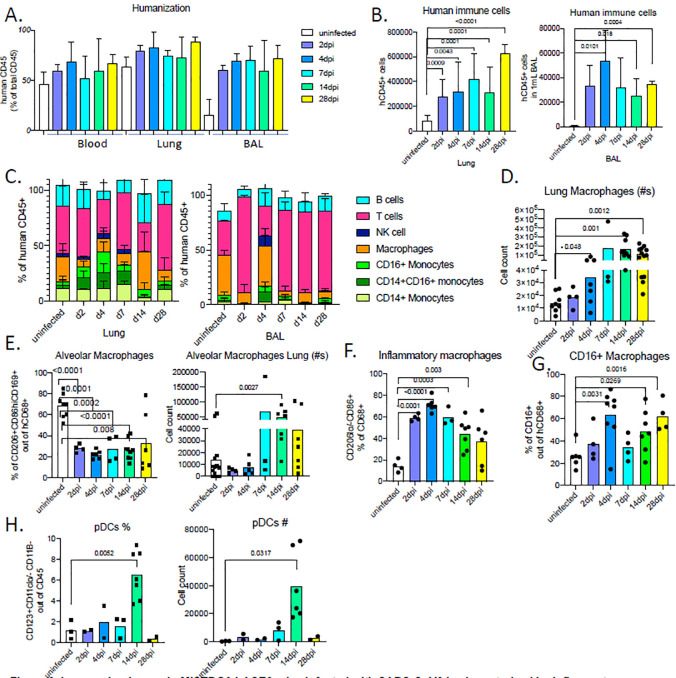
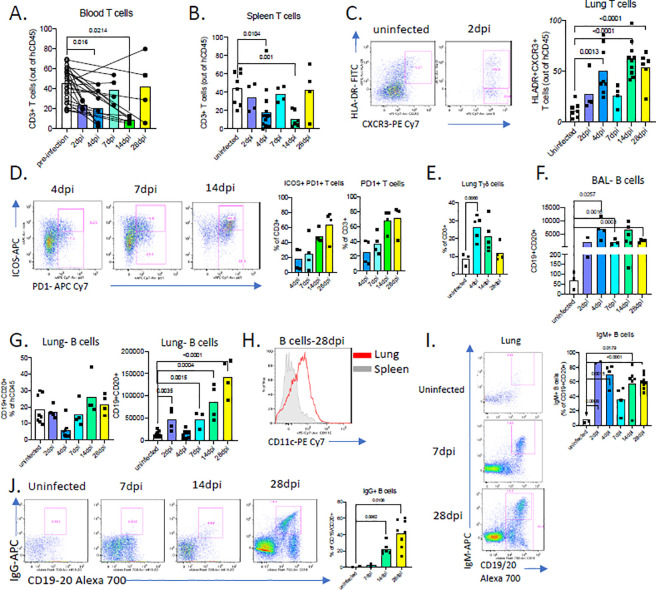
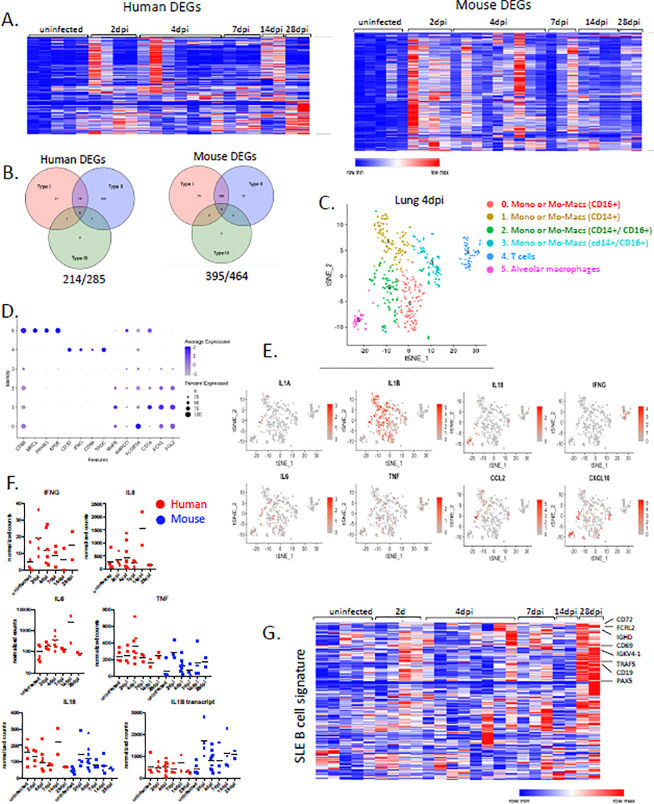
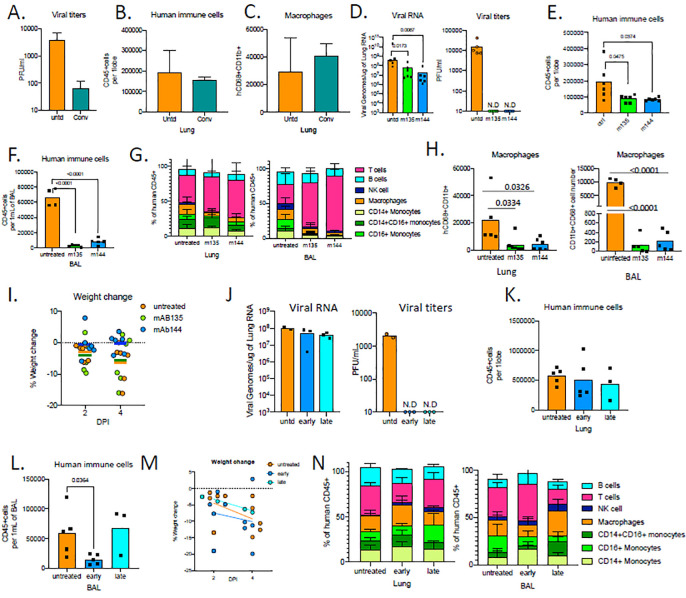
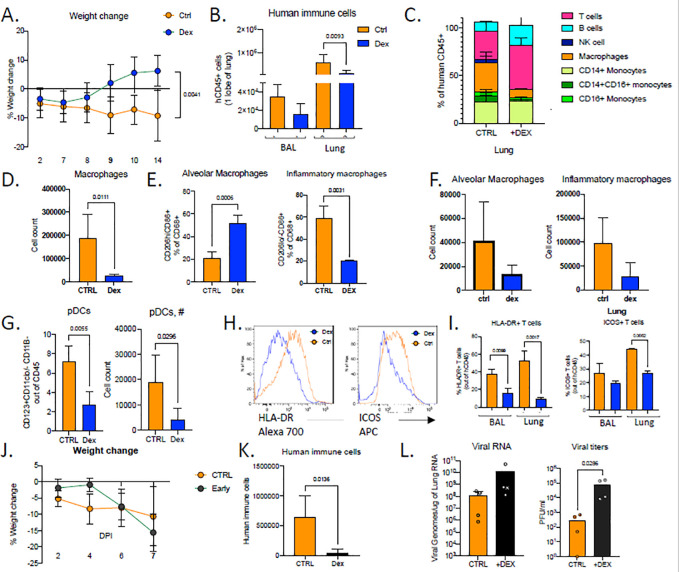
Coronavirus-associated acute respiratory disease, called coronavirus disease 2019 (COVID-19) is an infectious disease caused by severe acute respiratory syndrome coronavirus 2 (SARS-CoV-2). More than 90 million people have been infected with SARS-CoV-2 and more than 2 million people have died of complications due to COVID-19 worldwide. COVID-19, in its severe form, presents with an uncontrolled, hyperactive immune response and severe immunological injury or organ damage that accounts for morbidity and mortality. Even in the absence of complications, COVID-19 can last for several months with lingering effects of an overactive immune system. Dysregulated myeloid and lymphocyte compartments have been implicated in lung immunopathology. Currently, there are limited clinically-tested treatments of COVID-19 with disparities in the apparent efficacy in patients. Accurate model systems are essential to rapidly evaluate promising discoveries but most currently available in mice, ferrets and hamsters do not recapitulate sustained immunopathology described in COVID19 patients. Here, we present a comprehensively humanized mouse COVID-19 model that faithfully recapitulates the innate and adaptive human immune responses during infection with SARS-CoV-2 by adapting recombinant adeno-associated virus (AAV)-driven gene therapy to deliver human ACE2 to the lungs 1 of MISTRG6 mice. Our unique model allows for the first time the study of chronic disease due to infection with SARS-CoV-2 in the context of patient-derived antibodies to characterize in real time the potential culprits of the observed human driving immunopathology; most importantly this model provides a live view into the aberrant macrophage response that is thought to be the effector of disease morbidity and ARDS in patients. Application of therapeutics such as patient-derived antibodies and steroids to our model allowed separation of the two aspects of the immune response, infectious viral clearance and immunopathology. Inflammatory cells seeded early in infection drove immune-patholgy later, but this very same early anti-viral response was also crucial to contain infection.


Conflict of interest statement

Competing financial interests

The authors declare no competing financial interests.

Figures

Figure 1.
Figure 1.. MISTRG6 humanized mice that transiently express hACE2 can be infected with SARS-CoV-2.
A. Schematic of experimental design. B. Viral RNA (quantification of N gene) C. Viral titers measured by PFU in homogenized lung tissue at 2, 4, 7 14, 28 days post infection (dpi) in B6 control or reconstituted or unengrafted MISTRG6 mice expressing or lacking human ACE2. N=2–24. Means with SD of at least 2 independent experiments are presented. D. Weight change during the course of infection plotted as percent change compared with original weight measured just before inoculation with SARS-Cov2. N=6–37. Means with SD of at least three independent experiments are presented. E. Weight change of individual mice reconstituted MISTRG6-hACE2 mice on 2,4,7,10,14,21 and 28dpi. N=6–37. F. Histopathology by H&E staining of infected (2, 4, 7, 14 and 28dpi) or uninfected lungs. N=4–8 per time point. Representatives of at least three independent experiments are presented. G. Trichrome staining of infected lungs at 28dpi. Arrows indicate areas with Collagen deposition. N=4–8 per time point. Human ACE2 was delivered by AAV to lungs of wild type or reconstituted adult MISTRG6 mice. Mice were then infected (or left uninfected) intranasally with SARS-CoV-2 and weighed on 0, 2, 4, 7, 14, 21 and 28 dpi.
Figure 2.
Figure 2.. Immune landscape in MISTRG6-hACE2 mice infected with SARS-CoV2 is characterized by inflammatory macrophages and monocytes.
A. Humanization measured by ratio of human CD45+ cells in total CD45+ cells (mouse and human CD45+ combined) in blood, lung and BAL of uninfected and infected MISTRG6-hACE2 mice. N=4–12. B. Human immune cell numbers in lungs and BAL of uninfected and infected mice at 2,4,7,14,28 dpi. N=4–12. Unpaired, two-tailed t-test. Only P-values <0.05 are plotted. C. Human immune lineages lungs and BAL of uninfected and infected mice at 2,4,7,14,28 dpi within the human CD45+ population. Classical monocytes (CD14+), Intermediate monocytes (CD14+CD16), non-classical monocytes (CD16+CD14−), macrophages (CD68+), NK cells (NKP46+), T cells (CD3+), B cells (CD19+ and/or CD20+). N=4–12. Means with SD are plotted. D. Number of human macrophages in lungs of uninfected and infected mice at 2,4,7,14,28 dpi. N=4–10. Unpaired, two-tailed t-test. E. Frequency and number of human alveolar macrophages marked by CD206hi, CD86+, CD169+ expression within the hCD45+CD68+ population in the lungs of uninfected and infected mice at 2,4,7,14,28 dpi. N=3–10. Unpaired, two-tailed t-test. F. Frequency of inflammatory human lung macrophages marked by CD206-/lo, CD86hi macrophages within the hCD45+CD68+ population in the lungs of uninfected and infected mice at 2,4,7,14,28 dpi. N=3–10. Unpaired, two-tailed t-test. P values<0.05 plotted. G. Frequency of CD16+ human lung macrophages marked by CD16+ macrophages within the hCD45+CD68+ population in the lungs of uninfected and infected mice at 2,4,7,14,28 dpi. N=4–8. Unpaired, two-tailed t-test. P values<0.05 plotted H. Frequency and number of human pDCs marked by CD123+ CD11b− CD11c−/lo cells withing hCD45+ population in the lungs of uninfected and infected mice at 2,4,7,14,28 dpi Means of at least 3 independent experiments are presented. Mean with SD or individual values are plotted.
Figure 3.
Figure 3.. COVID-19 in MISTRG6 presents with systemic T cell lymphopenia.
A. Frequencies of human CD3+ T cells within human CD45+ population in the blood pre and post-infection (2,4,7,14,28dpi). Lines connect pre and post-infection values for the same mouse. Paired, two-tailed t-test. N=4–6 per infection time point. P-values<0.05 are plotted. B. Frequencies of human CD3+ T cells within human CD45+ population in the spleens of uninfected and infected mice at 2,4,7,14,28 dpi. Mean of at least three independent experiment. Unpaired, two-tailed t-test. N=4–14 per infection time point. P-values<0.05 are plotted. C. Representative flow cytometry plots of HLA-DR and CXCR3 expression on human lung T cells and frequencies of HLA-DR+CXCR3+ lung T cells in uninfected and infected mice at 2,4,7,14,28dpi. N=4–10. Unpaired, two-tailed t-test. P-values<0.05 are plotted. D. Representative flow cytometry plots of ICOS and PD1 expression on human lung T cells and frequencies Icos+ PD1+ or PD1+ T cells in uninfected and infected mice (4,7,14,28dpi). N=4. E. Frequencies of TCRgamma/delta T cells among human lung T cells in uninfected and infected mice (4,14,28dpi). N=3–5. P-values<0.05 are plotted. F. Numbers of human B cells in the BAL of uninfected or infected mice at 2,4,7,14,28 dpi. N=3–6. Unpaired, two-tailed t-test. P-values<0.05 are plotted. G. Frequencies and numbers of human B cells within hCD45+ population in the lungs of uninfected or infected mice at 2,4,7,14,28 dpi. N=4–8. Unpaired, two-tailed t-test. P-values<0.05 are plotted. H. CD11 c expression on CD19+ B cells from spleen and lungs of infected mice at 28dpi. N=4 I. Representative flow cytometry plots and frequencies of IgM+ B cells in the lungs of uninfected and infected mice 2,4,7,14,28dpi. N=2–8 J. Representative flow cytometry plots and frequencies of IgG+ B cells in the lungs of uninfected and infected mice 7,14,28dpi. N=2–8
Figure 4.
Figure 4.. SARS-CoV-2 lungs sustain interferon responsive gene signatures and display an SLE like features
A. Heatmap of differentially regulated human and mouse genes (combined list of genes Log2, FoldChange >1 in each infected time point vs uninfected lungs; adjusted p value<0.05; mean normalized count>5). Transformed normalized counts in lungs of uninfected or infected MISTRG6-hACE2 plotted over the course of infection were clustered using Spearman Correlation. Row min and max of transformed values, calculated by subtracting row mean and diving by STD for each gene across all samples, are visualized. B. Distribution of interferon responsive genes within human and mouse DEGs C. t-distributed stochastic neighbor embedding (t-SNE) plot with clustering results of single cell RNA sequencing of human immune cells from lungs at 4dpi. Single cell suspensions from whole infected lung at 4dpi were processed and sequenced. There were 421 cells identified as human immune cells. D. Expression of cluster identifying genes in human immune cells described in C. E. Cluster distribution and expression of human inflammatory cytokines for clusters described in C-D. F. Normalized counts for inflammatory cytokines implicated in COVID19 patients. Counts were reported separately for human(red) and mouse(blue) cytokine genes. G. Heatmap of genes that are implicated in SLE like B cells based on GSE10325 (Hutcheson et al., 2007) in infected lungs of MISTRG6 mice at 2,4,7.14.28 dpi. Row min and max of transformed values, calculated by subtracting row mean and diving by STD for each gene across all samples, are visualized.
Figure 5.
Figure 5.. Human monoclonal recombinant antibodies as prophylactic and therapeutic interventions impact disease outcome.
A. Viral titers measured by PFU in homogenized lung tissue at 4 dpi in MISTRG6-hACE2 mice that received prophylactic treatment of convalescent patient plasma or left untreated. N=2–4 B. Human immune cells at 4 dpi in lungs of MISTRG6-hACE2 mice that received prophylactic treatment of convalescent patient serum or left untreated. N=2–4 C. Human macrophages (hCD45+ hCD68+) at 4 dpi in lungs of MISTRG6-hACE2 mice that received prophylactic treatment of convalescent patient serum or left untreated. N=2–4 D. Viral RNA and viral titers measured by PFU in homogenized lung tissue at 4 dpi in MISTRG6-hACE2 mice that received prophylactic treatment of monoclonal antibody clone 135 (m135) or clone 144(m144) 8 hours prior to infection or left untreated (untd). N=4–6. Mann-Whitney, two-tailed test. E. Human immune cells in lungs of MISTRG6-hACE2 mice received a prophylactic treatment of monoclonal antibody clone 135 (m135) or clone 144(m144) 8 hours prior to infection or left untreated (untd). N=5–6 F. Human immune cells in BAL of MISTRG6-hACE2 mice received a prophylactic treatment of monoclonal antibody clone 135 (m135) or clone 144(m144) 8 hours prior to infection or left untreated (untd). N=4–6 G. Human immune lineages lungs and BAL of mAb treated or untreated mice at 4 dpi within the human CD45+ population. Classical monocytes (CD14+), Intermediate monocytes (CD14+CD16), non-classical monocytes (CD16+CD14-), macrophages (CD68+), NK cells (NKP46+), T cells (CD3+), B cells (CD19+ and/or CD20+). MISTRG6-hACE2 mice received a prophylactic treatment of monoclonal antibody clone 135 (m135) or clone 144(m144) 8 hours prior to infection or left untreated (untd). N=4–6 H. Human macrophages (hCD45+ hCD68+) at 4 dpi in lungs and BAL of MISTRG6-hACE2 mice that received prophylactic treatment of mAbs (clone 135 or 144) or left untreated. N=4–6 I. Weight change in mAb treated mice (prophylaxis) at 2days and 4days post-infection plotted as percent change compared with original weight measured just before inoculation with SARS-Cov2. N=4–6 J. Viral RNA and viral titers measured by PFU in homogenized lung tissue at 4 dpi in MISTRG6-hACE2 mice that received post infection treatment of a mixed cocktail of monoclonal antibodies clone 135 (m135) and clone 144(m144) or left untreated (untd). Early treatment groups were treated 11hours post-infection and late treatment 35 hours post-infection. K. Human immune cells in lungs of MISTRG6-hACE2 mice that received early, late or no treatment of monoclonal antibody mix. Unpaired, two-tailed t-test. N=3–5. P-values<0.05 are plotted. L. Human immune cells in BAL of MISTRG6-hACE2 mice that received early, late or no treatment of monoclonal antibody mix. Unpaired, two-tailed t-test. N=3–5. P-values<0.05 are plotted. M. Weight change upon mAb therapeutic treatment at 2days and 4days post-infection plotted as percent change compared with original weight measured just before inoculation with SARS-Cov2. N=3–5. N. Human immune lineages lungs and BAL of mAb treated or untreated mice at 4 dpi within the human CD45+ population. Classical monocytes (CD14+), Intermediate monocytes (CD14+CD16), non-classical monocytes (CD16+CD14−), macrophages (CD68+), NK cells (NKP46+), T cells (CD3+), B cells (CD19+ and/or CD20+). MISTRG6-hACE2 mice received a prophylactic treatment of monoclonal antibody clone 135 (m135) or clone 144(m144) 8 hours prior to infection or left untreated (untd). MISTRG6 mice were engrafted neonatally with CD34+ cells isolated from at least 2 donors. Pooled, infection matched representative results of at least 2 independent experiments are presented. P-values<0.05 are plotted. Mean with SD or individual values are plotted.
Figure 6.
Figure 6.
Accurate timing of corticosteroids is necessary to balance viral clearance and prevent immunopathology. A. Weight change in dexamethasone treated or control mice during SARS-Cov2 infection plotted as percent change compared with original weight prior to viral inoculation. Mice were treated with dexamethasone at 7,8,9 dpi. N=6–8. Unpaired, two-tailed t-test. B. Human immune cells in 14dpi lungs and BAL of MISTRG6-hACE2 mice treated with dexamethasone at 7, 8 9 dpi or left untreated. C. Human immune lineages lungs of dexamethasone treated or untreated mice within the human CD45+ population. Classical monocytes (CD14+), Intermediate monocytes (CD14+CD16), non-classical monocytes (CD16+CD14−), macrophages (CD68+), NK cells (NKP46+), T cells (CD3+), B cells (CD19+ and/or CD20+). MISTRG6-hACE2 mice were treated with dexamethasone at 7,8,9dpi. D. Number of human macrophages in lungs of dexamethasone treated and untreated mice at 14dpi. E. Frequencies of alveolar or inflammatory macrophages in the lungs of MISTRG6-hACE2 mice that were treated with dexamethasone or left untreated. F. Numbers of alveolar or inflammatory macrophages in the lungs of MISTRG6-hACE2 mice that were treated with dexamethasone or left untreated. G. Frequencies and numbers of pDCs at 14dpi in the lungs of dexamethasone treated or control mice. H. Representative plots for HLA-DR expression in lung T cells at 14dpi in dexamethasone treated or control mice. I. Frequencies of HLA-DR+ or ICOS+ T cells at 14dpi in the lungs and BAL of dexamethasone treated or control mice J. Weight change in dexamethasone treated or control mice during SARS-Cov2 infection plotted as percent change compared with original weight prior to viral inoculation. Mice were treated with dexamethasone at 3,4,5dpi. N=4–6. K. Human immune cells in lungs of MISTRG6-hACE2 mice treated with dexamethasone at 3, 4 5 dpi or left untreated (ctrl). N=4–6. Unpaired, two-tailed t-test. L. Viral RNA and viral titers measured by PFU in homogenized lung tissue at 7 dpi in dexamethasone treated or control mice. N=4–6. Mann-Whitney test, two-tailed. MISTRG6 mice were engrafted with CD34+ cells neonatally isolated from at least 2 donors. Pooled or infection matched representative results of at least 2 independent experiments are presented. Only P-values <0.05 are plotted. Mean with SD or individual values are plotted.

References

    1. Letko M., Marzi A. & Munster V. Functional assessment of cell entry and receptor usage for SARS-CoV-2 and other lineage B betacoronaviruses. Nature microbiology 5, 562–569 (2020). - PMC - PubMed
    1. Huang C. et al. Clinical features of patients infected with 2019 novel coronavirus in Wuhan, China. The Lancet 395, 497–506, doi:10.1016/S0140-6736(20)30183-5 (2020). - DOI - PMC - PubMed
    1. Mehta P. et al. COVID-19: consider cytokine storm syndromes and immunosuppression. The Lancet (2020). - PMC - PubMed
    1. Xu Z. et al. Pathological findings of COVID-19 associated with acute respiratory distress syndrome. The Lancet. Respiratory medicine 8, 420–422, doi:10.1016/S2213-2600(20)30076-X (2020). - DOI - PMC - PubMed
    1. Theocharides A. P., Rongvaux A., Fritsch K., Flavell R. A. & Manz M. G. Humanized hemato-lymphoid system mice. Haematologica 101, 5–19, doi:10.3324/haematol.2014.115212 (2016). - DOI - PMC - PubMed

Publication types

LinkOut - more resources