[Preprint]. 2021 Mar 9:2021.03.08.434499.
doi: 10.1101/2021.03.08.434499.

The N501Y spike substitution enhances SARS-CoV-2 transmission

Affiliations

The N501Y spike substitution enhances SARS-CoV-2 transmission

Yang Liu et al. bioRxiv. .

Update in

Abstract

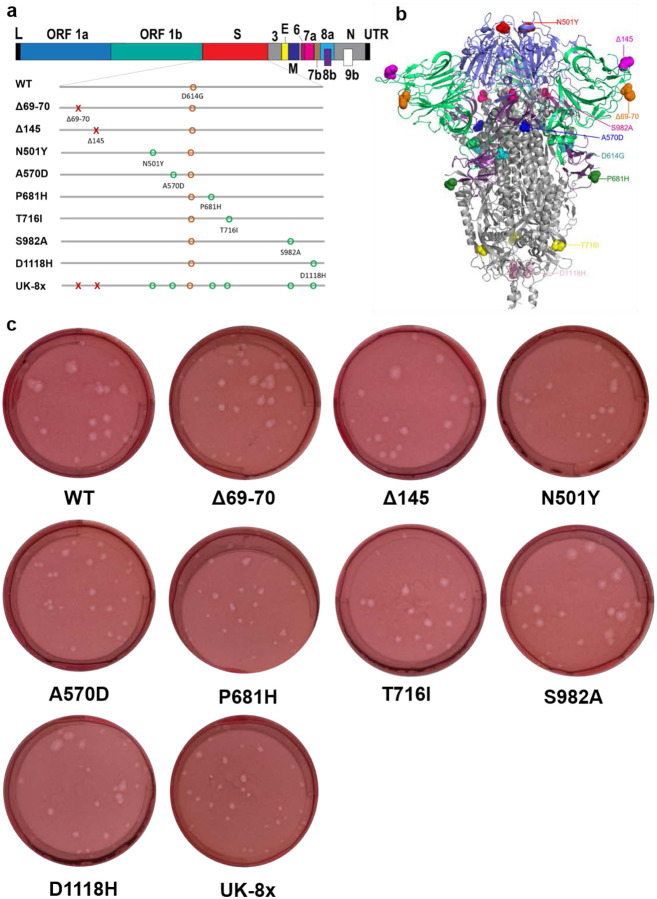
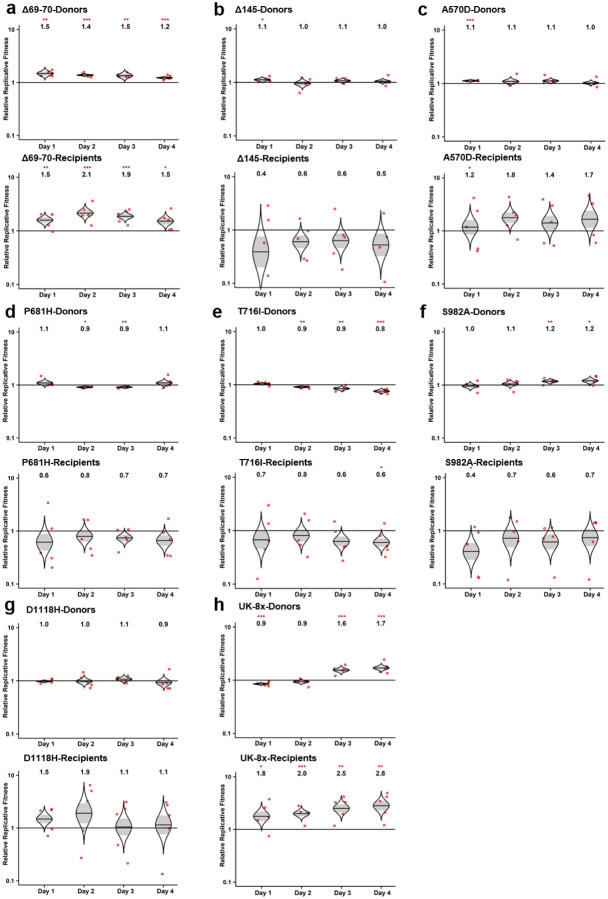
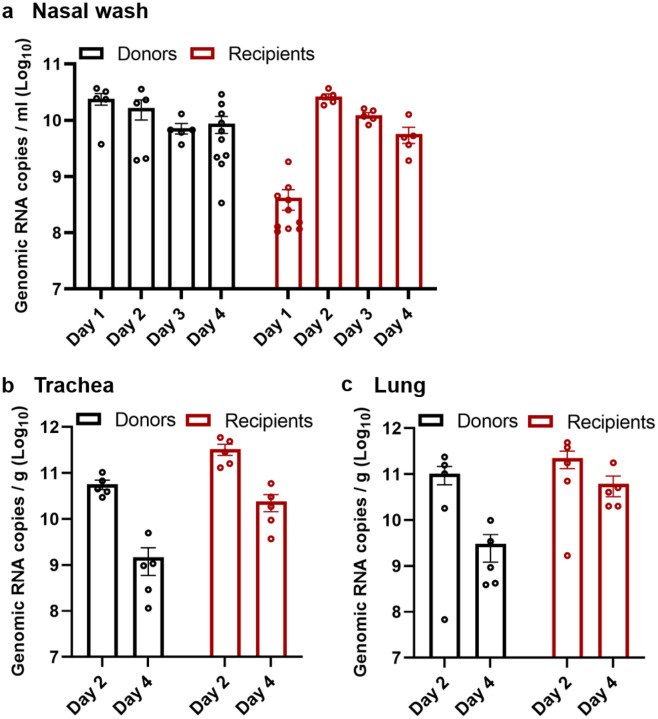
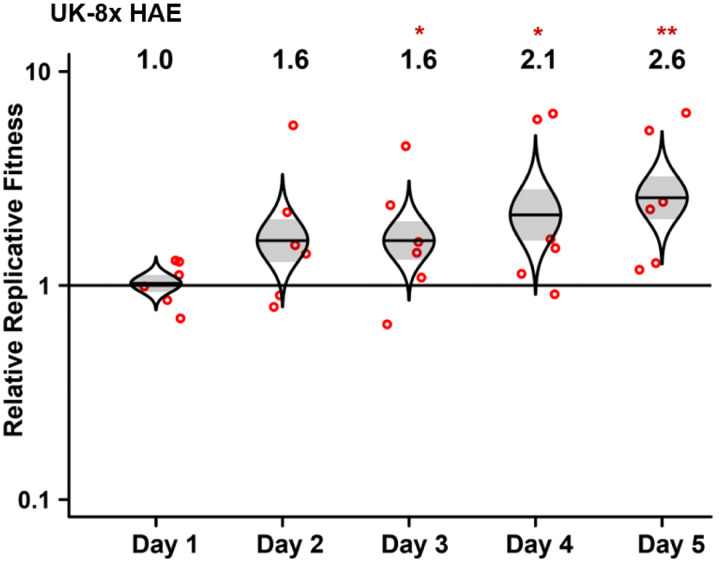
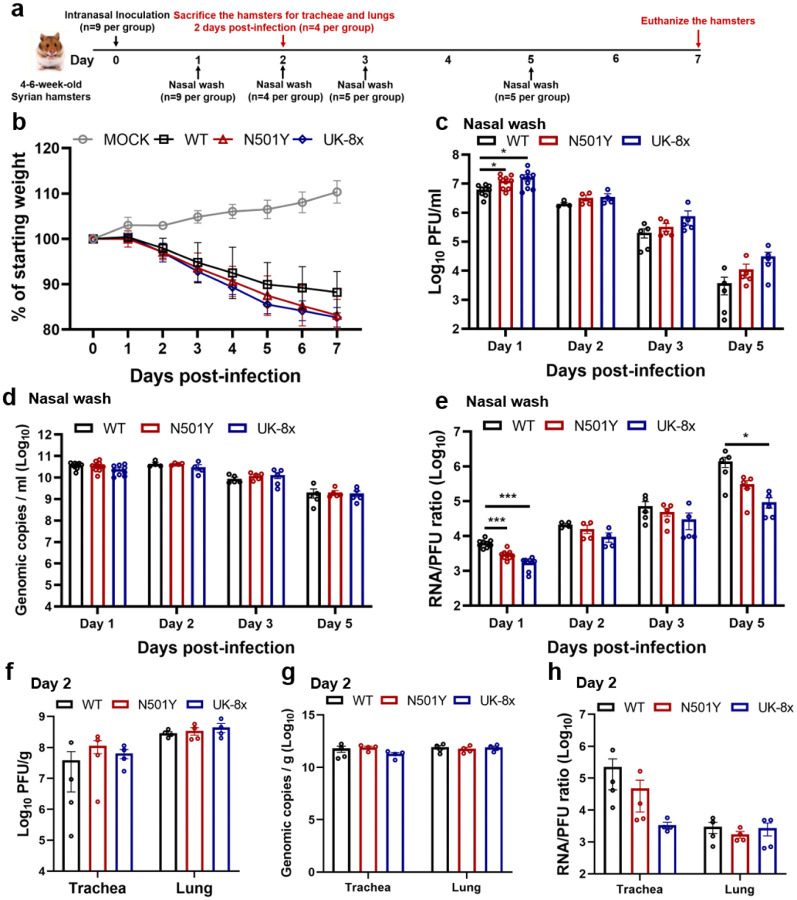
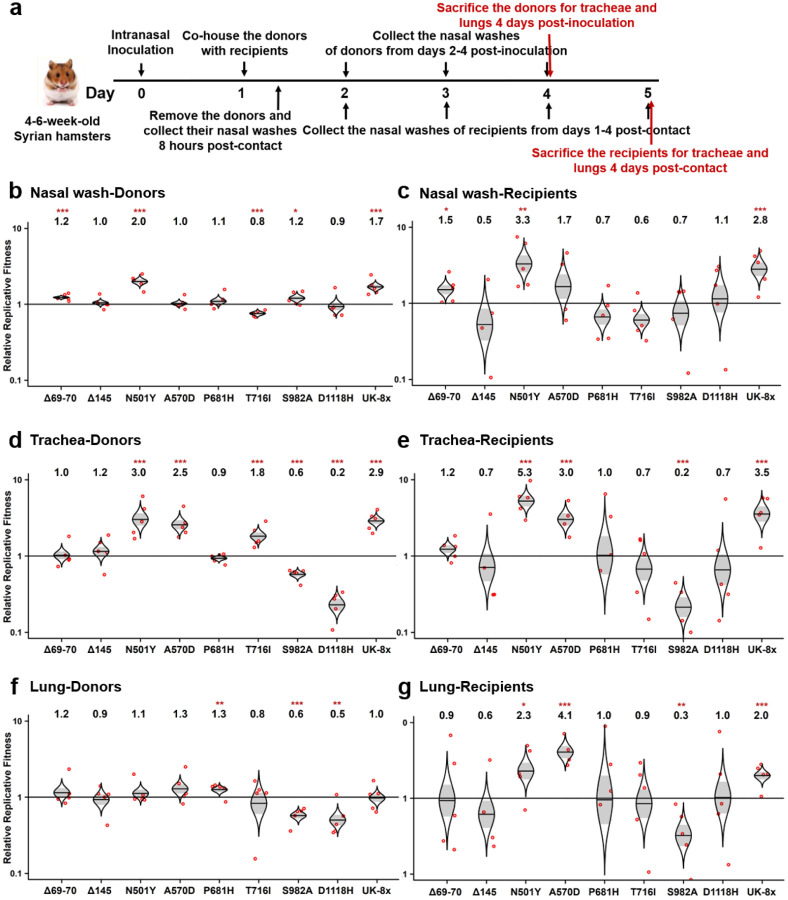
Beginning in the summer of 2020, a variant of SARS-CoV-2, the cause of the COVID-19 pandemic, emerged in the United Kingdom (UK). This B.1.1.7 variant increased rapidly in prevalence among sequenced strains, attributed to an increase in infection and/or transmission efficiency. The UK variant has 19 nonsynonymous mutations across its viral genome including 8 substitutions or deletions in the spike protein, which interacts with cellular receptors to mediate infection and tropism. Here, using a reverse genetics approach, we show that, of the 8 individual spike protein substitutions, only N501Y exhibited consistent fitness gains for replication in the upper airway in the hamster model as well as primary human airway epithelial cells. The N501Y substitution recapitulated the phenotype of enhanced viral transmission seen with the combined 8 UK spike mutations, suggesting it is a major determinant responsible for increased transmission of this variant. Mechanistically, the N501Y substitution improved the affinity of the viral spike protein for cellular receptors. As suggested by its convergent evolution in Brazil and South Africa, our results indicate that N501Y substitution is a major adaptive spike mutation of major concern.


Conflict of interest statement

Competing financial interests

X.X., V.D.M., and P.-Y.S. have filed a patent on the reverse genetic system and reporter SARS-CoV-2. Other authors declare no competing interests.

Figures

Extended Data Figure 1.
Extended Data Figure 1.. The construction of mutants and their plaque morphologies.
a, The reverse genetic construction design of all the individual and combined mutations on the wt D614G backbone. Numbers on the upper genome map refer to open reading frames (ORFs). E, envelope glycoprotein gene; L, leader sequence; M, membrane glycoprotein gene; N, nucleocapsid gene; UTR, untranslated region. b, The location of all 8 UK B.1.1.7 substitutions and D614G on the SARS-CoV-2 spike protein trimer. c, The morphologies of all the rescued mutant SARS-CoV-2 variants. The plaques were stained 2.5 days post-infection of Vero E6 cells.
Extended Data Figure 2.
Extended Data Figure 2.. The competition of other SARS-CoV-2 mutants with wt in hamsters.
a-h, Eight SARS-CoV-2 spike mutants: Δ69–70 (a), Δ145 (b), A570D (c), P681H (d), T716I (e), S982A (f), D1118H (g) and UK-8x (h) were mixed with wt virus at a ratio of approximately 1:1. The mixture was then inoculated intranasally into donor hamsters and transmitted to the recipient hamsters following the scheme in Figure 1a. The total titer for infection was 105 PFU per hamster. The ratios of the mutant:wt in the nasal washes of hamsters sampled 1–4 days after infection were estimated by Sanger sequencing. Red dots represent individual animals (n = 5), the horizontal lines in each catseye represent the mean, shaded regions represent standard error of the mean; y-axes use a log10 scale. Black numbers above each set of values (catseye) indicate the relative fitness estimates. P values are calculated for the group (strain) coefficient for each linear regression model. *p<0.05; **p<0.01; ***p<0.001.
Extended Data Figure 3.
Extended Data Figure 3.. The replication kinetics of N501Y/wt mixed viruses in the competition assay in hamsters.
a-c, The N501Y variant was mixed with wt virus and inoculated intranasally into hamsters. The replication kinetics of the mixed viruses in the nasal washes (a), tracheae (b) and lungs (c) from both donor and recipient hamsters were measured by real-time qPCR. The nasal wash samples were collected from 1–4 days post-inoculation (donors) or post-contact (recipients). The organ titers in tracheae and lungs from donors and recipients were determined at 2- or 4-days post-inoculation or post-contact. Dots represent individual hamsters (n=10 for nasal wash, n=5 for organ titers). The values in the graph represent the mean ± standard error of the mean.
Extended Data Figure 4.
Extended Data Figure 4.. The advantage of the UK-8x mutant during the transmission from donor to recipient hamsters.
a,b, The ratios of mixed viruses in the nasal washes (a), tracheae and lungs (b) of recipient hamsters were compared to the ratios of N501Y:wt measured on the day 1 nasal wash of donor hamsters to assess fitness for transmission to and early replication in the recipient hamsters. The total infection titer of the mixed viruses was 105 PFU per hamster. Red dots represent individual animals (n=5), the horizontal lines in each catseye represent the mean, shaded regions represent standard error of the mean; y-axes use a log10 scale. Black numbers above each set of values (catseye) indicate the relative fitness estimates. P values are calculated for the group (strain) coefficient for each linear regression model. ***p<0.001.
Extended Data Figure 5.
Extended Data Figure 5.. The replication kinetics of the N501Y and UK-8x mutants on Vero E6 and calu-3 cells.
a-f, The wt, N501Y and UK-8x mutant viruses were inoculated on Vero E6 (a,c,e) and calu-3 cells (b,d,f) respectively. The amounts of infectious virus (a,b) and genomic RNA (c,d) were quantified by plaque assay and RT–qPCR, respectively. The genomic RNA:PFU ratio (e,f) was calculated as an indication of virion infectivity. The Vero E6 and calu-3 were infected at a MOI of 0.01 and 0.1, respectively. The detection limit of the plaque assay was 10 PFU/ml. Dots represent individual biological replicates (n=6) pooled from two independent experiments. The values in the graph represent the mean ± standard error of the mean. A non-parametric Mann-Whitney test was used to determine significant differences. P values were adjusted using the Bonferroni correction to account for multiple comparisons. Differences were considered significant if *p<0.025; **p<0.005.
Extended Data Figure 6.
Extended Data Figure 6.. The competition assay of UK-8x against wt on primary human airway epithelial cells.
The UK-8x variant was mixed with wt virus and inoculated on the human airway epithelial (HAE) cells at a total MOI of 5. The ratios of UK-8x mutant to the wt virus were measured by Sanger sequencing. Red dots represent individual biological replicates (n=6), pooled from 2 independent experiments. The horizontal lines in each catseye represent the mean, shaded regions represent standard error of the mean; y-axes use a log10 scale. Black numbers above each set of values (catseye) indicate the relative fitness estimates. P values are calculated for the group (strain) coefficient for each linear regression model. *p<0.05; **p<0.01.
Extended Data Figure 7.
Extended Data Figure 7.. The spike N501Y substitution benefits viral infection of hamster upper airways.
a, Design of the hamster infection kinetic studies. The wt, N501Y and UK-8x viruses were intranasally inoculated into hamsters at a titer of 104 PFU per hamster. Nine hamsters were utilized for the initial infection in each group. At 2 days-post infection, 4 hamsters were sacrificed for organ collections. The nasal washes of the hamsters were collected on days 1, 3 and 5 post-infection or before sacrifice. b, Weight change in hamsters following infection by the N501Y (n=5) and UK-8x (n=5) mutants compared to the wt (n=5). MOCK group (n=4) served as the negative (uninfected) control. The body weights were measured form 1–7 days post-infection. The weight loss data are shown as mean ± standard deviation and statistically analyzed using two-way ANOVA Turkey’s multiple comparison. No significant differences were seen between the N501Y/UK-8x and wt groups. c-h, The infection of N501Y and UK-8x mutants compared to the wt in the nasal washes (c-e) collected 1, 2, 3, or 5 days post-infection and in the organs (f-h) 2 days post-infection. The amounts of infectious virus (c,f) and genomic RNA (d,g) were quantified by plaque assay and RT–qPCR, respectively. The genomic RNA:PFU ratio (e,h) was calculated as an indication of virion infectivity. The detection limitation of the plaque assay was 10 PFU/ml. The values in the graph represent the mean ± standard error of the mean. A non-parametric Mann-Whitney test was used to determine significant differences. P values were adjusted using the Bonferroni correction to account for multiple comparisons. Differences were considered significant if *p<0.025; ***p<0.0005.
Figure 1.
Figure 1.. The screening of the SARS-CoV-2 UK variant spike substitutions in hamsters by competition assay.
a, Design of the hamster competition fitness studies. The mutant viruses were mixed with wild type G614 virus and inoculated into donor hamsters intranasally (I.N.) at a total titer of 105 PFU per hamster. The donor hamsters were co-housed with recipient hamsters 1 day post-infection. After 8 hours of contact, the donors were removed. All hamsters were subjected to nasal washes daily 1–4 days after infection and sacrificed for organ collections 4-days post-inoculation or post-contact. b-g, The competition of different UK variants with wild-type (wt) G614 virus. b,d,f, Final:inoculum ratios of 8 individual UK variants and the UK-8x variant (containing all 8 spike mutations) with the wt in nasal washes (b), tracheae (d) and lungs (f) of donor hamsters 4 days post-inoculation. c,e,g, Final:donor inoculum ratios of 8 individual UK mutations and UK-8x variant with the wt in nasal washes (c), tracheae (e) and lungs (g) of recipient hamsters 4-days post-contact. b-g, Red dots represent individual animals (n = 5), the horizontal lines in each catseye represent the mean, shaded regions represent standard error of the mean; y-axes use a log10 scale. Black numbers above each set of values (catseye) indicate the relative fitness estimates. P values are calculated for the group (strain) coefficient for each linear regression model. *p<0.05; **p<0.01; ***p<0.001.
Figure 2.
Figure 2.. The SARS-CoV-2 spike N501Y mutant has a consistent advantage in competitions with wt during the upper airway replication and transmission between hamsters.
a,b, Results of the competition between spike N501Y mutant and the wt assessed by sampling nasal washes of both donor (a) and recipient hamsters (b) from 1–4 days post-inoculation (donors) or post-contact (recipients). c,d, Results of the competition between the N501Y mutant and the wt in the tracheae of both donor (c) and recipient hamsters (d) at 2- or 4-days post-inoculation or post-contact. e,f, Results of the competition between the N501Y mutant and the wt in the lungs of both donor (e) and recipient hamsters (f) sampled 2- or 4-days post-inoculation or post-contact. g-i, The ratios in the competitors in the nasal washes (g), tracheae (h) and lungs (i) of recipient hamsters were compared to the ratio of N501Y:wt measured from the day 1 nasal wash of donor hamsters (representing the virus population transmitted) to assess changes corresponding to transmission versus replication in the recipient hamsters. a-i, The fitness advantage of the N501Y substitution against wt both during infection (donor data) and after transmission of the virus to recipients is shown by the significant changes in ratios between the harvested samples and inocula. Red dots represent individual animals (n=5), the horizontal lines in each catseye represent the mean, shaded regions represent standard error of the mean; y-axes use a log10 scale. Black numbers above each set of values (catseye) indicate the relative fitness estimates. P values are calculated for the group (strain) coefficient for each linear regression model. *p<0.05; **p<0.01; ***p<0.001.
Figure 3.
Figure 3.. The spike N501Y mutation enhances viral replication in primary human airway cells and has advantages in the competition against wt virus in vitro.
a, The experimental scheme of primary human airway cell infections. The wt, N501Y and UK-8x mutants were inoculated onto human airway epithelial (HAE) cells at a MOI of 5. After a 2 h incubation, the culture was washed with DPBS and maintained for 5 days. The secreted viruses were collected in DPBS after 30 min incubation at 37°C every day. b-d, The replication kinetics of the N501Y and UK-8x mutants compared to the wt on HAE cells. The amounts of infectious virus (b) and genomic RNA (c) were quantified by plaque assay and RT-qPCR, respectively. The genomic RNA:PFU ratio (d) was calculated as an indication of virion infectivity. The detection limitation of the plaque assay was 10 PFU/ml. Dots represent individual biological replicates (n=6) pooled from two independent experiments. The values in the graph represent the mean ± standard error of the mean. A non-parametric Mann-Whitney test was used to determine significant differences. P values were adjusted using the Bonferroni correction to account for multiple comparisons. Differences were considered significant if *p<0.025; **p<0.005. e-g, The Competition assay between N501Y variant and wt virus on Vero E6 (e), calu-3 (f) and HAE (g) cells. The Vero E6, calu-3 and HAE cells were infected at a MOI of 0.01, 0.1 and 5, respectively. Red dots represent individual animals (n=5), the horizontal lines in each catseye represent the mean, shaded regions represent standard error of the mean; y-axes use a log10 scale. Black numbers above each set of values (catseye) indicate the relative fitness estimates. P values are calculated for the group (strain) coefficient for each linear regression model. ***p<0.001.
Figure 4.
Figure 4.. The spike N501Y substitution spread quickly and increases spike protein binding affinity for the human ACE2 receptor.
a, The frequencies of the spike protein amino acid substitutions found among UK B.1.1.7 isolates and other variants. The amino acid substitutions in the UK B.1.1.7 variant refers to the USA_WA1/2020 SARS-CoV-2 sequence (GenBank accession No. MT020880). b, The frequency of the N501Y substitution over time in all genomic SARS-CoV-2 sequences available from the GISAID database worldwide. The blue bars represent the total numbers of SARS-CoV-2 genomes sequenced worldwide. The red line indicates the percentage of N501Y variant in total SARS-CoV-2 genomes. c, The predicted binding site of the N501 and Y501 residues to the human ACE2 receptor. d, The binding affinities of the wt and N501Y mutant to the human ACE2 receptor. Binding affinity-related parameters, including association (Kon), dissociation (Koff), and affinity (KD) are shown. The affinity of ACE2 to the N501Y mutant RBD is below the detection limit and is presented as <10−12.

References

    1. Zhou P. et al. A pneumonia outbreak associated with a new coronavirus of probable bat origin. Nature 579, 270–273, doi:10.1038/s41586-020-2012-7 (2020). - DOI - PMC - PubMed
    1. Smith E. C., Blanc H., Surdel M. C., Vignuzzi M. & Denison M. R. Coronaviruses lacking exoribonuclease activity are susceptible to lethal mutagenesis: evidence for proofreading and potential therapeutics. PLoS Pathog 9, e1003565, doi:10.1371/journal.ppat.1003565 (2013). - DOI - PMC - PubMed
    1. Gribble J. et al. The coronavirus proofreading exoribonuclease mediates extensive viral recombination. PLoS Pathog 17, e1009226, doi:10.1371/journal.ppat.1009226 (2021). - DOI - PMC - PubMed
    1. Huang Y., Yang C., Xu X. F., Xu W. & Liu S. W. Structural and functional properties of SARS-CoV-2 spike protein: potential antivirus drug development for COVID-19. Acta pharmacologica Sinica 41, 1141–1149, doi:10.1038/s41401-020-0485-4 (2020). - DOI - PMC - PubMed
    1. Starr T. N. et al. Deep Mutational Scanning of SARS-CoV-2 Receptor Binding Domain Reveals Constraints on Folding and ACE2 Binding. Cell 182, 1295–1310 e1220, doi:10.1016/j.cell.2020.08.012 (2020). - DOI - PMC - PubMed

Publication types