[Preprint]. 2021 Dec 10:2021.03.20.436257.
doi: 10.1101/2021.03.20.436257.

Interferon Resistance of Emerging SARS-CoV-2 Variants

Affiliations

Interferon Resistance of Emerging SARS-CoV-2 Variants

Kejun Guo et al. bioRxiv. .

Update in

  • Interferon resistance of emerging SARS-CoV-2 variants.
    Guo K, Barrett BS, Morrison JH, Mickens KL, Vladar EK, Hasenkrug KJ, Poeschla EM, Santiago ML. Guo K, et al. Proc Natl Acad Sci U S A. 2022 Aug 9;119(32):e2203760119. doi: 10.1073/pnas.2203760119. Epub 2022 Jul 22. Proc Natl Acad Sci U S A. 2022. PMID: 35867811 Free PMC article.

Abstract

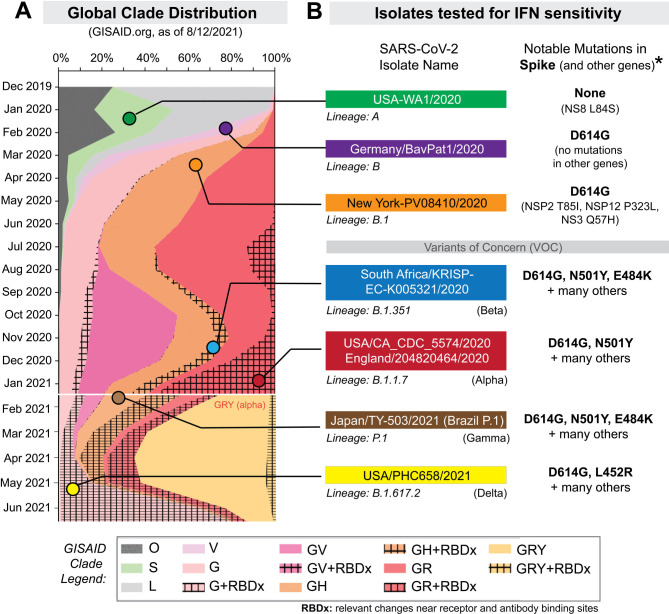
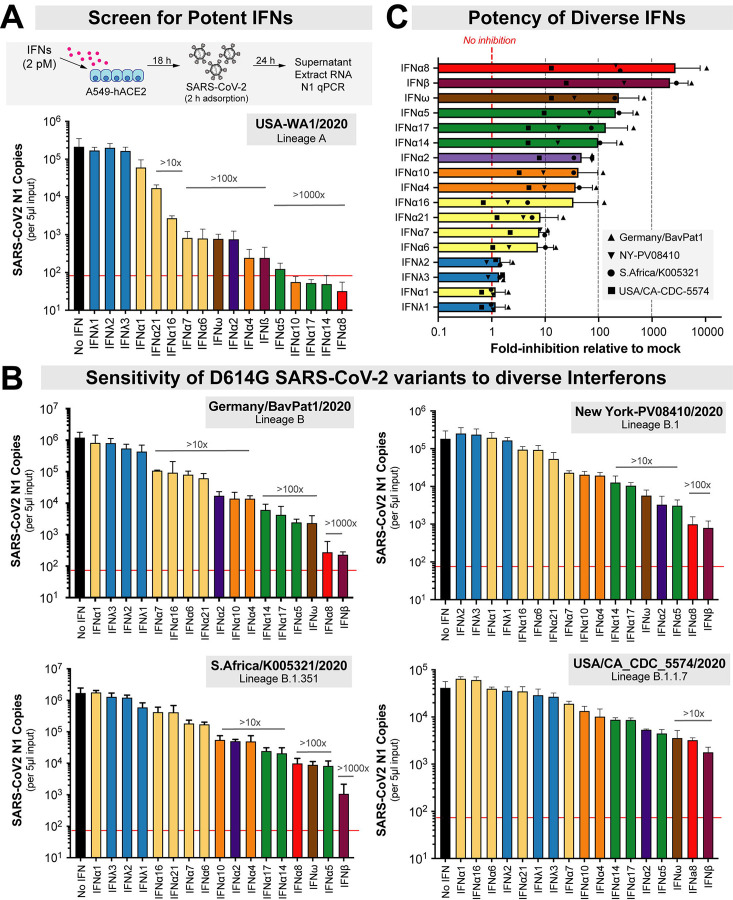
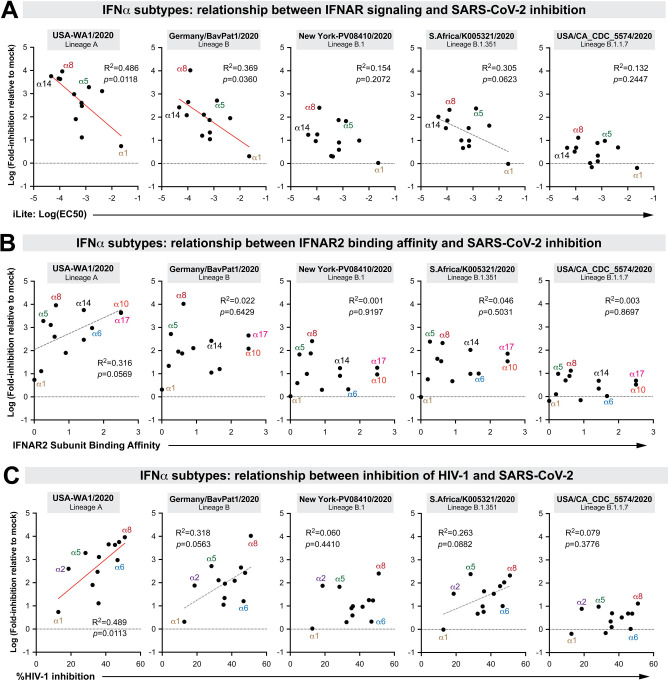
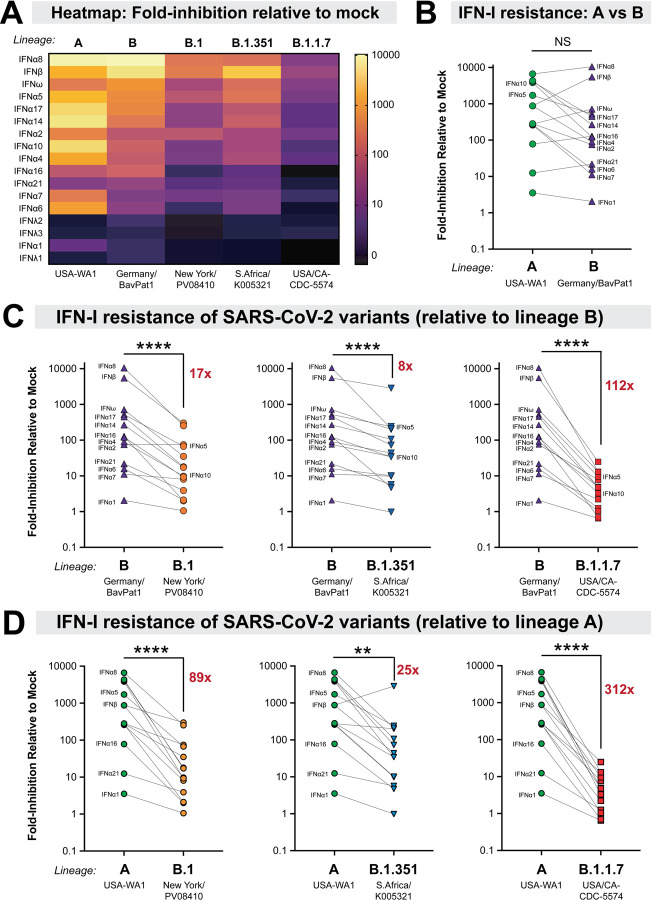
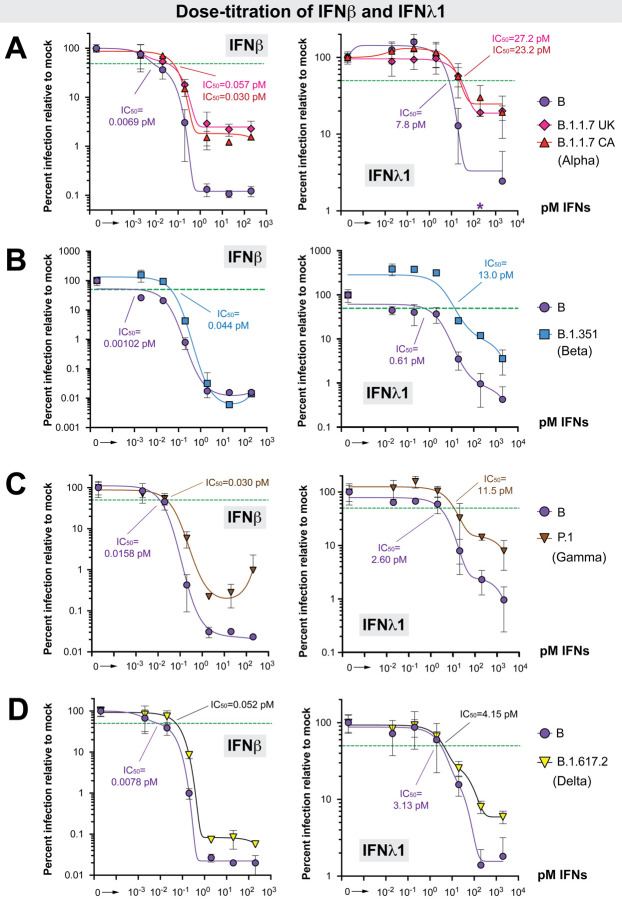
The emergence of SARS-CoV-2 variants with enhanced transmissibility, pathogenesis and resistance to vaccines presents urgent challenges for curbing the COVID-19 pandemic. While Spike mutations that enhance virus infectivity or neutralizing antibody evasion may drive the emergence of these novel variants, studies documenting a critical role for interferon responses in the early control of SARS-CoV-2 infection, combined with the presence of viral genes that limit these responses, suggest that interferons may also influence SARS-CoV-2 evolution. Here, we compared the potency of 17 different human interferons against multiple viral lineages sampled during the course of the global outbreak, including ancestral and four major variants of concern. Our data reveal increased interferon resistance in emerging SARS-CoV-2 variants, suggesting that evasion of innate immunity may be a significant, ongoing driving force for SARS-CoV-2 evolution. These findings have implications for the increased lethality of emerging variants and highlight the interferon subtypes that may be most successful in the treatment of early infections.


Figures

Figure 1.
Figure 1.. Selection of SARS-CoV-2 strains for IFN sensitivity studies.
(A) Global distribution of SARS-CoV-2 clades. GISAID.org plotted the proportion of deposited sequences in designated clades against collection dates. The six isolates chosen are noted by colored dots. (B) SARS-CoV-2 strains selected for this study included representatives of lineages A, B, B.1, B.1.351 and B.1.1.7 (S1 Table). Lineage P.1 (which branched off from lineage B.1.1.28) and B.1.617.2 were added after the initial manuscript submission; and was evaluated for IFNβ and IFNλ1 sensitivity. Lineage B isolates encode the D614G mutation associated with increased transmissibility. Note that the B.1.1.7 strain was later updated to belong to the GISAID clade, ‘GRY’. *Amino acid mutations were relative to the reference hCOV-19/Wuhan/WIV04/2019 sequence.
Figure 2.
Figure 2.. Sensitivity of SARS-CoV-2 strains to IFN-I and IFN-III interferons.
(A) Antiviral assay using recombinant IFNs (2 pM) in A549-ACE2 cells. The red line corresponds to the qPCR detection limit (90 copies/reaction, or 1.8 × 10⁴ copies/ml). (B) Viral copy numbers in D614G+ isolates, showing a similar rank-order of IFNs from least to most potent. (C) The average fold-inhibition relative to mock for lineage B, B.1, B.1.351 and B.1.1.7 isolates are shown. The most potent IFNs are shown top to bottom. For all panels, bars and error bars correspond to means and standard deviations.
Figure 3.
Figure 3.. Correlation between SARS-CoV-2 inhibition and biological properties of IFNα subtypes.
Log-transformed IFN-inhibition values relative to mock for the 5 different SARS-CoV-2 strains were compared to previously published values on (A) 50% effective concentrations in the iLite assay, a reporter cell line encoding the IFN sensitive response element of ISG15 linked to firefly luciferase [23]; (B) IFNAR2 subunit binding affinity, as measured by surface plasmon resonance by the Schreiber group [24]; and (C) HIV-1 inhibition values, based on % inhibition of HIV-1 p24+ gut lymphocytes relative to mock as measured by flow cytometry [3]. Each dot corresponds to an IFNα subtype. Linear regression was performed using GraphPad Prism 8. Significant correlations (p<0.05) were highlighted with a red best-fit line; those that were trending (p<0.1) had a gray, dotted best-fit line.
Figure 4.
Figure 4.. Increased IFN-I resistance of emerging SARS-CoV-2 variants.
(A) Heatmap of fold-inhibition of representative strains from the lineages noted. Colors were graded on a log-scale from highest inhibition (yellow) to no inhibition (black). Comparison of IFN-I sensitivities between (B) lineage A and B isolates; (C) lineage B versus B.1, B.1.351 and B.1.1.7 and (D) lineage A versus B.1, B.1.351 and B.1.1.7. The mean fold-inhibition values relative to mock were compared in a pairwise fashion for the 14 IFN-Is. In (C) and (D), the average fold-inhibition values were noted. Differences were evaluated using a nonparametric, two-tailed Wilcoxon matched-pairs signed rank test. NS, not significant; ****, p<0.0001.
Figure 5.
Figure 5.. Dose-titration of ancestral lineage B versus four variants of concern against IFNβ and IFNλ1.
Data from four separate experiments (panels A-D) are shown. (A) Dose-titration of IFNβ and IFNλ1 against lineage B (Germany/BavPat1/2020) versus B.1.1.7 (alpha) isolates. In addition to USA/CA_CDC_5574/2020, we also evaluated a second B.1.1.7 isolate from the United Kingdom (UK), England/204820464/2020. *The value at 200 pM IFNλ1 for the lineage B isolate was 0.54, precluding efforts for finding a best-fit curve for IC50 determination; this datapoint was therefore not included in the curve fitting. (B) IC50 comparison between a lineage B (Germany/BavPat1/2020) and a B.1.351 (beta) isolate (South Africa/KRISP-EC-K005321/2020). (C) IC50 comparison between a lineage B isolate (Germany/BavPat1/2020) and a P.1 (gamma) isolate (Japan/TY7–503/2021). (D) IC50 comparison between a lineage B isolate (Germany/BavPat1/2020) and a B.1.617.2 (delta) isolate (USA/PHC658/2021). For all panels, A549-ACE2 cells were pre-treated with serial 10-fold dilutions of IFNs for 18 h in triplicate and then infected with SARS-CoV-2. Supernatants were collected after 24 h, SARS-CoV-2 N1 copy numbers were determined by qPCR in triplicate, and then the mean copy numbers were normalized against mock as 100%. Error bars correspond to standard deviations. Non-linear best-fit regression curves of mean normalized infection levels were used to interpolate 50% inhibitory concentrations (green dotted lines).

Similar articles

References

    1. Pestka S, Krause CD, Walter MR. Interferons, interferon-like cytokines, and their receptors. Immunol Rev. 2004;202:8–32. - PubMed
    1. Gibbert K, Schlaak JF, Yang D, Dittmer U. IFN-alpha subtypes: distinct biological activities in anti-viral therapy. British journal of pharmacology. 2013;168(5):1048–58. - PMC - PubMed
    1. Harper MS, Guo K, Gibbert K, Lee EJ, Dillon SM, Barrett BS, et al. Interferon-alpha Subtypes in an Ex Vivo Model of Acute HIV-1 Infection: Expression, Potency and Effector Mechanisms. PLoS pathogens. 2015;11(11):e1005254. - PMC - PubMed
    1. Schlaepfer E, Fahrny A, Gruenbach M, Kuster SP, Simon V, Schreiber G, et al. Dose-Dependent Differences in HIV Inhibition by Different Interferon Alpha Subtypes While Having Overall Similar Biologic Effects. mSphere. 2019;4(1). - PMC - PubMed
    1. Lavender KJ, Gibbert K, Peterson KE, Van Dis E, Francois S, Woods T, et al. Interferon Alpha Subtype-Specific Suppression of HIV-1 Infection In Vivo. Journal of virology. 2016;90(13):6001–13. - PMC - PubMed

Publication types

LinkOut - more resources