[Preprint]. 2021 Mar 14:2021.03.10.21253235.
doi: 10.1101/2021.03.10.21253235.

Wastewater Surveillance of SARS-CoV-2 across 40 U.S. states

Affiliations

Wastewater Surveillance of SARS-CoV-2 across 40 U.S. states

Fuqing Wu et al. medRxiv. .

Update in

  • Wastewater surveillance of SARS-CoV-2 across 40 U.S. states from February to June 2020.
    Wu F, Xiao A, Zhang J, Moniz K, Endo N, Armas F, Bushman M, Chai PR, Duvallet C, Erickson TB, Foppe K, Ghaeli N, Gu X, Hanage WP, Huang KH, Lee WL, McElroy KA, Rhode SF, Matus M, Wuertz S, Thompson J, Alm EJ. Wu F, et al. Water Res. 2021 Sep 1;202:117400. doi: 10.1016/j.watres.2021.117400. Epub 2021 Jul 2. Water Res. 2021. PMID: 34274898 Free PMC article.

Abstract

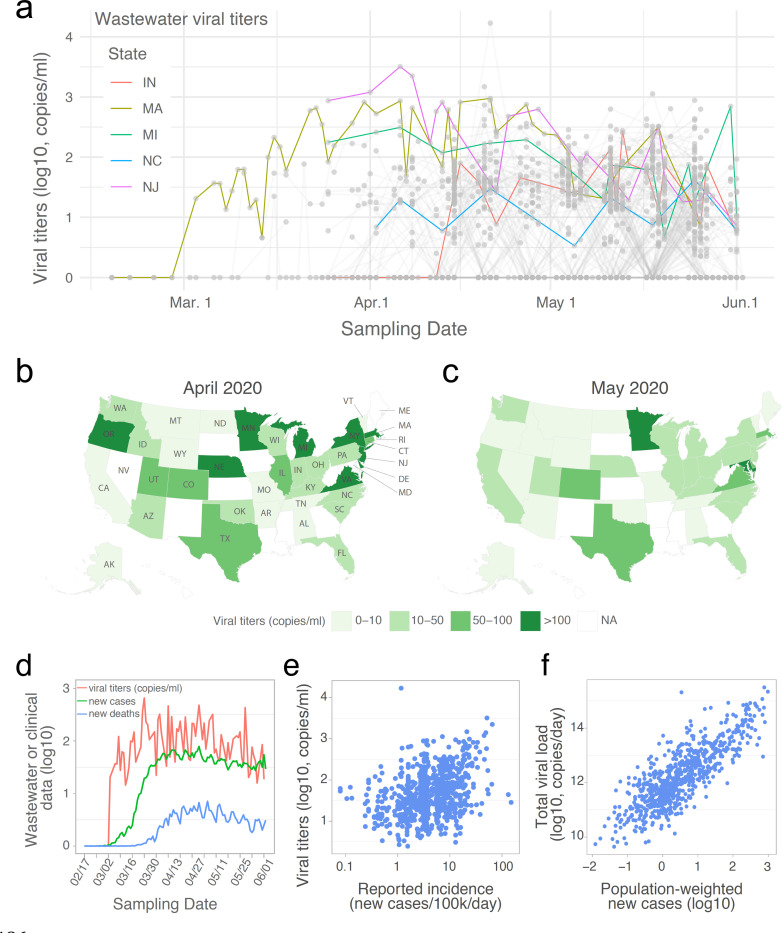
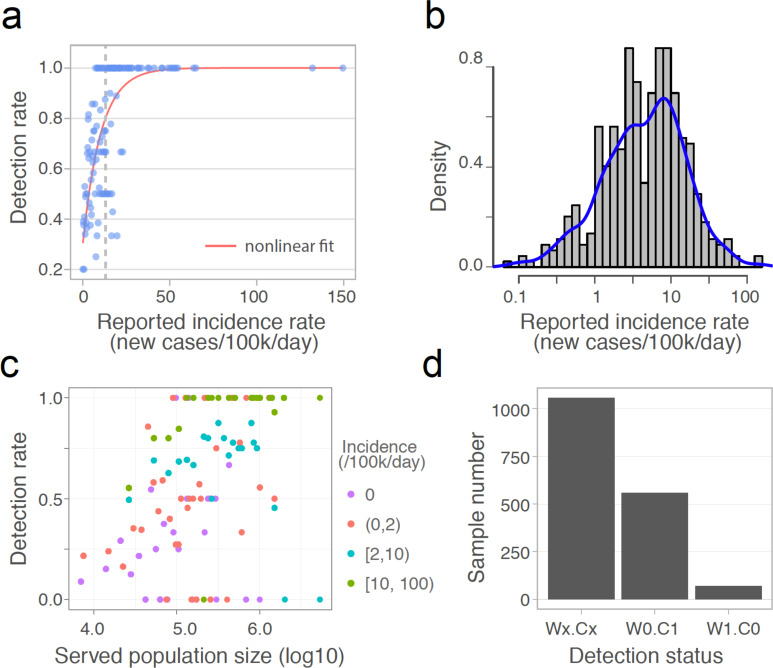
Wastewater-based disease surveillance is a promising approach for monitoring community outbreaks. Here we describe a nationwide campaign to monitor SARS-CoV-2 in the wastewater of 159 counties in 40 U.S. states, covering 13% of the U.S. population from February 18 to June 2, 2020. Out of 1,751 total samples analyzed, 846 samples were positive for SARS-CoV-2 RNA, with overall viral concentrations declining from April to May. Wastewater viral titers were consistent with, and appeared to precede, clinical COVID-19 surveillance indicators, including daily new cases. Wastewater surveillance had a high detection rate (>80%) of SARS-CoV-2 when the daily incidence exceeded 13 per 100,000 people. Detection rates were positively associated with wastewater treatment plant catchment size. To our knowledge, this work represents the largest-scale wastewater-based SARS-CoV-2 monitoring campaign to date, encompassing a wide diversity of wastewater treatment facilities and geographic locations. Our findings demonstrate that a national wastewater-based approach to disease surveillance may be feasible and effective.


Conflict of interest statement

Competing Interests MM and NG are cofounders of Biobot Analytics. EJA is advisor to Biobot Analytics. CD, KAM, KF, and NE are employees at Biobot Analytics, and all these authors hold shares in the company.

Figures

Fig. 1.
Fig. 1.. SARS-CoV-2 RNA gene copies in wastewater samples from 40 U.S. states.
(a) Temporal profile of SARS-CoV-2 viral RNA gene copies (viral titers) in the wastewater samples collected from February 18 to June 2, 2020. Each grey point represents a sample, and the grey line connects samples collected from the same catchment. Temporal dynamics of mean viral titers from five U.S. states are highlighted. Negative samples (SARS-CoV-2 not detected) were assigned to ‘0’. (b-c) Mean viral titers for each state in April (b) and May (c). All the samples in April or May were aggregated by state. NA: data is not available for the state. (d) Temporal dynamics for the mean viral titers, daily new COVID-19 cases, and new deaths. Viral concentrations (red line) from positive wastewater samples were aggregated by date, and new cases (green line) and COVID-19-related new deaths (blue line) from the wastewater sample originated counties were also aggregated and averaged by date. (e) Association between viral titers in wastewater samples and the reported daily incidence rate in each sampled counties. (f) Association between the total viral load and estimated new cases in each of the catchment areas. Total viral load of SARS-CoV-2 in wastewater (copies/day) was calculated by multiplying SARS-CoV-2 concentration (copies/ml) by the daily average influent flow (ml/day) reported by the WWTP. Population weighted new cases was calculated as county new cases * catchment population / county population.
Fig. 2.
Fig. 2.. Detection rate and accuracy of wastewater-based SARS-CoV-2 surveillance.
(a) Detection rate for varying daily incidence of COVID-19 cases. Each dot represents the percentage of positive wastewater samples for a constant incidence interval, and the red line is the nonlinear fit. The vertical dashed line indicates the incidence (x = 13) above which the fitted detection rate exceeds 0.8. (b) The distribution of daily incidence for the counties where SARS-CoV-2 was detected in the wastewater samples. Blue line is the Kernel density estimation of the daily incidence’s distribution. The median of the incidence is 3.7 cases per 100,000 people). (c) Relationship between the detection rate of positive wastewater samples from a given treatment plant and the population size served by that plant. Detection rate is binned by population size, and colored by the incidence intervals. (d) Detection status for all the samples (n = 1,687). Wx.Cx (x = 1 or 0): consistent results between wastewater data and clinical reports. W1.C1: SARS-CoV-2 detected in Wastewater (W1) and new Clinical cases reported (C1); W0.C0: no Wastewater detection (W0) and no new Clinical cases reported (C0); W0.C1: no Wastewater detection (W0) but new Clinical cases reported (C1); W1.C0: Wastewater detection (W1) but no new Clinical cases reported (C0).

References

    1. Holshue M. L. et al. First Case of 2019 Novel Coronavirus in the United States. New England Journal of Medicine 382, 929–936 (2020). - PMC - PubMed
    1. Johns Hopkins University Center for Systems Science and Engineering. COVID-19 Map - Johns Hopkins Coronavirus Resource Center. https://coronavirus.jhu.edu/map.html (2020).
    1. Lauer S. A. et al. The Incubation Period of Coronavirus Disease 2019 (COVID-19) From Publicly Reported Confirmed Cases: Estimation and Application. Ann Intern Med (2020) doi: 10.7326/M20-0504. - DOI - PMC - PubMed
    1. CDC. Coronavirus Disease 2019 (COVID-19)-COVID-19 Pandemic Planning Scenarios. Centers for Disease Control and Prevention https://www.cdc.gov/coronavirus/2019-ncov/hcp/planning-scenarios.html (2020).
    1. Kretzschmar M. E. et al. Impact of delays on effectiveness of contact tracing strategies for COVID-19: a modelling study. The Lancet Public Health 5, e452–e459 (2020). - PMC - PubMed

Publication types

LinkOut - more resources