

GARP transcription factors repress Arabidopsis nitrogen starvation response via ROS-dependent and -independent pathways
- PMID: 33758916
- PMCID: PMC8096604
- DOI: 10.1093/jxb/erab114
GARP transcription factors repress Arabidopsis nitrogen starvation response via ROS-dependent and -independent pathways
Abstract
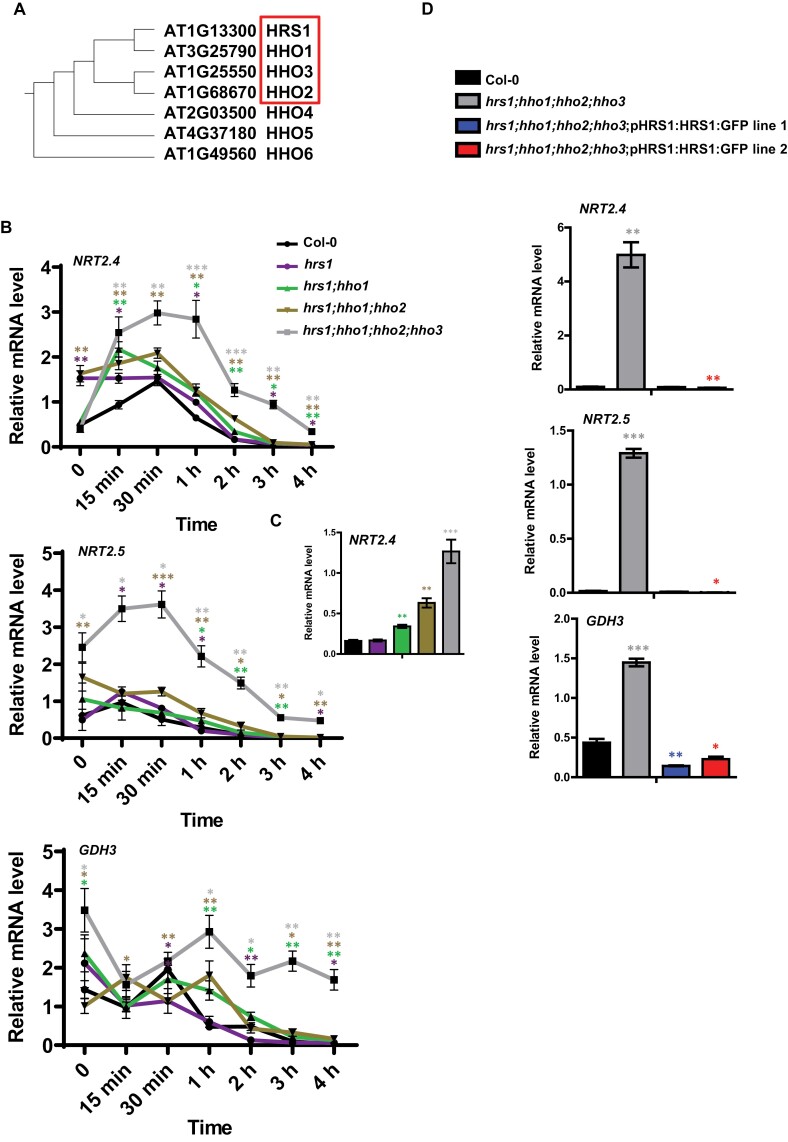
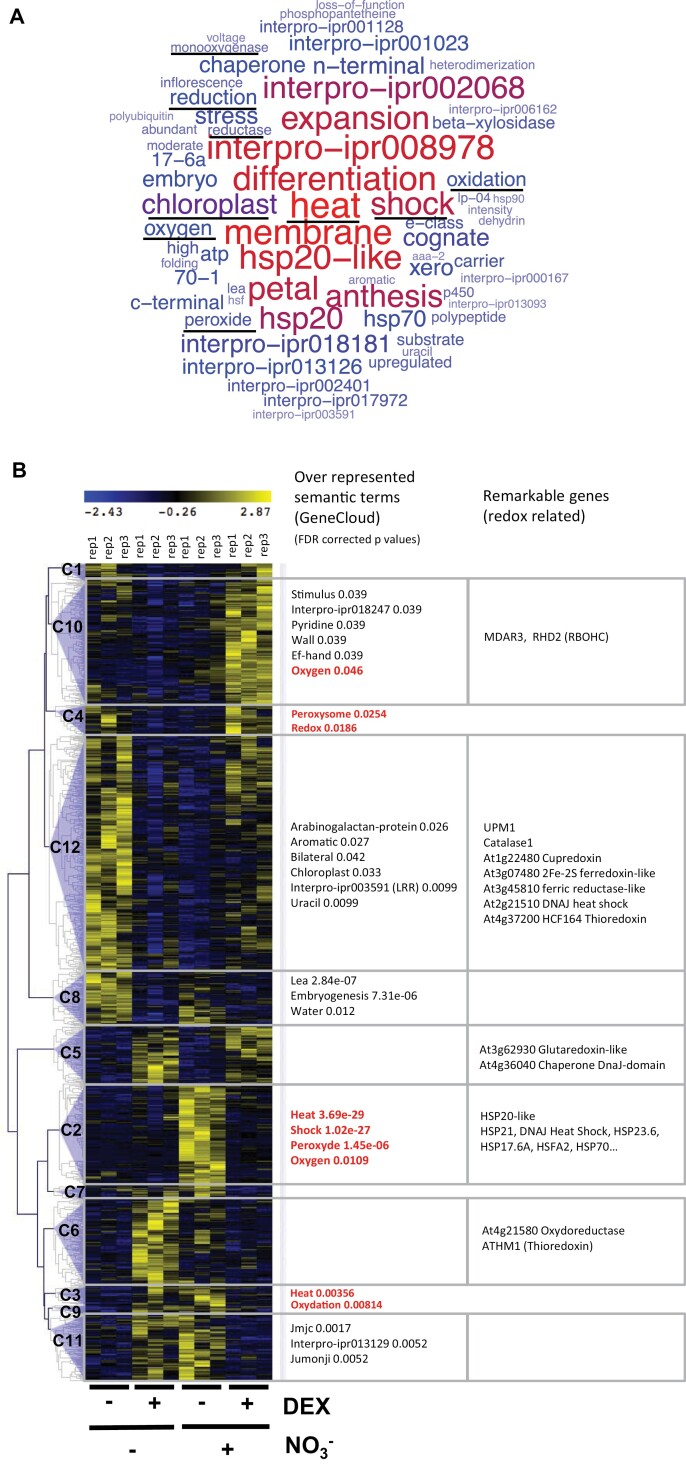
Plants need to cope with strong variations of nitrogen availability in the soil. Although many molecular players are being discovered concerning how plants perceive NO3- provision, it is less clear how plants recognize a lack of nitrogen. Following nitrogen removal, plants activate their nitrogen starvation response (NSR), which is characterized by the activation of very high-affinity nitrate transport systems (NRT2.4 and NRT2.5) and other sentinel genes involved in N remobilization such as GDH3. Using a combination of functional genomics via transcription factor perturbation and molecular physiology studies, we show that the transcription factors belonging to the HHO subfamily are important regulators of NSR through two potential mechanisms. First, HHOs directly repress the high-affinity nitrate transporters, NRT2.4 and NRT2.5. hho mutants display increased high-affinity nitrate transport activity, opening up promising perspectives for biotechnological applications. Second, we show that reactive oxygen species (ROS) are important to control NSR in wild-type plants and that HRS1 and HHO1 overexpressors and mutants are affected in their ROS content, defining a potential feed-forward branch of the signaling pathway. Taken together, our results define the relationships of two types of molecular players controlling the NSR, namely ROS and the HHO transcription factors. This work (i) up opens perspectives on a poorly understood nutrient-related signaling pathway and (ii) defines targets for molecular breeding of plants with enhanced NO3- uptake.
Keywords: Cell sorting; GARP transcription factors; ROS; TARGET; nitrogen starvation response; plant growth; root nitrate uptake; root protoplasts.
© The Author(s) 2021. Published by Oxford University Press on behalf of the Society for Experimental Biology. All rights reserved. For permissions, please email: journals.permissions@oup.com.
Figures


Comment in
-
Adjusting plant nutrient acquisition to fluctuating availability: transcriptional co-regulation of the nitrate and phosphate deprivation responses in roots.J Exp Bot. 2021 May 4;72(10):3500-3503. doi: 10.1093/jxb/erab131. J Exp Bot. 2021. PMID: 33948653 Free PMC article.
Similar articles
-
Dual regulation of root hydraulic conductivity and plasma membrane aquaporins by plant nitrate accumulation and high-affinity nitrate transporter NRT2.1.Plant Cell Physiol. 2016 Apr;57(4):733-42. doi: 10.1093/pcp/pcw022. Epub 2016 Jan 28. Plant Cell Physiol. 2016. PMID: 26823528
-
Dof1.7 and NIGT1 transcription factors mediate multilayered transcriptional regulation for different expression patterns of NITRATE TRANSPORTER2 genes under nitrogen deficiency stress.New Phytol. 2024 Jun;242(5):2132-2147. doi: 10.1111/nph.19695. Epub 2024 Mar 24. New Phytol. 2024. PMID: 38523242
-
The Arabidopsis nitrate transporter NRT2.5 plays a role in nitrate acquisition and remobilization in nitrogen-starved plants.Plant J. 2014 Oct;80(2):230-41. doi: 10.1111/tpj.12626. Epub 2014 Aug 25. Plant J. 2014. PMID: 25065551
-
Nitrate transport and signalling in Arabidopsis.J Exp Bot. 2014 Mar;65(3):789-98. doi: 10.1093/jxb/eru001. J Exp Bot. 2014. PMID: 24532451 Review.
-
Nitrate transport in plants: which gene and which control?J Exp Bot. 2002 Apr;53(370):825-33. doi: 10.1093/jexbot/53.370.825. J Exp Bot. 2002. PMID: 11912225 Review.
Cited by
-
Integration of reactive oxygen species and nutrient signalling to shape root system architecture.Plant Cell Environ. 2023 Feb;46(2):379-390. doi: 10.1111/pce.14504. Epub 2022 Dec 13. Plant Cell Environ. 2023. PMID: 36479711 Free PMC article. Review.
-
Rice transcription factors OsNIGT2/3 regulate nitrogen acquisition by repressing OsNRTs and OsAMTs under high-nitrogen conditions.Front Plant Sci. 2025 Jul 2;16:1591808. doi: 10.3389/fpls.2025.1591808. eCollection 2025. Front Plant Sci. 2025. PMID: 40672557 Free PMC article.
-
Transcriptional survey of abiotic stress response in maize (Zea mays) in the level of gene co-expression network and differential gene correlation analysis.AoB Plants. 2023 Dec 22;16(1):plad087. doi: 10.1093/aobpla/plad087. eCollection 2024 Jan. AoB Plants. 2023. PMID: 38162049 Free PMC article.
-
Cross-species analysis of abiotic stress in hydroponic leafy crops reveals conserved regulatory networks and key divergences.Front Plant Sci. 2025 Jul 7;16:1613016. doi: 10.3389/fpls.2025.1613016. eCollection 2025. Front Plant Sci. 2025. PMID: 40692674 Free PMC article.
-
LjNRT2.3 plays a hierarchical role in the control of high affinity transport system for root nitrate acquisition in Lotus japonicus.Front Plant Sci. 2022 Nov 10;13:1042513. doi: 10.3389/fpls.2022.1042513. eCollection 2022. Front Plant Sci. 2022. PMID: 36438153 Free PMC article.
References
-
- Alboresi A, Gestin C, Leydecker MT, Bedu M, Meyer C, Truong HN. 2005. Nitrate, a signal relieving seed dormancy in Arabidopsis. Plant, Cell & Environment 28, 500–512. - PubMed
-
- Alfatih A, Wu J, Zhang ZS, Xia JQ, Jan SU, Yu LH, Xiang CB. 2020. Rice NIN-LIKE PROTEIN 1 rapidly responds to nitrogen deficiency and improves yield and nitrogen use efficiency. Journal of Experimental Botany 71, 6032–6042. - PubMed
-
- Alvarez JM, Moyano TC, Zhang T, et al. . 2019. Local changes in chromatin accessibility and transcriptional networks underlying the nitrate response in Arabidopsis roots. Molecular Plant 12, 1545–1560. - PubMed
-
- Alvarez JM, Riveras E, Vidal EA, et al. . 2014. Systems approach identifies TGA1 and TGA4 transcription factors as important regulatory components of the nitrate response of Arabidopsis thaliana roots. The Plant Journal 80, 1–13. - PubMed
Publication types
MeSH terms
Substances
Grants and funding
LinkOut - more resources
Full Text Sources
Other Literature Sources
Molecular Biology Databases
