. 2021 Jul;51(7):1799-1808.
doi: 10.1002/eji.202048841. Epub 2021 Apr 2.

Monocytes promote UV-induced epidermal carcinogenesis

Affiliations

Monocytes promote UV-induced epidermal carcinogenesis

Iva Lelios et al. Eur J Immunol. 2021 Jul.

Abstract

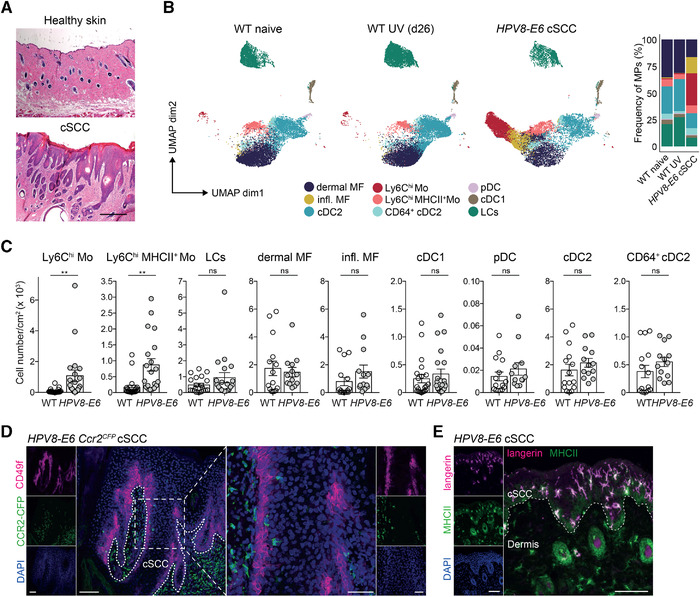
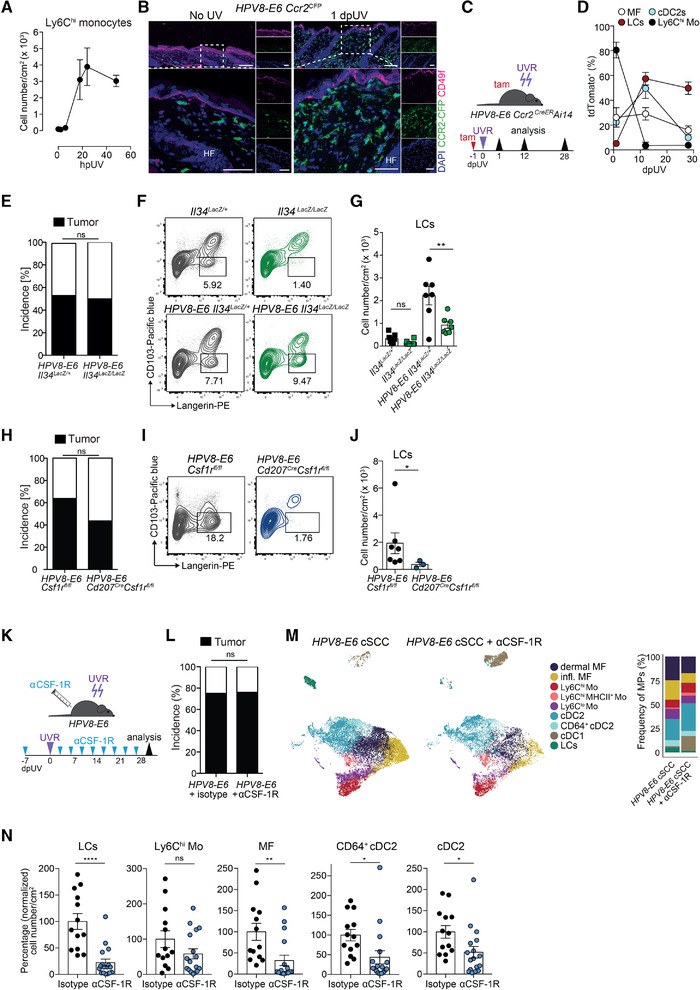
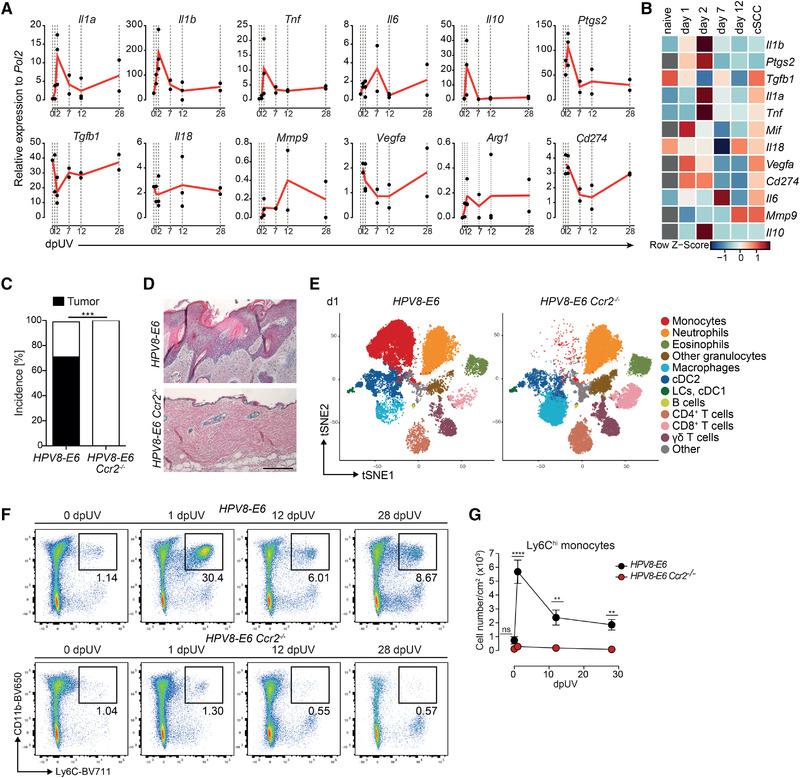
Mononuclear phagocytes consisting of monocytes, macrophages, and DCs play a complex role in tumor development by either promoting or restricting tumor growth. Cutaneous squamous cell carcinoma (cSCC) is the second most common nonmelanoma skin cancer arising from transformed epidermal keratinocytes. While present at high numbers, the role of tumor-infiltrating and resident myeloid cells in the formation of cSCC is largely unknown. Using transgenic mice and depleting antibodies to eliminate specific myeloid cell types in the skin, we investigated the involvement of mononuclear phagocytes in the development of UV-induced cSCC in K14-HPV8-E6 transgenic mice. Although resident Langerhans cells were enriched in the tumor, their contribution to tumor formation was negligible. Equally, dermal macrophages were dispensable for the development of cSCC. In contrast, mice lacking circulating monocytes were completely resistant to UV-induced cSCC, indicating that monocytes promote tumor development. Collectively, these results demonstrate a critical role for classical monocytes in the initiation of skin cancer.

Keywords: Cutaneous squamous cell carcinoma; Langerhans cells; Macrophages; Monocytes; UV radiation.


Conflict of interest statement

The authors declare no commercial or financial conflict of interest.

Figures

Figure 1
Figure 1
Ly6Chi monocytes accumulate in cSCC. (A) H&E staining of cSCC and healthy control skin of HPV8‐E6 mice. Scale bar: 200 μm. Representative images from three mice. (B and C) Flow cytometry analysis of mononuclear phagocytes in naïve skin of WT mice, UV‐treated skin of WT mice, or UV‐induced cSCC in HPV8‐E6 mice. (B) Uniform manifold approximation and projection (UMAP) plots and frequency of mononuclear phagocytes (MPs) (pregated on CD45+CD3Siglec‐FLy6G) (26 dpUV). Combined data from three to five mice in each group, shown is one representative of three independent experiments. Refers to Supporting Information Figure S1A. (C) Total number of Ly6Chi monocytes (Mo) (MHCII+ and MHCII), LCs, dermal macrophages (MF), inflammatory (infl.) MF, cDC1s, plasmacytoid DCs (pDCs), cDC2s, and CD64+ cDC2s per cm2 of UV‐exposed WT skin (n = 15–21) or cSCC from HPV8‐E6 mice (n = 13–20). Representative gating strategy shown in Supporting Fig. S1B. Data pooled from three to five individual experiments. **p < 0.01, Student's t‐test, two‐tailed. (D) Immunohistochemistry of CFP (CCR2, green) and CD49f (keratinocytes, magenta) in cSCC on day 28 after UVR of HPV8‐E6 Ccr2CFP mice. Representative images from three mice. Dotted line marks the border of the cSCC. Scale bar left is 100 μm, scale bar in zoomed image is 50 μm. (E) Immunohistochemistry of langerin (magenta) and MHCII (green) in UV‐induced cSCC from HPV8‐E6 on day 42 after UVR, counterstained with DAPI (blue). Scale bar: 100 μm. Dotted line represents cSCC border. Representative image from three mice.
Figure 2
Figure 2
LCs are dispensable for UV‐induced cSCC development. (A) Total cell number of Ly6Chi monocytes (CD45+Siglec‐FLy6GLy6ChiCD11b+) per cm2 of skin ± SEM at 0, 2, 6, 18, 24, and 48 h after UVR in HPV8‐E6 mice, analyzed by flow cytometry. n = 2–5 per time point. Pooled data from two independent experiments. (B) Immunofluorescence staining of naïve skin or on day 1 after UVR in Ccr2 CFP mice showing CFP (green), CD49f (magenta), and DAPI (blue). Big image shows enlargement of outlined region and small images show single stains. Representative images from three mice per time point. HF, hair follicle. Scale bar in upper images: 100 μm and in lower images: 50 μm. (C and D) HPV8‐E6 Ccr2CreERR26‐tdTomato (Ai14) mice were treated with a single dose of tamoxifen one day prior to UVR and UV‐exposed skin was analyzed by flow cytometry on days 1, 12, and 28 after UVR. Frequency of tdTomato+ cells among LCs, Ly6Chi monocytes (Mo), macrophages (MF), and cDC2s. Representative flow cytometry plots are shown in Supporting Information Fig. S2A. Pooled data from six experiments, two independent experiments per time point, n = 4 per time point. (E) Percent incidence of UV‐induced cSCC development in HPV8‐E6 Il34LacZ/+ (n = 13) and HPV8‐E6 Il34LacZ/LacZ (n = 14) mice. Pooled data from three individual experiments. ns, nonsignificant, Fisher's exact test. (F and G) Flow cytometry analysis of LCs (Langerin+CD103, gated on CD45+Siglec‐FLy6GLy6CCD64MHCII+CD11c+) in skin from Il34LacZ/+ (n = 6) and Il34LacZ/LacZ (n = 6) mice and cSCC from HPV8‐E6 Il34LacZ/+ (n = 7) and HPV8‐E6 Il34LacZ/LacZ (n = 7) mice on day 42 after UVR. Representative FACS plots (F) and total cell numbers (G) of LCs per cm2 of skin (only mice that developed cSCC in the HPV8‐E6 groups were included). Pooled data from two independent experiments, ns: non‐significant, **p < 0.01, one‐way ANOVA with Sidak's multiple comparisons test. (H) Percent incidence of UV‐induced cSCC in HPV8‐E6 Csf1rfl/fl (n = 11) and HPV8‐E6 Cd207CreCsf1rfl/fl (n = 13) mice. ns: nonsignificant, Fisher's exact test. Pooled data from three independent experiments. (I and J) FACS analysis of LCs (gated on CD45+Siglec‐FLy6GLy6CCD64MHCII+CD11c+ cells) in cSCC in HPV8‐E6 Csf1rfl/fl (n = 6) and HPV8‐E6 Cd207CreCsf1rfl/fl mice (n = 3). (I) Representative FACS plots and total cell number (J) of LCs per cm2 of skin. Data pooled from two independent experiments. *p < 0.05, Mann–Whitney test, two‐tailed. (K) Schematic representation of treatment of HPV8‐E6 mice with αCSF‐1R antibodies and induction of cSCC (K–N). (L) Percent incidence of UV‐induced cSCC in HPV8‐E6 control mice (n = 16, of which five were treated with isotype and 11 were untreated) or HPV8‐E6 mice treated with αCSF‐1R (n = 25). Pooled data from four experiments. ns: nonsignificant, Fisher's exact test. (M and N) Flow cytometry analysis of mononuclear phagocytes in cSCC of HPV8‐E6 mice treated with αCSF‐1R or HPV8‐E6 control mice (untreated or isotype control). (M) UMAP plot and frequency from three to four mice per group and (N) percentage change in cell numbers per cm2 skin (normalized to cell numbers in the control group) of LCs, Ly6Chi monocytes (Mo), macrophages (MF), cDC2 and CD64+ cDC2, as shown in the gating strategy in Supporting Information Fig. S1B. N = 13 for the control group (untreated and isotype‐treated combined) and n = 17 for the αCSF‐1R‐treated group. Pooled data from four experiments. ns: nonsignificant, **p < 0.05, Mann–Whitney test, two‐tailed.
Figure 3
Figure 3
Inflammatory monocytes are critical for the development of cSCC. (A) Relative mRNA amounts of Il1a, Il1b, Tnf, Il6, Il10, Ptgs2, Tgfb1, Il18, Mmp9, Vegfa, Arg1, and Cd274 measured by qPCR normalized to Pol2 expression in sorted monocytes from naïve or UV‐irradiated HPV8‐E6 mice on days 1, 2, 7, 12, and 28 (cSCC) after UVR. Day 1, 7, 12, 28: n = 2, each pooled from 2 mice; day 2: n = 3, each pooled from two mice; naive (day 0): n = 1, pooled from two mice; no data for naïve Ptgs2, Mif, Vegfa, Cd274, Mmp9, Il10. (B) Heatmap of data in (A), scaled for each gene; grey: data not available. (C) Percent incidence of cSCC development in HPV8‐E6 (n = 35) and HPV8‐E6 Ccr2−/− (n = 22) mice. ***p < 0.001, Fisher's exact test. (D) Representative H&E staining of cSCC (HPV8‐E6 mice) and skin (HPV8‐E6 Ccr2−/− mice) on day 42 after UVR. Scale bar: 200 μm. (E) t‐Distributed stochastic neighbor embedding (tSNE) plot of CD45+ cells on day 1 after UVR in HPV8‐E6 and HPV8‐E6 Ccr2−/− mice. N = 2 per genotype. (F and G) Flow cytometry analysis of monocytes (Ly6C+CD11b+) among CD45+Siglec‐FLy6G cells in skin of naïve HPV8‐E6 or HPV8‐E6 Ccr2−/‐ mice or on day 1, 12, or 28 after UVR. Representative plots (F) and total cell numbers (G) of monocytes per cm2 of skin. Pooled data from three independent experiments. n = 5–11 mice per time point per group. Refers to Supporting Information Fig. S3A–C.

References

    1. Bottomley, M. J., Thomson, J., Harwood, C. and Leigh, I., The role of the immune system in cutaneous squamous cell carcinoma. Int. J. Mol. Sci. 2019. 20. 10.3390/ijms20082009. - DOI - PMC - PubMed
    1. Hoeffel, G., Wang, Y., Greter, M., See, P., Teo, P., Malleret, B., Leboeuf, M. et al., Adult Langerhans cells derive predominantly from embryonic fetal liver monocytes with a minor contribution of yolk sac‐derived macrophages. J. Exp. Med. 2012. 209: 1167–1181. - PMC - PubMed
    1. Seré, K., Baek, J. H., Ober‐Blöbaum, J., Müller‐Newen, G., Tacke, F., Yokota, Y., Zenke, M. et al., Two distinct types of langerhans cells populate the skin during steady state and inflammation. Immunity 2012. 37: 905–916. - PubMed
    1. Merad, M., Manz, M. G., Karsunky, H., Wagers, A., Peters, W., Charo, I., Weissman, I. L. et al., Langerhans cells renew in the skin throughout life under steady‐state conditions. Nat. Immunol. 2002. 3: 1135–1141. - PMC - PubMed
    1. Ortner, D., Tripp, C. H., Komenda, K., Dubrac, S., Zelger, B., Hermann, M., Doppler, W. et al., Langerhans cells and NK cells cooperate in the inhibition of chemical skin carcinogenesis. Oncoimmunology 2017. 6. 10.1080/2162402X.2016.1260215. - DOI - PMC - PubMed

Publication types

MeSH terms

LinkOut - more resources