. 2021 Mar;129(3):37005.
doi: 10.1289/EHP8719. Epub 2021 Mar 24.

Contribution of Long-Term Exposure to Outdoor Black Carbon to the Carcinogenicity of Air Pollution: Evidence regarding Risk of Cancer in the Gazel Cohort

Affiliations

Contribution of Long-Term Exposure to Outdoor Black Carbon to the Carcinogenicity of Air Pollution: Evidence regarding Risk of Cancer in the Gazel Cohort

Emeline Lequy et al. Environ Health Perspect. 2021 Mar.

Abstract

Background: Black carbon (BC), a component of fine particulate matter [particles with an aerodynamic diameter 2.5 μm (PM2.5)], may contribute to carcinogenic effects of air pollution. Until recently however, there has been little evidence to evaluate this hypothesis.

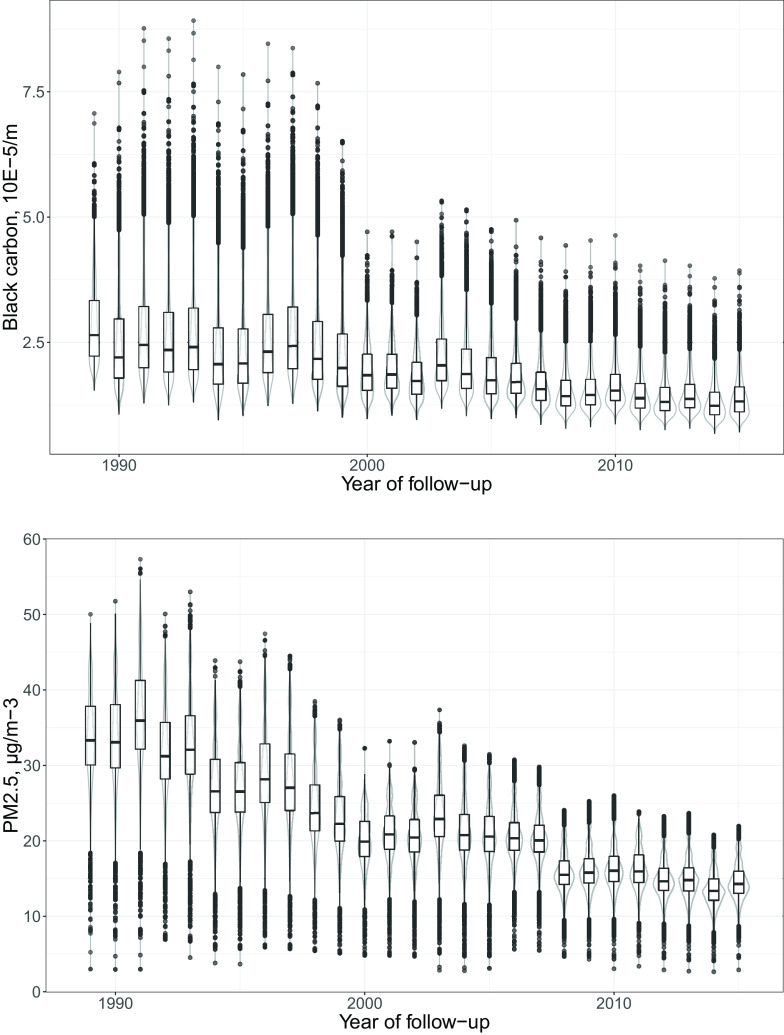
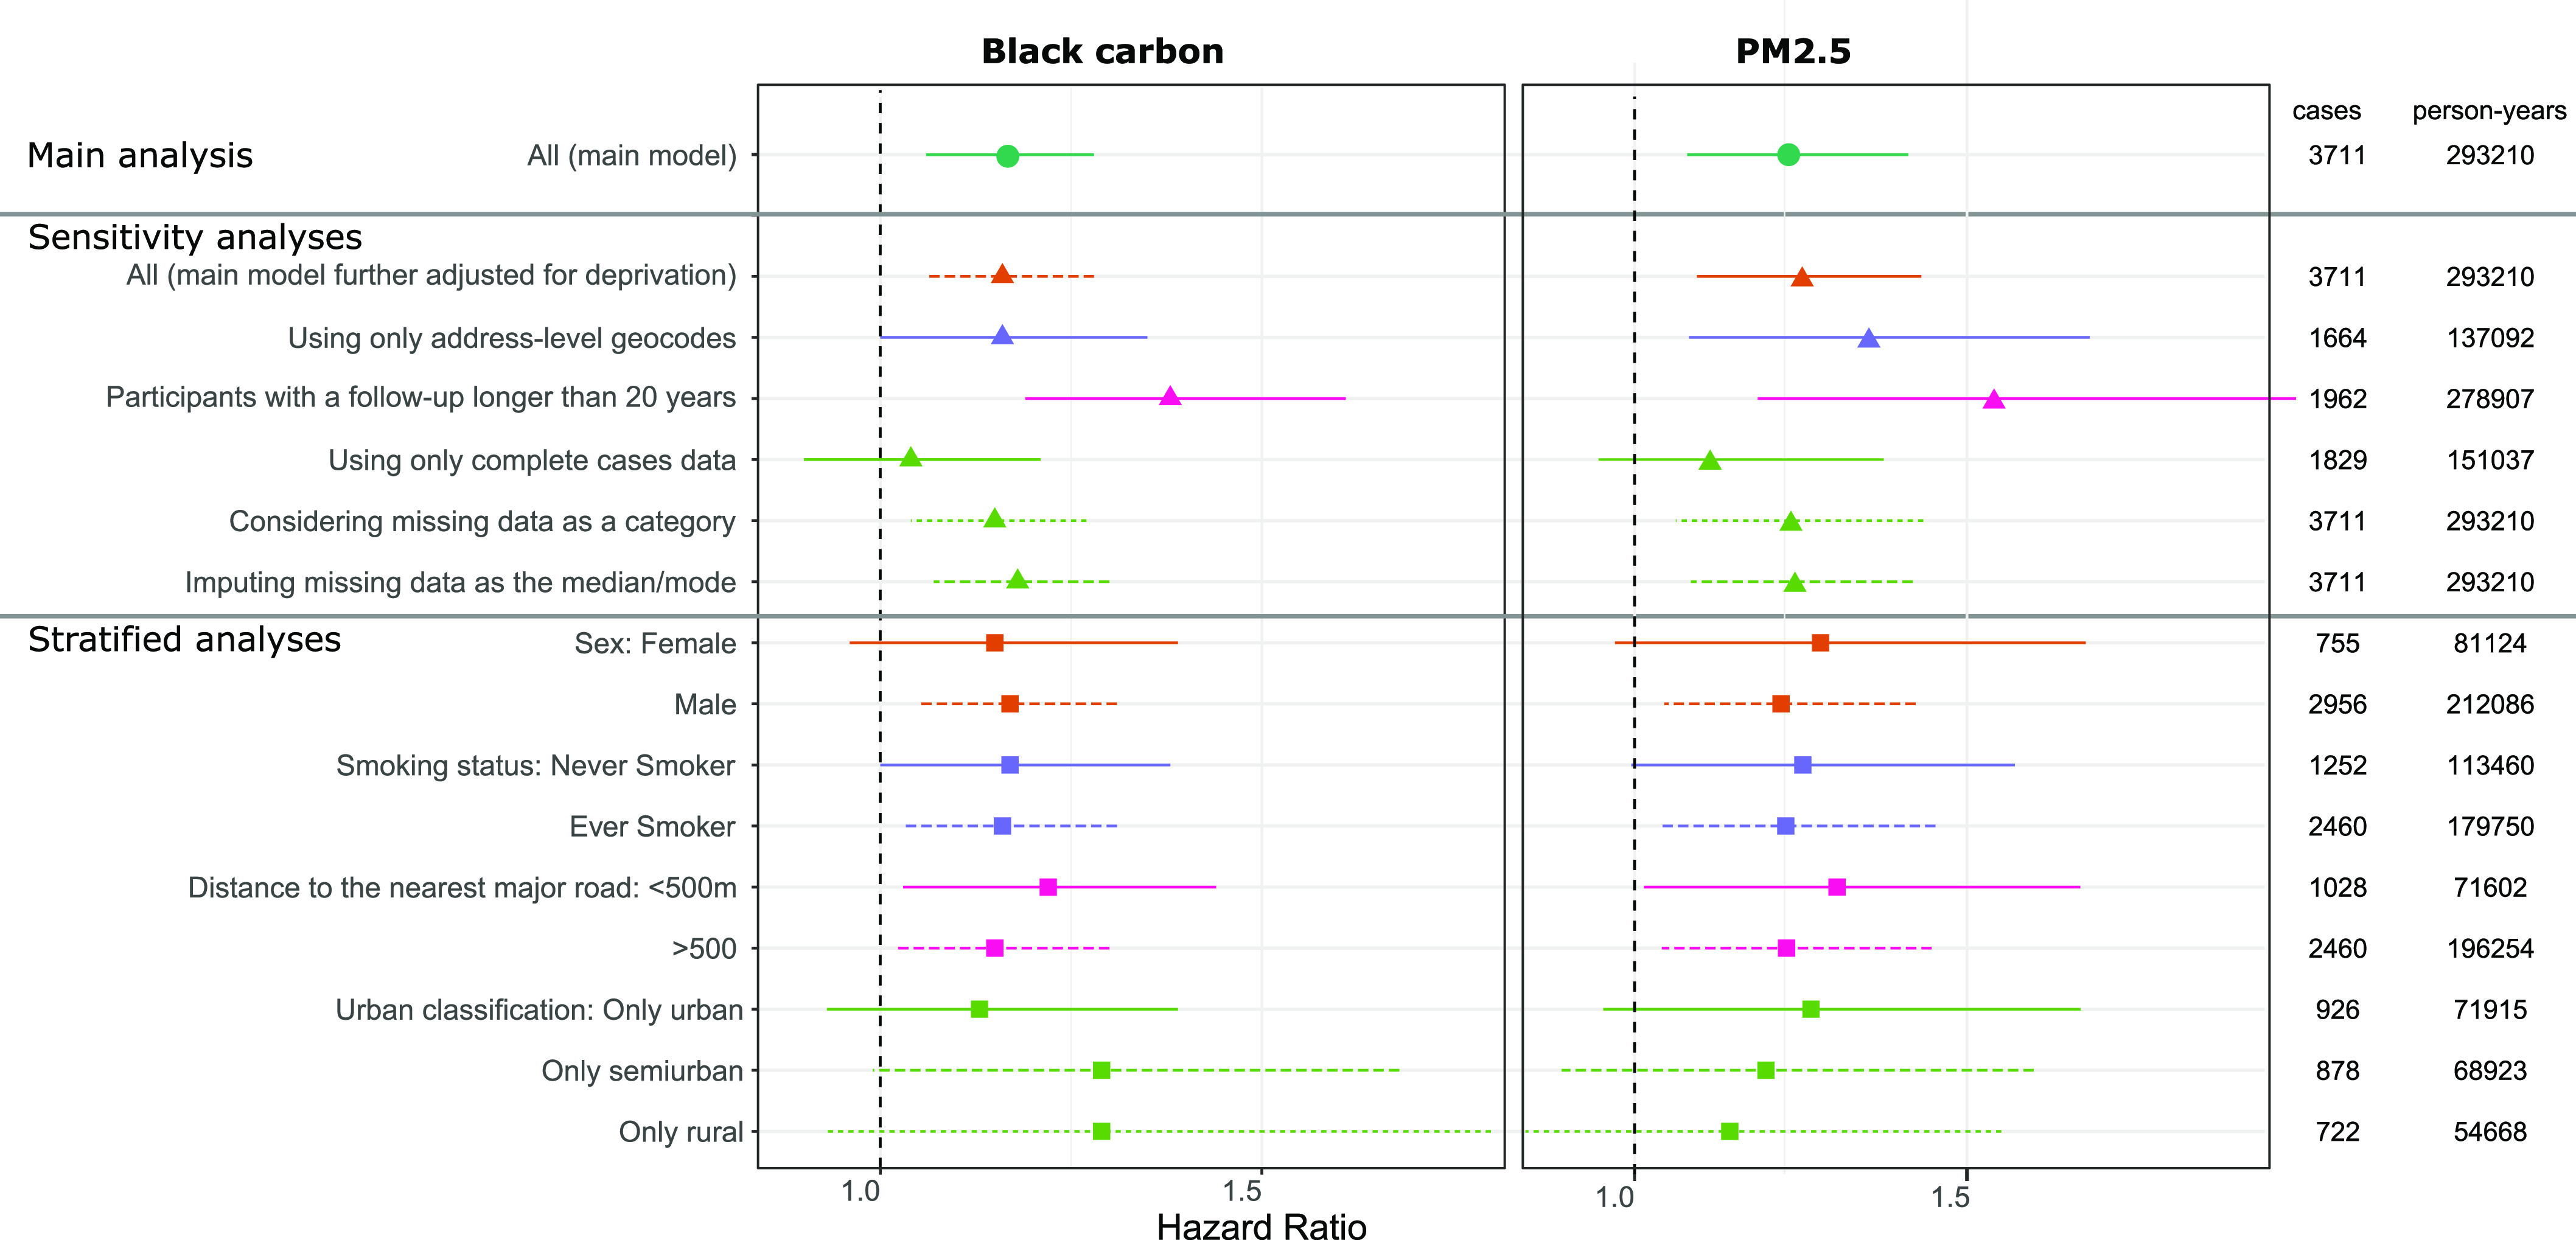
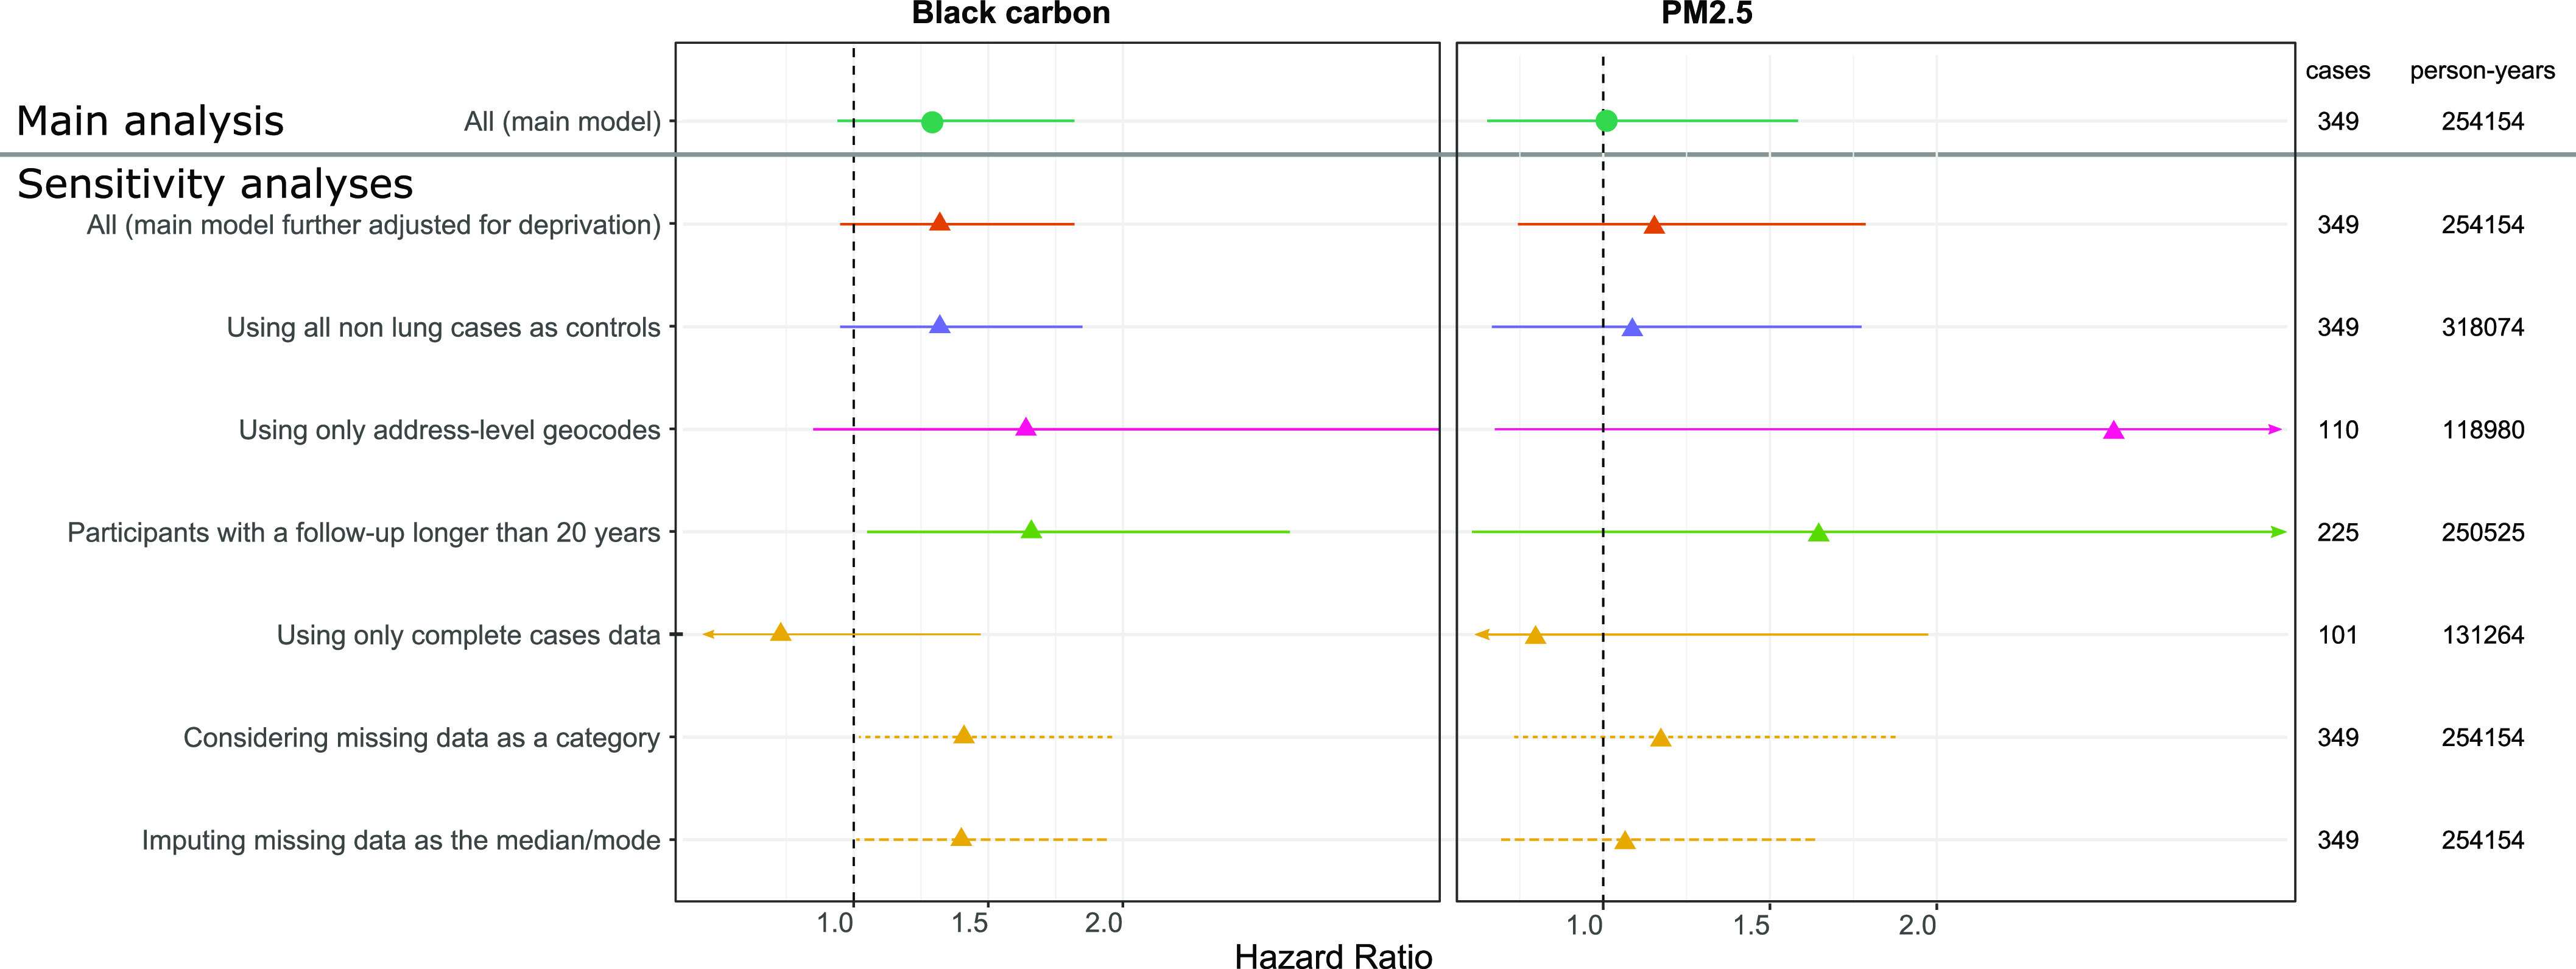
Objective: This study aimed to estimate the associations between long-term exposure to BC and risk of cancer. This study was conducted within the French Gazel cohort of 20,625 subjects.

Methods: We assessed exposure to BC by linking subjects' histories of residential addresses to a map of European black carbon levels in 2010 with back- and forward-extrapolation between 1989 and 2015. We used extended Cox models, with attained age as time-scale and time-varying cumulative exposure to BC, adjusted for relevant sociodemographic and lifestyle variables. To consider latency between exposure and cancer diagnosis, we implemented a 10-y lag, and as a sensitivity analysis, a lag of 2 y. To isolate the effect of BC from that of total PM2.5, we regressed BC on PM2.5 and used the residuals as the exposure variable.

Results: During the 26-y follow-up period, there were 3,711 incident cancer cases (all sites combined) and 349 incident lung cancers. Median baseline exposure in 1989 was 2.65 10-5/m [interquartile range (IQR): 2.23-3.33], which generally slightly decreased over time. Using 10 y as a lag-time in our models, the adjusted hazard ratio per each IQR increase of the natural log-transformed cumulative BC was 1.17 (95% confidence interval: 1.06, 1.29) for all-sites cancer combined and 1.31 (0.93, 1.83) for lung cancer. Associations with BC residuals were also positive for both outcomes. Using 2 y as a lag-time, the results were similar.

Discussion: Our findings for a cohort of French adults suggest that BC may partly explain the association between PM2.5 and lung cancer. Additional studies are needed to confirm our results and further disentangle the effects of BC, total PM2.5, and other constituents. https://doi.org/10.1289/EHP8719.


Figures

Figure 1 is a set of two box plot graphs plotting Black carbon, ten raised to the power of 5 per meter, ranging from 0 to 7.5 in increments of 2.5 and particulate matter begin subscript 2.5 end subscript micrograms per cubic meter, ranging from 0 to 60 in increments of 10 (y-axis) across Year of follow−up, including 1990, 2000, and 2010 (x-axis).
Figure 1.
Black carbon (top) and PM2.5 (bottom) concentrations between 1989 and 2015 at residential addresses of 19,348 participants of the French Gazel cohort. Black carbon (105/m) and PM2.5 (μg/m3) are depicted by yearly boxplots in black (minimum, 25th percentile, median, 75th percentile, outliers calculated as 75th percentile plus 1.5 times the interquartile range, and maximum) and violin plots in gray (two rotated kernel density plots depicting the probability of each exposure level and informing on the skewedness of the distribution).
Figure 2 is a set of two forest plots titled black carbon and particulate matter begin subscript 2.5 end subscript plotting from top to bottom, main analysis, including all (main model); sensitivity analyses, including all (main model further adjusted for deprivation), using only address-level geocodes, participants with a follow-up longer than 20 years, using only complete cases data, considering missing data as a category, and imputing missing data as the median or mode; and stratified analyses, including sex is to female, male, smoking status is to never smoker, ever smoker, distance to the nearest major road is to less than 500 meters, greater than 500, urban classification is to only urban, only semiurban, and only rural (y-axis) across hazard ratio, ranging from 1.0 to 1.5 in increments of 0.5 (x-axis), respectively, for cases and person years.
Figure 2.
Associations between cumulative black carbon (left) and PM2.5 (right) and all-site incident cancer in the main, sensitivity, and stratified analyses in the Gazel cohort, with the number of identified cancer cases among the number of participant-year over the follow-up. Hazard ratios and confidence intervals expressed for one IQR increase in ln-transformed cumulative exposure to black carbon or PM2.5 in separate single-pollutant Cox model with attained age as underlying time-scale and time-dependent variables, adjusted for sex, cumulative smoking pack-years, passive smoking, alcohol use, BMI, education, socioeconomic status, family status, fruit and vegetable consumption, occupational exposure to lung carcinogens, age at inclusion, and calendar time. Exposures were lagged 10 y. Participants were excluded from the analysis if they were diagnosed with cancer before 1999. See Table S4 for corresponding numeric data. Unless specified otherwise, these model-based estimates were computed using MICE to address missing data and were pooled following Rubin’s rules. Note: BMI, body mass index; IQR, interquartile range.
Figure 3 is a set of two forest plots titled black carbon and particulate matter begin subscript 2.5 end subscript plotting from top to bottom, main analysis, including all (main model) and sensitivity analyses, including all (main model further adjusted for deprivation), using all non-lung cases as controls, using only address-level geocodes, participants with a follow-up longer than 20 years, using only complete cases data, considering missing data as a category, and imputing missing data as the median or mode (y-axis) across hazard ratio, ranging from 1.0 to 2.0 in increments of 0.5 (x-axis), respectively, for cases and person years.
Figure 3.
Associations between cumulative black carbon (left) and PM2.5 (right) and lung incident cancer in the main and sensitivity analyses in the Gazel cohort, with the number of identified cancer cases among the number of participant-year over the follow-up. Hazard ratios and confidence intervals expressed for one IQR increase in ln-transformed cumulative exposure to black carbon or PM2.5 in separate single-pollutant Cox model with attained age as underlying time-scale and time-dependent variables, adjusted for sex, cumulative smoking pack-years, passive smoking, alcohol use, BMI, education, socioeconomic status, family status, fruit and vegetable consumption, occupational exposure to lung carcinogens, age at inclusion and calendar time. Exposures were lagged 10 y. Participants were excluded from the analysis if they were diagnosed with cancer before 1999. See Table S5 for corresponding numeric data. Unless specified otherwise, these model-based estimates were computed using MICE to address missing data and were pooled following Rubin’s rules. Note: BMI, body mass index; IQR, interquartile range.

References

    1. Aaron CP, Hoffman EA, Kawut SM, Austin JHM, Budoff M, Michos ED, et al. . 2019. Ambient air pollution and pulmonary vascular volume on computed tomography: the MESA air pollution and lung cohort studies. Eur Respir J 53(6):1802116, PMID: 31167881, 10.1183/13993003.02116-2018. - DOI - PMC - PubMed
    1. Anenberg SC, Schwartz J, Shindell D, Amann M, Faluvegi G, Klimont Z, et al. . 2012. Global air quality and health co-benefits of mitigating near-term climate change through methane and black carbon emission controls. Environ Health Perspect 120(6):831–839, PMID: 22418651, 10.1289/ehp.1104301. - DOI - PMC - PubMed
    1. ANSES. 2019. Particulate matter in ambient air health effects according to components, sources and particle size. https://www.anses.fr/en/system/files/AIR2014SA0156RaEN.pdf [accessed 31 January 2020].
    1. Bein KJ, Zhao Y, Wexler AS, Johnston MV. 2005. Speciation of size-resolved individual ultrafine particles in Pittsburgh, Pennsylvania. J Geophys Res Atmos 110, 10.1029/2004JD004708. - DOI
    1. Beelen R, Hoek G, Raaschou-Nielsen O, Stafoggia M, Andersen ZJ, Weinmayr G, et al. . 2015. Natural-cause mortality and long-term exposure to particle components: an analysis of 19 European cohorts within the multi-center ESCAPE project. Environ Health Perspect 123(6):525–533, PMID: 25712504, 10.1289/ehp.1408095. - DOI - PMC - PubMed

Publication types

MeSH terms

LinkOut - more resources