. 2021 Apr;114(4):182-211.
doi: 10.1177/0141076821999973. Epub 2021 Mar 24.

Ethnicity, household composition and COVID-19 mortality: a national linked data study

Affiliations

Ethnicity, household composition and COVID-19 mortality: a national linked data study

Vahé Nafilyan et al. J R Soc Med. 2021 Apr.

Abstract

Objective: To estimate the proportion of ethnic inequalities explained by living in a multi-generational household.

Design: Causal mediation analysis.

Setting: Retrospective data from the 2011 Census linked to Hospital Episode Statistics (2017-2019) and death registration data (up to 30 November 2020).

Participants: Adults aged 65 years or over living in private households in England from 2 March 2020 until 30 November 2020 (n=10,078,568).

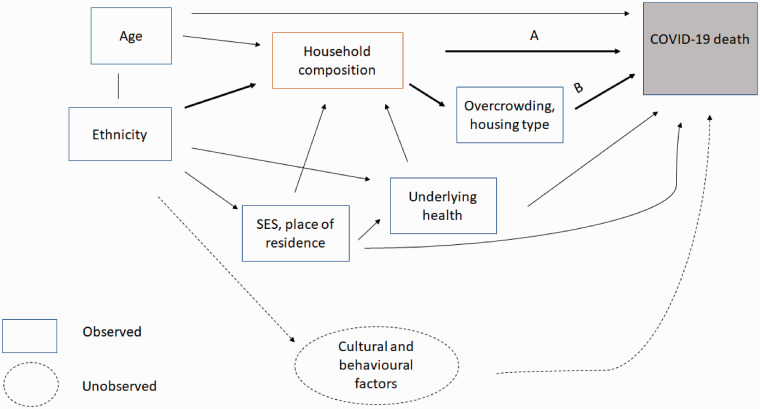
Main outcome measures: Hazard ratios were estimated for COVID-19 death for people living in a multi-generational household compared with people living with another older adult, adjusting for geographic factors, socioeconomic characteristics and pre-pandemic health.

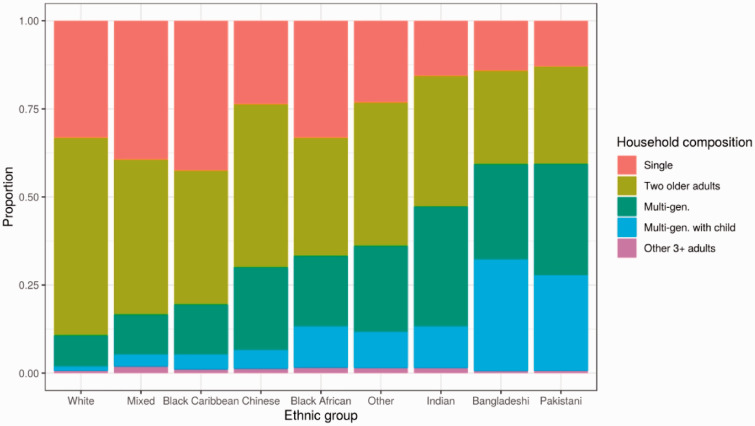
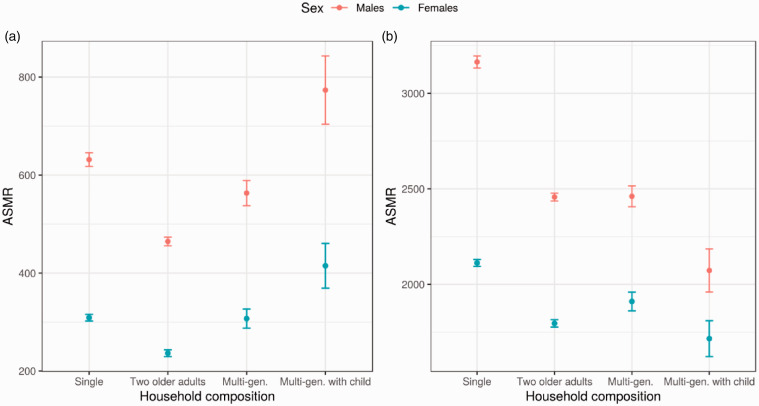
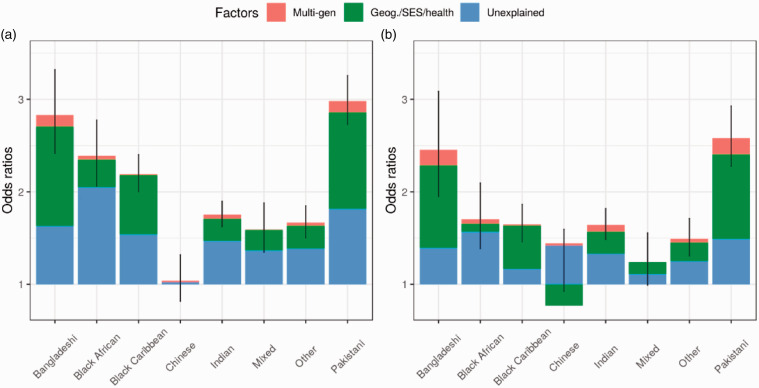
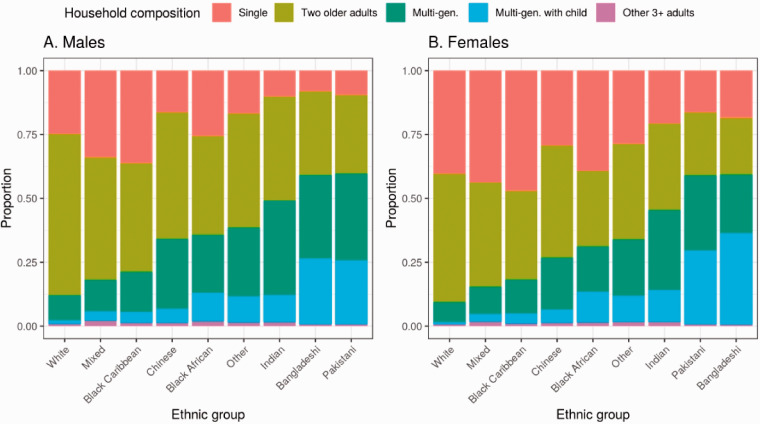
Results: Living in a multi-generational household was associated with an increased risk of COVID-19 death. After adjusting for confounding factors, the hazard ratios for living in a multi-generational household with dependent children were 1.17 (95% confidence interval [CI] 1.06-1.30) and 1.21 (95% CI 1.06-1.38) for elderly men and women. The hazard ratios for living in a multi-generational household without dependent children were 1.07 (95% CI 1.01-1.13) for elderly men and 1.17 (95% CI 1.07-1.25) for elderly women. Living in a multi-generational household explained about 11% of the elevated risk of COVID-19 death among elderly women from South Asian background, but very little for South Asian men or people in other ethnic minority groups.

Conclusion: Elderly adults living with younger people are at increased risk of COVID-19 mortality, and this is a contributing factor to the excess risk experienced by older South Asian women compared to White women. Relevant public health interventions should be directed at communities where such multi-generational households are highly prevalent.

Keywords: Clinical; ethnic studies; housing and health; infectious diseases; public health.


Figures

Figure 1.
Figure 1.
Directed Acyclic Graphs summarising the relationship between ethnicity, household composition and COVID-19 mortality. Note: When analysing whether household composition directly affects the risk of COVID-19 death, our effect of interest is A. In the mediation analysis, where we estimate the proportion of the ethnic disparity in COVID-19 that is explained by living in a multi-generational household, the effects of interest are A + B.
Figure 2.
Figure 2.
Household composition by ethnic group for people in England aged ≥ 65 years. Note: Linked 2011 Census and mortality registration data for people in England aged ≥ 65 years, excluding those living in a care home in 2019. The number of adults in the household was calculated as the number of people aged ≥ 25 years who lived in the household at the time of the Census, minus those who died between 27 March 2011 and 1 March 2020.
Figure 3.
Figure 3.
Age-standardised mortality rates per 100,000 adults aged 65 years or over, stratified by sex and household composition. Note: Deaths occurring between 2 March 2020 and 30 November 2020. 95% confidence intervals are reported. Mortality rates are standardised to the 2013 European Standard Population.
Figure 4.
Figure 4.
Decomposition of odds ratios for COVID-19 mortality among elderly adults (aged ≥ 65 years) across ethnic groups, stratified by sex. Note: The overall height of the bar corresponds to the odds ratio (OR), relative to the White population, based on a logistic regression model adjusted for age. Error bars are 95% confidence intervals. The proportion of the age-adjusted ORs explained by living in a multi-generational household were calculated through a mediation analysis. The unexplained part corresponds to the ORs from a model adjusted for age, geographical factors (region, population density, urban/rural classification), socioeconomic characteristics (IMD decile, household deprivation, educational attainment, social grade, household tenancy), and health (self-reported health and disability from the Census, pre-existing conditions based on hospital contacts, number of hospital admissions, total days spent in hospital).
Figure 5.
Figure 5.
Household composition by ethnic group for people in England aged ≥ 65 years, stratified by sex. Note: Linked 2011 Census and mortality registration data for people in England aged ≥ 65 years, excluding those living in a care home in 2019. The number of adults in the household was calculated as the number of people aged ≥ 16 years who lived in the household at the time of the Census, minus those who died between 27 March 2011 and 1 March 2020.
Figure 6.
Figure 6.
Smoothed Schoenfeld residuals for household composition from the fully adjusted model, stratified by sex. Note: Fully adjusted Cox regression models include geographical factors (region, population density, urban/rural classification), ethnicity, socioeconomic characteristics (IMD decile, household deprivation, educational attainment, social grade, household tenancy), health (self-reported health and disability from the Census, pre-existing conditions based on hospital contacts, number of hospital admissions, total days spent in hospital), a measure for overcrowding and property type. Dotted line shows the log-hazard ratio from the model. Residuals are smoothed with a generalised additive model. Confidence intervals are at the 95% level.

References

    1. ONS. Updating Ethnic Contrasts in Deaths Involving the Coronavirus (COVID-19), England and Wales: Deaths Occurring 2 March to 28 July 2020. See https://www.ons.gov.uk/peoplepopulationandcommunity/birthsdeathsandmarri... (last checked 18 February 2021).
    1. Public Health England. Disparities in the Risk and Outcomes of COVID-19. See https://assets.publishing.service.gov.uk/government/uploads/system/uploa... (last checked 18 February 2021).
    1. Aldridge RW, Lewer D, Katikireddi SV, Mathur R, Pathak N, Burns R; et al. Black, Asian and Minority Ethnic groups in England are at increased risk of death from COVID-19: indirect standardisation of NHS mortality data. Wellcome Open Res 2020; 5: 88–88. - PMC - PubMed
    1. Niedzwiedz CL, O'Donnell CA, Jani BD, Demou E, Ho FK, Celis-Morales C; et al. Ethnic and socioeconomic differences in SARS-CoV-2 infection: prospective cohort study using UK Biobank. BMC Med 2020; 18: 5–5. - PMC - PubMed
    1. Pan D, Sze S, Minhas JS, Bangash MN, Pareek N, Divall P; et al. The impact of ethnicity on clinical outcomes in COVID-19: a systematic review. EClinicalMedicine 2020; 23: 100404–100404. - PMC - PubMed

Publication types

MeSH terms