. 2021 Mar 24:10:e63532.
doi: 10.7554/eLife.63532.

Glia actively sculpt sensory neurons by controlled phagocytosis to tune animal behavior

Affiliations

Glia actively sculpt sensory neurons by controlled phagocytosis to tune animal behavior

Stephan Raiders et al. Elife. .

Abstract

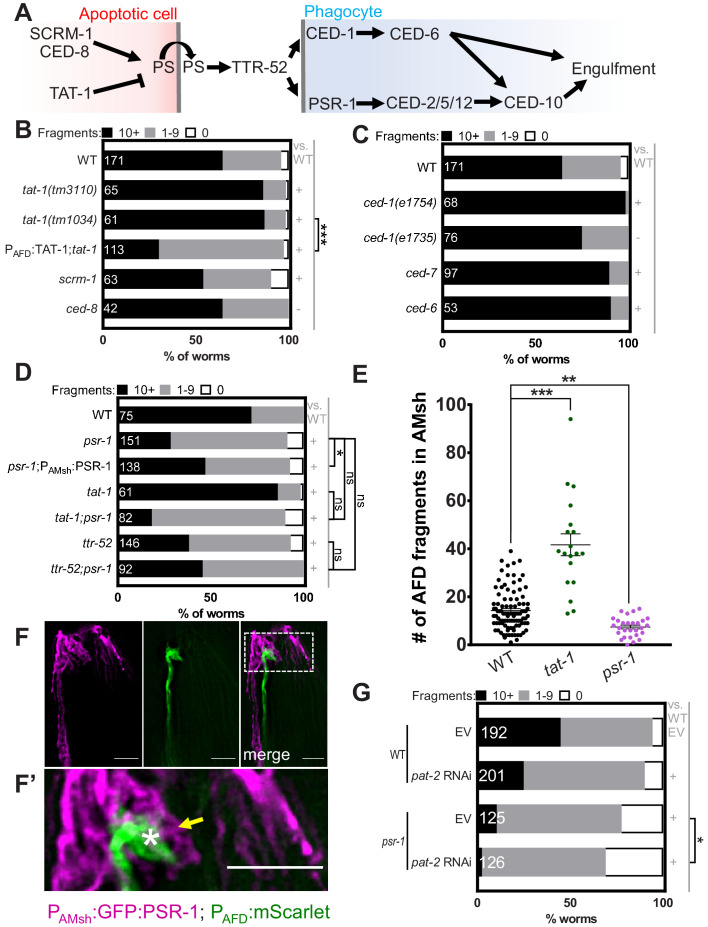
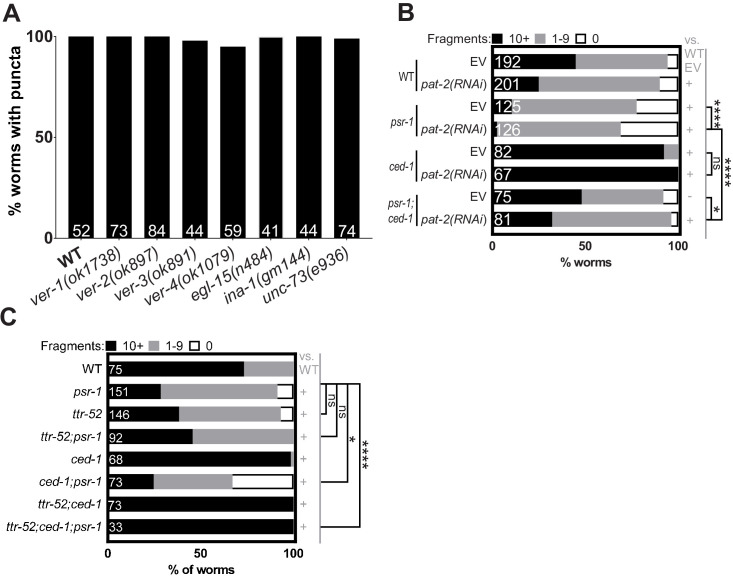
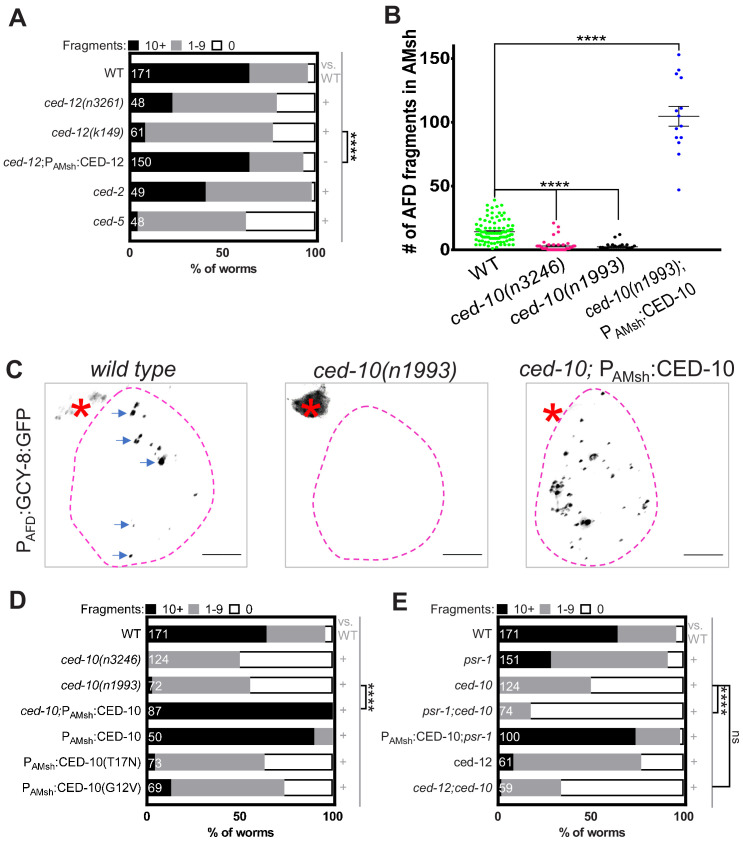
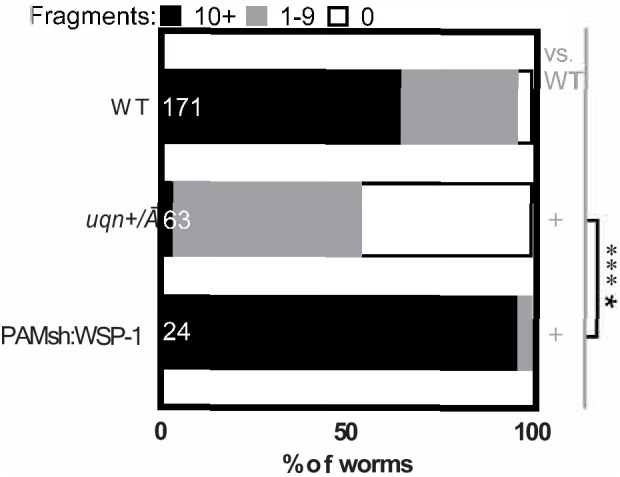
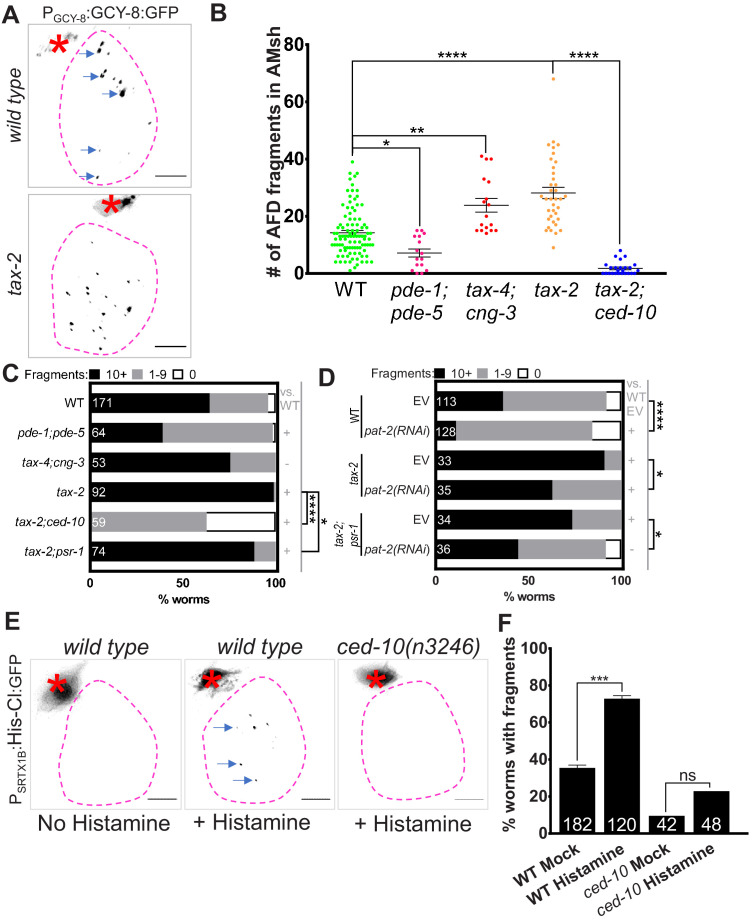
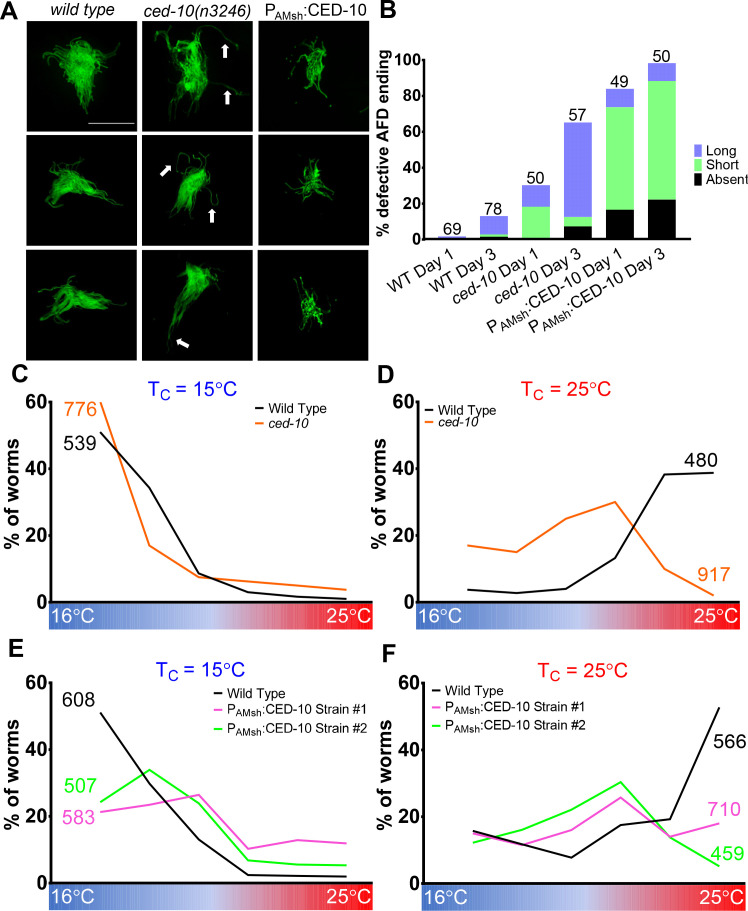
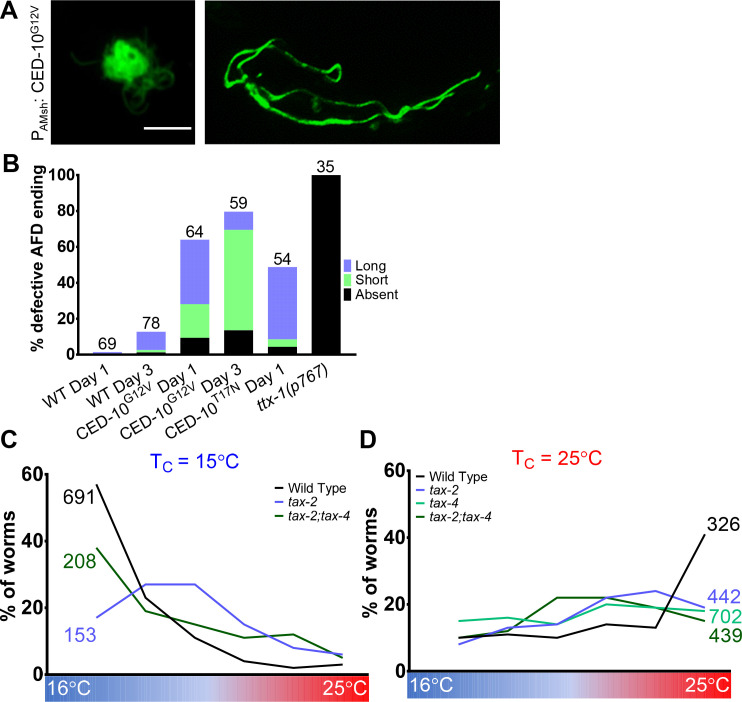
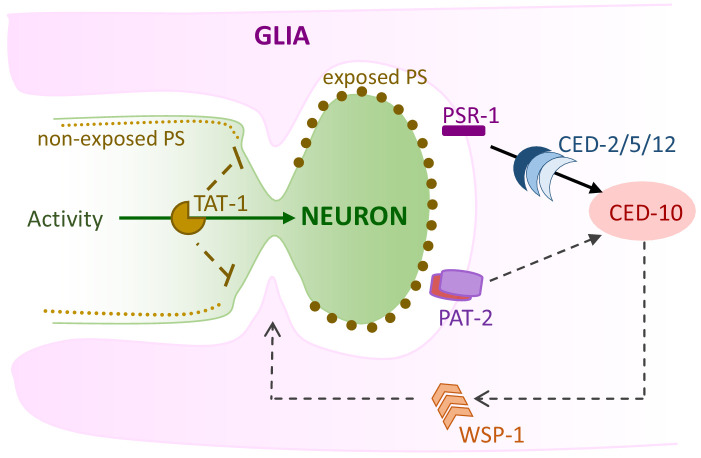
Glia in the central nervous system engulf neuron fragments to remodel synapses and recycle photoreceptor outer segments. Whether glia passively clear shed neuronal debris or actively prune neuron fragments is unknown. How pruning of single-neuron endings impacts animal behavior is also unclear. Here, we report our discovery of glia-directed neuron pruning in Caenorhabditis elegans. Adult C. elegans AMsh glia engulf sensory endings of the AFD thermosensory neuron by repurposing components of the conserved apoptotic corpse phagocytosis machinery. The phosphatidylserine (PS) flippase TAT-1/ATP8A functions with glial PS-receptor PSR-1/PSR and PAT-2/α-integrin to initiate engulfment. This activates glial CED-10/Rac1 GTPase through the ternary GEF complex of CED-2/CrkII, CED-5/DOCK180, CED-12/ELMO. Execution of phagocytosis uses the actin-remodeler WSP-1/nWASp. This process dynamically tracks AFD activity and is regulated by temperature, the AFD sensory input. Importantly, glial CED-10 levels regulate engulfment rates downstream of neuron activity, and engulfment-defective mutants exhibit altered AFD-ending shape and thermosensory behavior. Our findings reveal a molecular pathway underlying glia-dependent engulfment in a peripheral sense-organ and demonstrate that glia actively engulf neuron fragments, with profound consequences on neuron shape and animal sensory behavior.

Keywords: C. elegans; Glia; Rac1 small GTPase; cell biology; neuroscience; phagocytosis; pruning; sensory systems; thermotaxis.

Plain language summary

Neurons are tree-shaped cells that receive information through endings connected to neighbouring cells or the environment. Controlling the size, number and location of these endings is necessary to ensure that circuits of neurons get precisely the right amount of input from their surroundings. Glial cells form a large portion of the nervous system, and they are tasked with supporting, cleaning and protecting neurons. In humans, part of their duties is to ‘eat’ (or prune) unnecessary neuron endings. In fact, this role is so important that defects in glial pruning are associated with conditions such as Alzheimer’s disease. Yet it is still unknown how pruning takes place, and in particular whether it is the neuron or the glial cell that initiates the process. To investigate this question, Raiders et al. enlisted the common laboratory animal Caenorhabditis elegans, a tiny worm with a simple nervous system where each neuron has been meticulously mapped out. First, the experiments showed that glial cells in C. elegans actually prune the endings of sensory neurons. Focusing on a single glia-neuron pair then revealed that the glial cell could trim the endings of a living neuron by redeploying the same molecular machinery it uses to clear dead cell debris. Compared to this debris-clearing activity, however, the glial cell takes a more nuanced approach to pruning: specifically, it can adjust the amount of trimming based on the activity load of the neuron. When Raiders et al. disrupted the glial pruning for a single temperature-sensing neuron, the worm lost its normal temperature preferences; this demonstrated how the pruning activity of a single glial cell can be linked to behavior. Taken together the experiments showcase how C. elegans can be used to study glial pruning. Further work using this model could help to understand how disease emerges when glial cells cannot perform their role, and to spot the genetic factors that put certain individuals at increased risk for neurological and sensory disorders.


Conflict of interest statement

SR, EB, AB, SM, MK, SS, AS No competing interests declared

Figures

Figure 1.
Figure 1.. AMsh glia contain AFD–NRE-labeled puncta.
(A) Schematic of the C. elegans head region depicting AFD neuron and AMsh glial cell body and processes. Anterior is to the top. Black box: zoomed in (B, C); red box region zoomed in (E); blue box zoomed in (F). (B) The AMsh glia’s anterior ending ensheathes AFD–NRE dendrite, which comprises ~45 microvilli (green) and a single cilium (blue). AJ: adherens junction between AMsh glia and AFD neuron. (C, C’) PSRTX-1b:SRTX-1:GFP specifically labels AFD–NRE microvilli. Arrows indicate microvilli fragments disconnected from the main AFD–NRE structure, zoomed in (C'). Anterior is to the top. Scale bar: 5 μm. (D–F’) Fluorescence micrograph of AMsh glia (magenta) show AFD–NRE puncta throughout the cell (D) including the process (E) and soma (F). Image in (D) is a composite of three exposure settings of a single animal, stitched where indicated by dotted white line. Orthogonal slices of AMsh glial process (E’, E’’, scale bar: 2 μm) and cell body (F’) show AFD–NRE fragments completely within AMsh glia. Scale bar: 5 μm. (G, G’) Day 1 adult animal with left AFD neuron ablated by laser microsurgery during L1 larval stage. Left AMsh soma (blue outline) lacks AFD–NRE fragments, right AMsh soma (green outline) contains fragments. (G) Fluorescence micrograph, (G') differential intereference contrast (DIC) microscopy image. (H, I) Quantification of puncta in ipsilateral and contralateral AMsh glial cell soma with AFD neurons ablated by laser (H) or genetically (I). N: number of animals assayed; NRE: neuron-receptive ending.
Figure 2.
Figure 2.. AMsh glia puncta engulf AFD–NRE.
(A) Quantification of average puncta diameter within AMsh glial cell soma. (B) Quantification of average AFD–NRE microvilli diameter from electron micrographs. (C) Population scores of wild-type animals with AFD–NRE-labeled fragments within AMsh soma at different developmental stages. X-axis: percent animals with fragments. Y-axis: developmental stage. Puncta numbers are quantified into three bins (≥10 fragments, black bar), (1–9 fragments, gray bar), (0 fragments, white bar). N: number of animals. Statistics: Fisher’s exact test. *p<0.05, **p<0.005, ***p<0.0005, ****p<0.00005, ns = p>0.05. See Materials and methods for details. (D) Quantification of AFD–NRE-labeled fragments within AMsh soma at different developmental stages. X-axis: developmental stage. Y-axis: number of puncta per AMsh glial cell soma. Median puncta counts and N (number of animals): L1 larva (0.5 ± 0.2 puncta, n = 15 animals), L3 larva (1.6 ± 0.5 puncta, n = 10 animals), L4 larva (8.6 ± 1.2 puncta, n = 19 animals), day 1 adult (14.1 ± 1 puncta, n = 78 animals), and day 3 adult (29.2 ± 3 puncta, n = 17 animals). Statistics: one-way ANOVA w/ multiple comparison. *p<0.05, **p<0.005, ***p<0.0005, ****p<0.00005, ns = p>0.05. (E) Average number of fragments in animals cultivated at 15°C, 20°C, or 25°C. Refer (D) for data presentation details. Median puncta counts and N (number of animals): 15°C (6 ± 2 puncta, n = 8 animals), 20°C (14.1 ± 1 puncta, n = 78 animals), and 2 5°C (27.6 ± 3 puncta, n = 16 animals). NRE: neuron-receptive ending.
Figure 2—figure supplement 1.
Figure 2—figure supplement 1.. AMsh glia engulf AFD–NRE fragments.
(A) Electron micrograph through AFD–NRE microvilli of an animal. An individual microvillum taken for diameter measurement in Figure 2B is noted by yellow lines. Scale bar: 500 nm. (B) Time-stamped stills from Video 1 of AFD–NRE dissociation of fragments. Each colored arrowhead tracks an individual fragment moving away from AFD–NRE. Scale bar: 5 μm. NRE: neuron-receptive ending.
Figure 3.
Figure 3.. AMsh glia engulf AFD–NRE microvilli but not cilia.
(A) AFD–NRE-labeled fragments observed in different transgenic animal strains. Each strain has a different tagged fusion protein, driven by a different AFD-specific promoter, localizing to either microvilli (green) or cilium (blue). X-axis: genotype; Y-axis: percent animals with AFD–NRE-labeled puncta inside AMsh soma. N: number of animals analyzed. (B) Schematic depicting the two compartments of the AFD–NRE, which is an array of ~45 actin-based microvilli (green) and a single microtubule-based cilium (blue). Fluorescence and DIC micrographs showing expression of ciliary DYF-11:GFP, under an AFD neuron-specific promoter, in AFD cilia. C: cilia (arrowhead); D: AFD dendrite (arrow). (C) Fluorescence micrograph panel showing AFD–NRE tagged puncta (blue arrows) within AMsh glial cell soma (magenta outline) in different genetic backgrounds as noted. AFD cell body (red asterisk). Scale bar: 5 μm. (D) Population counts of animals with AMsh glial puncta. Refer Figure 2C for data presentation details. Alleles used: ttx-1(p767), dyf-11(mn392), and osm-6(p811). (+) p<0.05 compared to wild type, (–) p≥0.05 compared to wild type. (E) Median puncta counts and N (number of animals): wild type (14 ± 1 puncta, n = 78 animals), ttx-1(p767) (0.1 ± 0.1 puncta, n = 7 animals), and dyf-11(mn392) (38.6 ± 3.6 puncta, n = 27 animals). Refer Figure 2D for data presentation details. NRE: neuron-receptive ending.
Figure 4.
Figure 4.. Engulfment of AFD–NRE by AMsh glia requires the phosphatidylserine receptor PSR-1 and integrin PAT-2.
(A) Schematic of the genetic pathway underlying apoptotic corpse engulfment in C. elegans. (B–D) Population counts of animals with AMsh glia puncta. Refer Figure 2C for data presentation details. (+) p<0.05 compared to wild type, (–) p≥0.05 compared to wild type. (B) Alleles used in this graph: tat-1(tm3110), tat-1(tm1034), scrm-1(tm805), and ced-8(n1819). (C) Alleles used in this graph: ced-1(e1754), ced-1(e1735), ced-7(n2094), and ced-6(n1813). (D) Alleles used in this graph: psr-1(tm469), tat-1(tm1034), and ttr-52(tm2078). (E) Quantification of puncta within AMsh cell soma in listed mutants. Refer Figure 2D for data presentation details. Median puncta counts and N (number of animals): wild type (14 ± 1 puncta, n = 78 animals), psr-1(tm469) (7.4 ± 0.8 puncta, n = 28 animals), and tat-1 (41.6 ± 4.6 puncta, n = 19 animals). (F) Fluorescence micrograph of a transgenic animal with GFP tagged PSR-1 expressed specifically in AMsh glia (magenta) localizing on the apical membrane around AFD–NRE (green). GFP:PSR localizes to apical membrane in AMsh glia (yellow arrow) around AFD–NRE (asterisk). Scale bar: 5 μm. (F’) Zoom of box in two-color merged image. (G) RNAi (control pat-2) in wild-type or psr-1(tm469) mutant animals. Refer Figure 2C for data presentation details. EV: empty vector control. NRE: neuron-receptive ending.
Figure 4—figure supplement 1.
Figure 4—figure supplement 1.. Engulfment of AFD–NRE by AMsh glia does not depend on some RTK or CED-1/MEGF10/Draper.
(A) Percent animals with AFD–NRE-labeled puncta in AMsh glia. X-axis: genotype; Y-axis: percent animals. N: number of animals examined. Alleles as noted. (B, C) Population counts of animals with AMsh glial puncta in animals as noted in the genotype. Refer Figure 2C for data presentation details. Alleles used in either graph: psr-1(tm469), ced-1(e1754), and ttr-52(tm2078). EV: empty vector control. (+) p<0.05 compared to wild type, (–) p≥0.05 compared to wild type. NRE: neuron-receptive ending.
Figure 5.
Figure 5.. Phagocytosis pathway components, glial CED-10 levels, and actin remodeling actively control rate of engulfment.
(A) Population counts of animals with AMsh glial puncta in the indicated genetic backgrounds. Refer Figure 2C for data presentation details. (+) p<0.05 compared to wild type, (–) p≥0.05 compared to wild type. Alleles used in this graph: ced-12(n3261), ced-12(k149), ced-2(e1752), and ced-5(n1812). (B) Quantification of puncta within AMsh cell soma in phagocytosis pathway mutants. Refer Figure 2D for data presentation details. Median puncta counts and N (number of animals): wild type (14 ± 1 puncta, n = 78 animals), ced-10(n1993) (2.4 ± 0.6 puncta, n = 24 animals), ced-10(n3246) (3.08 ± 0.79, n = 39), andPAMsh:CED-10 (104.7 ± 7.8 puncta, n = 14 animals). (C) Panel showing AFD–NRE tagged puncta (blue arrows) within AMsh glial cell soma (magenta outline) in different genetic backgrounds as noted. AFD cell body (red asterisk). Scale bar: 5 μm. (D, E) Population counts of animals with AMsh glial puncta in genetic backgrounds indicated. Refer Figure 2C for data presentation details. (+) p<0.05 compared to wild type, (–) p≥0.05 compared to wild type. (D) Alleles used in this graph: ced-10(n3246) and ced-10(n1993). CED-10G12V and CED-10T17N is a constitutively active or dominant negative form of CED-10, respectively. (E) Alleles used in this graph: psr-1(tm469), ced-10(n3246), and ced-12 (k149). NRE: neuron-receptive ending.
Figure 5—figure supplement 1.
Figure 5—figure supplement 1.. The actin regulator WSP-1 can regulate engulfment cell-autonomously in AMsh glia.
(A) Population counts of animals with AMsh glial puncta in animals as noted in the genotype. Allele used: wsp-1(gm324). Refer Figure 2C for data presentation details. (+) p<0.05 compared to wild type, (–) p≥0.05 compared to wild type.
Figure 6.
Figure 6.. Glial phagocytic pathway tracks neuron activity to regulate AFD–NRE engulfment rate.
(A) Panel showing AFD–NRE tagged puncta (blue arrows) within AMsh glial cell soma (magenta outline) in different genetic backgrounds, as noted. AFD cell body (red asterisk). Scale bar: 5 μm. (B) Quantification of puncta within AMsh cell soma in phagocytosis pathway mutants. Refer Figure 2D for data presentation details. Median puncta counts and N (number of animals): wild type (14 ± 1 puncta, n = 78 animals), pde-1(nj57) pde-5(nj49) double mutant animals (7.1 ± 1.4, n = 11 animals), tax-4(p678);cng-3(jh113) double mutants (23.8 ± 2.4 puncta, n = 17 animals), tax-2(p691) (28.1 ± 2 puncta, n = 37 animals), and ced-10(n3246); tax-2(p691) double mutants (1.8 ± 0.5 puncta, n = 25 animals). (C, D) Population counts of animals with AMsh glial puncta in genetic backgrounds indicated. Refer Figure 2C for data presentation details. (+) p<0.05 compared to wild type, (–) p≥0.05 compared to wild type. (C) Alleles used in this graph: pde-1(nj57), pde-5(nj49), tax-4(p678), cng-3(jh113), tax-2(p691), ced-10(n3246), and psr-1(tm469). (D) Alleles used in this graph: tax-2(p691), and psr-1(tm469). EV: empty vector control. (E) Percent wild type or ced-10(n3246) mutant animals with observable GFP+ puncta with or without histamine. N: number of animals. (F) Quantification of percent animals with puncta in AMsh glia (Y-axis) in transgenic strains carrying a histamine-gated chloride channel, with/out histamine activation as noted (X-axis). NRE: neuron-receptive ending.
Figure 7.
Figure 7.. AMsh glial engulfment of AFD–NRE modulates AFD–NRE shape and animal thermosensory behavior.
(A) AFD–NRE microvilli labeled with GFP in day 3 adult animals of genotypes as indicated. Three representative images are shown for each genotype. Scale bar: 5 μm (B) Quantification of percent animals with defective AFD–NRE microvilli shape. N: number of animals scored. (C–F) Thermotaxis behavior assays for animals of indicated genotype raised at 15°C (C, E) or 25°C (D, F). Animals assayed 24 hr post-mid-L4 larval stage. N: number of animals. NRE: neuron-receptive ending.
Figure 7—figure supplement 1.
Figure 7—figure supplement 1.. AMsh glial CED-10 tracks neuron activity to regulate AFD–NRE engulfment.
(A) Day 1 AFD–NRE defects in animals expressing constitutive active CED-10G12V in AMsh glia. (B) Proportion of worms with defective AFD–NRE shape on days 1 and 3 of adulthood in animals expressing constitutive active CED-10G12V or dominant negative CED-10T17N. ttx-1 (p767) mutant analysis included for reference. (C, D) Thermotaxis behavior assays for animals of indicated genotype raised at 15°C (C) or 25°C (D). Animals assayed 24 hr post-mid-L4 larval stage. N: number of animals. Genotype as noted. Alleles used for assays: tax-2(p691) and tax-4(p678). NRE: neuron-receptive ending.
Figure 8.
Figure 8.. Model of AMsh glial engulfment of AFD–NRE.
Model depicting molecular machinery driving engulfment of AFD neuron microvilli by AMsh glia. TAT-1 maintains phosphatidylserine on the inner plasma leaflet. Neuron activity negatively regulates engulfment. The phosphatidylserine receptor PSR-1 signals via ternary GEF complex CED-2/5/12 to activate Rac1 GTPase CED-10, along with PAT-2/integrin. CED-10 and its downstream effector, WSP-1, drive engulfment of AFD neuron microvilli fragments. NRE: neuron-receptive ending.
Author response image 1.
Author response image 1.. (A) psr-1 genomic organization and transcriptional reporters tested.
Gray: gene upstream; black = psr-1 exons; green = GFP. (B-E). Ppsr-1A:GFP transcriptional reporter across different life stages, as noted on each panel. Presumptive neural cells in the head region of the animal (magenta arrow), and interneuron (yellow arrow) are seen. Scale bar = 5µm.

Similar articles

Cited by

References

    1. Abraham MC, Lu Y, Shaham S. A morphologically conserved nonapoptotic program promotes linker cell death in Caenorhabditis elegans. Developmental Cell. 2007;12:73–86. doi: 10.1016/j.devcel.2006.11.012. - DOI - PubMed
    1. Allen NJ, Eroglu C. Cell biology of Astrocyte-Synapse interactions. Neuron. 2017;96:697–708. doi: 10.1016/j.neuron.2017.09.056. - DOI - PMC - PubMed
    1. Andersen JP, Vestergaard AL, Mikkelsen SA, Mogensen LS, Chalat M, Molday RS. P4-ATPases as phospholipid Flippases-Structure, function, and enigmas. Frontiers in Physiology. 2016;7:275. doi: 10.3389/fphys.2016.00275. - DOI - PMC - PubMed
    1. Armenti ST, Lohmer LL, Sherwood DR, Nance J. Repurposing an endogenous degradation system for rapid and targeted depletion of C. elegans proteins. Development. 2014;141:4640–4647. doi: 10.1242/dev.115048. - DOI - PMC - PubMed
    1. Bacaj T, Lu Y, Shaham S. The conserved proteins CHE-12 and DYF-11 are required for sensory cilium function in Caenorhabditis elegans. Genetics. 2008a;178:989–1002. doi: 10.1534/genetics.107.082453. - DOI - PMC - PubMed

Publication types