. 2021 Mar 24:10:e59687.
doi: 10.7554/eLife.59687.

Pregnancy-associated plasma protein-aa regulates endoplasmic reticulum-mitochondria associations

Affiliations

Pregnancy-associated plasma protein-aa regulates endoplasmic reticulum-mitochondria associations

Mroj Alassaf et al. Elife. .

Abstract

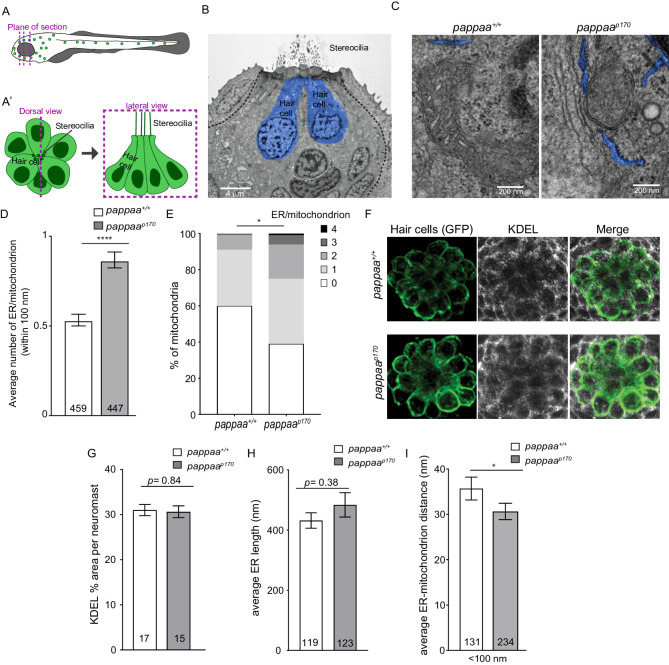
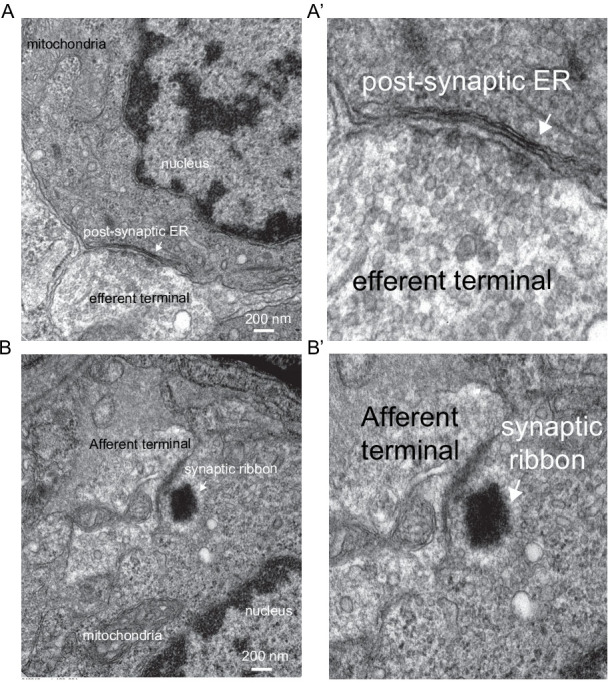
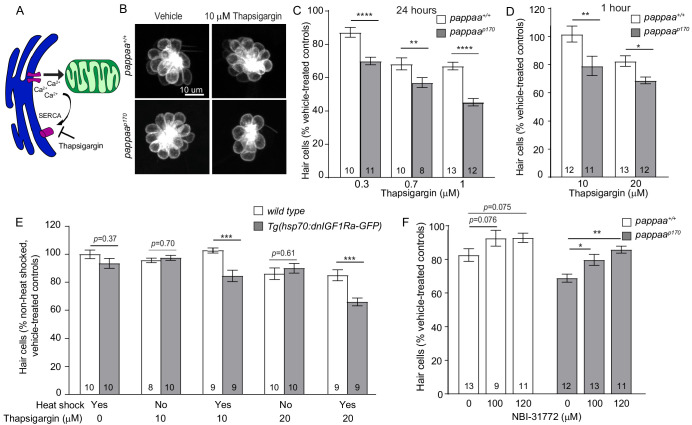
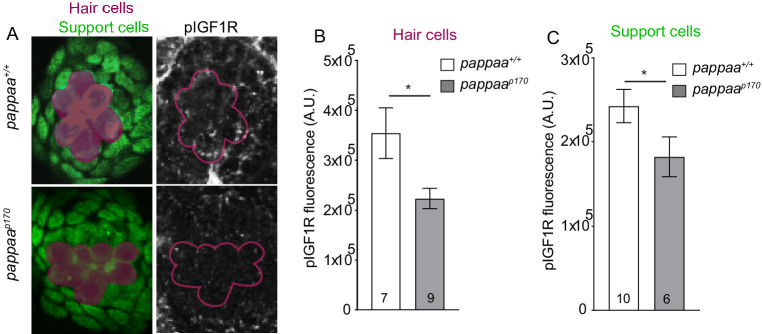
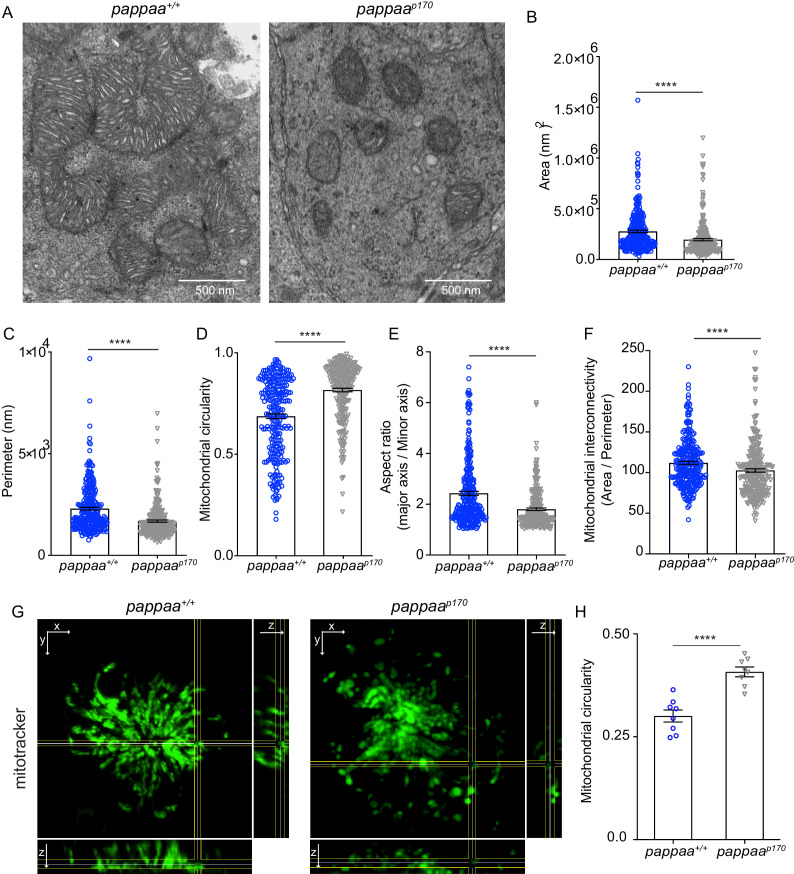
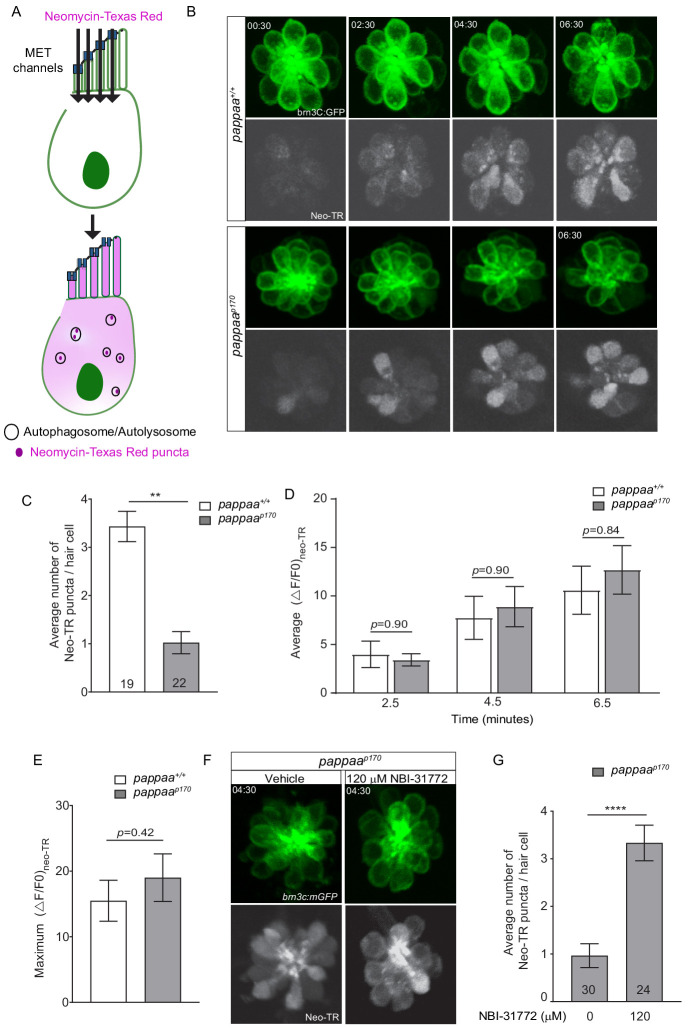
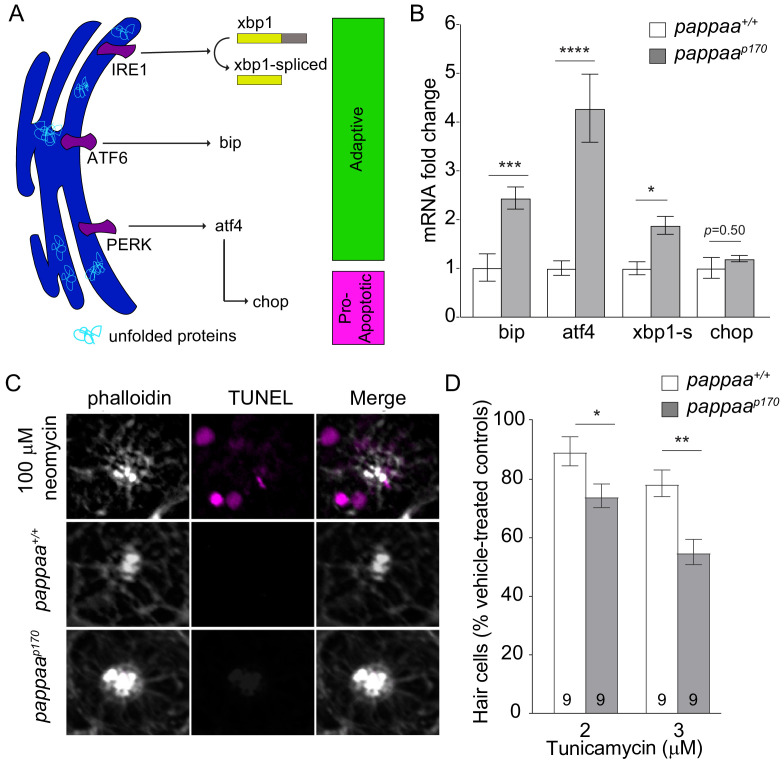
Endoplasmic reticulum (ER) and mitochondria form close physical associations to facilitate calcium transfer, thereby regulating mitochondrial function. Neurons with high metabolic demands, such as sensory hair cells, are especially dependent on precisely regulated ER-mitochondria associations. We previously showed that the secreted metalloprotease pregnancy-associated plasma protein-aa (Pappaa) regulates mitochondrial function in zebrafish lateral line hair cells (Alassaf et al., 2019). Here, we show that pappaa mutant hair cells exhibit excessive and abnormally close ER-mitochondria associations, suggesting increased ER-mitochondria calcium transfer. pappaa mutant hair cells are more vulnerable to pharmacological induction of ER-calcium transfer. Additionally, pappaa mutant hair cells display ER stress and dysfunctional downstream processes of the ER-mitochondria axis including altered mitochondrial morphology and reduced autophagy. We further show that Pappaa influences ER-calcium transfer and autophagy via its ability to stimulate insulin-like growth factor-1 bioavailability. Together our results identify Pappaa as a novel regulator of the ER-mitochondria axis.

Keywords: ER stress; IGF signaling; autophagy; cell biology; hair cell; neurodegeneration; neuroscience; zebrafish.


Conflict of interest statement

MA, MH No competing interests declared

Figures

Figure 1.
Figure 1.. Pappaa regulates ER-mitochondria associations.
(A–A’) Schematic of zebrafish lateral line hair cells. (A) The dotted lines represent EM plane of section. (A’) Schematic of a dorsal view (left) and lateral view (right) of a single neuromast. (B) Representative EM section of lateral line neuromast taken along the apical-basal axis of lateral line hair cells (blue) in 5 dpf larva. Scale bar = 4 μm. (C) Representative EM images of ER-mitochondria associations in wild-type and pappaa hair cells. ER is pseudo colored in blue. Scale bar = 200 nm. (D) Mean number of ER tubules within 100 nm of mitochondria. ****p<0.0001 t-test, Mann–Whitney correction. N = 459 mitochondria (wild type) and 447 mitochondria (pappaap170) collected from six larvae/genotype. Error bars = SEM. (E) Percentages of mitochondria associated with 0, 1, 2, 3, or 4 ER tubules. *p<0.05 chi-square test. N = 459 mitochondria (wild type) and 447 mitochondria (pappaap170) collected from six larvae/genotype. (F) KDEL immunolabeling in 5 dpf wild-type and pappaap170 brn3c:mGFP-labeled hair cells. (G) Mean percentage of area covered by KDEL immunolabeling per neuromast. Unpaired t-test with Welch correction revealed no significant difference between groups p=0.84. N = 15–17 larvae/genotype (shown at base of bars), 1–3 neuromasts/larva. Total number of neuromasts included in the analysis = 35 (wild type) and 31 (pappaap170) neuromasts from two experiments. (H) Mean length of ER tubules. t-test with Mann–Whitney correction found no significant difference. N = 119 ER tubules (wild type) and 123 ER tubules (pappaap170) collected from six larvae/genotype. (I) Mean distance between the ER and mitochondria that are within 100 nm of each other. *p<0.05 t-test, Mann–Whitney correction. N = 131 ER-mitochondria associations (wild type) and 234 ER-mitochondria associations (pappaap170) collected from six larvae/genotype. Error bars=SEM.
Figure 1—figure supplement 1.
Figure 1—figure supplement 1.. Representative EM images of (A–A’) an efferent contact showing the post-synaptic ER (arrow) and afferent (B–B’) contact identified by the synaptic ribbon (arrow).
Figure 2.
Figure 2.. pappaap170 hair cells are more sensitive to disruption in ER–mitochondria calcium signaling.
(A) Thapsigargin increases calcium concentration at the ER-mitochondria junction by blocking the SERCA pump and inhibiting calcium uptake by the ER. (B) Representative images of brn3c:mGFP-labeled hair cells from vehicle or 10 µM thapsigargin-treated larvae. (C) Mean percentage of surviving hair cells following 24 hr treatments with thapsigargin starting at 4 dpf. To calculate hair cell survival percentage, hair cell number post-drug treatment was normalized to mean hair cell number in vehicle treated larvae of the same genotype. **p<0.01, ****p<0.0001, two-way ANOVA, Holm–Sidak post-test. N = 8–13 larvae per group (shown at base of bars), three neuromasts/larva were analyzed. Total number of neuromasts included in the analysis = 24 (wild type; vehicle-treated), 24 (pappaap170; vehicle-treated), 30 (wild type; 0.3 μM thapsigargin), 33 (pappaap170; 0.3 μM thapsigargin), 30 (wild type; 0.7 μM thapsigargin), 24 (pappaap170; 0.7 μM thapsigargin), 39 (wild type; 1 μM thapsigargin), 36 (pappaap170; 1 μM thapsigargin). (D) Mean percentage of surviving hair cells following 1 hr treatment with thapsigargin at 5 dpf. *p<0.05, **p<0.01, two-way ANOVA, Holm–Sidak post-test. N = 8–13 larvae per group (shown at base of bars), three neuromasts/larva from two experiments were analyzed. Total number of neuromasts included in the analysis = 60 (wild type; vehicle-treated), 60 (pappaap170; vehicle-treated), 36 (wild type; 10 μM thapsigargin), 33 (pappaap170; 10 μM thapsigargin), 39 (wild type; 20 μM thapsigargin), 36 (pappaap170; 20 μM thapsigargin). (E) Mean percentage of surviving hair cells following induction of dnIGF1R expression. To calculate hair cell survival percentage, hair cell number after 1 hr treatments with thapsigargin was normalized to mean hair cell number in non-heat-shocked, vehicle-treated larvae of the same genotype. ***p<0.001 two-way ANOVA, Holm–Sidak post-test. N = 8–10 larvae per group (shown at base of bars), three neuromasts per larva. Total number of neuromasts included in the analysis = 30 (wild type; non-heat-shocked, vehicle-treated), 27 (dnIGF1Ra; non-heat-shocked, vehicle-treated), 30 (wild type; heat-shocked, vehicle-treated), 30 (dnIGF1Ra; heat-shocked, vehicle-treated), 24 (wild type; non-heat-shocked, 10 μM thapsigargin), 30 (dnIGF1Ra; non-heat-shocked, 10 μM thapsigargin), 27 (wild type; heat-shocked, 10 μM thapsigargin), 27 (dnIGF1Ra; heat-shocked, 10 μM thapsigargin), 30 (wild type; non heat-shocked, 20 μM thapsigargin), 30 (dnIGF1Ra; non-heat-shocked, 20 μM thapsigargin), 27 (wild type; heat-shocked, 20 μM thapsigargin), 27 (dnIGF1Ra; heat-shocked, 20 μM thapsigargin). (F) Mean percentage of surviving hair cells following co-treatment with NBI-31772 and 20 µM thapsigargin. To calculate hair cell survival percentage, hair cell counts after treatment were normalized to hair cell number in vehicle treated larvae of the same genotype. *p<0.05, **p<0.01. Two-way ANOVA, Holm–Sidak post-test. N = 9–13 larvae per group (shown at base of bars), three neuromasts per larva. Total number of neuromasts included in the analysis = 24 (wild type; vehicle-treated), 24 (pappaap170; vehicle-treated), 39 (wild type; 20 μM thapsigargin), 36 (pappaap170; 20 μM thapsigargin), 27 (wild type; 20 μM thapsigargin+ 100 μM NBΙ−31772), 39 (pappaap170; 20 μM thapsigargin + 100 μM NBΙ−31772), 33 (wild type; 20 μM thapsigargin + 120 μM NBΙ−31772), and 33 (pappaap170; 20 μM Thapsigargin + 120 μM NBΙ−31772).
Figure 2—figure supplement 1.
Figure 2—figure supplement 1.. Anti-pIGF1R immunolabeling.
(A) brn3c:mGFP-labeled hair cells (magenta) and SOX2 labeled support cells (green) immunostained with anti-pIGF1R antibody (white). (B) Mean pIGF1R fluorescence from Z-stack summation projections of brn3c:mGFP-labeled hair cells. *p<0.05 t-test, Mann–Whitney correction. N = 7–9 larvae per group, 3–4 neuromast/larva. Total number of neuromasts included in the analysis = 23 (wild type) and 27 (pappaap170). (C) Mean pIGF1R fluorescence from Z-stack summation projections of 10 randomly selected support cells per neuromast. *p<0.05 t-test, Mann–Whitney correction. N = 6–10 larvae per group, 2–4 neuromast/larva. Total number of neuromasts included in the analysis = 26 (wild type) and 21 (pappaap170). Error bars=SEM.
Figure 3.
Figure 3.. Pappaa loss causes mitochondrial fragmentation.
(A) Representative EM images of mitochondria in lateral line hair cells in 5 dpf wild-type and pappaap170 larvae. (B–F) Mean mitochondrial (B) area, (C) perimeter, (D) circularity, (E) aspect ratio, and (F) interconnectivity in 5 dpf wild-type and pappaap170 lateral line hair cells. ****p<0.0001 t-test, Mann–Whitney correction. N = 272 mitochondria (wild type) and 262 mitochondria (pappaap170) collected from six larvae/genotype. (G) Representative images of 5 dpf wild-type and pappaap170 lateral line hair cells loaded with the vital mitochondrial dye, Mitotracker. Images are maximum intensity projection through neuromast in xy view, with cross sections of yz plane shown at right and xz plane shown at bottom. (H) Mean mitochondrial circularity measured from Z-stack max intensity projections of wild-type and pappaap170 lateral line hair cells. ****p<0.0001 t-test, Welch correction. N = 8 larvae per group (shown at base of bars), one neuromast/ larva. Error bars=SEM. See Videos 1 and 2.
Figure 4.
Figure 4.. Pappaa regulates neomycin-induced autophagy.
(A) Schematic showing cell entry and autophagy of neomycin-Texas Red. (B) Representative time lapse images of brn3C:mGFP-labeled neuromast hair cells (green) at 5 dpf following exposure to 10 μM neomycin-Texas Red (white). (C) Mean number of neomycin-Texas Red puncta/hair cell in wild-type and pappaap170 larvae at 5 dpf. **p<0.01 t-test, Mann–Whitney correction. N = 19 hair cells (wild type) and 22 hair cells (pappaap170) collected from four larvae/genotype. (D) Mean neomycin-Texas Red ΔF/F0 at 2.5, 4.5, and 6.5 min post-exposure. Multiple t-test with Holm–Sidak correction found no significant difference. N = 22 hair cells (wild type) and 22 hair cells (pappaap170) collected from four larvae/genotype. (E) Maximum change in neomycin-Texas Red fluorescent intensity across treatment time. Unpaired t-test with Mann–Whitney correction found no significant difference. N = 22 hair cells (wild type) and 22 hair cells (pappaap170) collected from four larvae/genotype. See Videos 1 and 2. (F) Representative time lapse images of vehicle or 120 μM NBI-31772 treated brn3C:mGFP-labeled neuromast hair cells (green) of pappaap170 larvae at 5 dpf following exposure to 10 μM neomycin-Texas Red (white). (G) Mean number of neomycin-Texas Red puncta/hair cell in vehicle or 120 μM NBI-31772 treated pappaap170 larvae at 5 dpf. ****p<0.0001 t-test, Mann–Whitney correction. N = 30 hair cells (Vehicle) and 24 hair cells (120 μM NBI-31772) collected from four larvae/ group. Error bars=SEM.
Figure 5.
Figure 5.. Pappaa loss causes ER stress.
(A) Schematic of the UPR pathway. The accumulation of unfolded proteins activates the UPR receptors, IRE1, ATF6, and PERK, signifying ER stress. In the early adaptive phase of ER stress, the UPR promotes cell survival through the upregulation of pro-survival factors including bip, atf4, and spliced xbp1. A switch from an adaptive to a pro-apoptotic UPR occurs during the late phase of ER stress in which Chop, a pro-apoptotic transcription factor, is upregulated. (B) Mean fold change in UPR mRNA levels in wild-type and pappaap170 hair cells at 5 dpf. N = 2–3 technical replicates/gene. *p<0.05, ***p<0.001, ****p<0.0001, two-way ANOVA, Holm–Sidak post-test. Error bars=SEM. (C) Representative images of TUNEL staining (magenta) in wild-type and pappaap170 lateral line hair cells. Stereocilia are counterstained with phalloidin (white). A 30 min treatment with 100 μM neomycin was used as positive control (top). (D) Mean percentage of surviving hair cells following a 24 hr treatment with tunicamycin starting from 4 dpf. To calculate hair cell survival percentage, hair cell number post-treatment was normalized to mean hair cell number in vehicle-treated larvae of the same genotype. *p<0.05, **p<0.01, two-way ANOVA, Holm–Sidak post-test. N = 8–10 larvae per group (shown at base of bars), three neuromasts/larva from two experiments were analyzed. Total number of neuromasts included in the analysis = 51 (wild type; vehicle treated), 57 (pappaap170; vehicle treated), 27 (wild type; 2 μM Tunicamycin), 27 (pappaap170; 2 μM Tunicamycin), 27 (wild type; 3 μM Tunicamycin), 27 (pappaap170; 3 μM Tunicamycin). Error bars=SEM.

Similar articles

Cited by

References

    1. Adam-Vizi V, Starkov AA. Calcium and mitochondrial reactive oxygen species generation: how to read the facts. Journal of Alzheimer's Disease. 2010;20:S413–S426. doi: 10.3233/JAD-2010-100465. - DOI - PMC - PubMed
    1. Alassaf M, Daykin EC, Mathiaparanam J, Wolman MA. Pregnancy-associated plasma protein-aa supports hair cell survival by regulating mitochondrial function. eLife. 2019;8:e47061. doi: 10.7554/eLife.47061. - DOI - PMC - PubMed
    1. Alharazneh A, Luk L, Huth M, Monfared A, Steyger PS, Cheng AG, Ricci AJ. Functional hair cell mechanotransducer channels are required for aminoglycoside ototoxicity. PLOS ONE. 2011;6:e22347. doi: 10.1371/journal.pone.0022347. - DOI - PMC - PubMed
    1. Allwardt BA, Lall AB, Brockerhoff SE, Dowling JE. Synapse formation is arrested in retinal photoreceptors of the zebrafish nrc mutant. The Journal of Neuroscience. 2001;21:2330–2342. doi: 10.1523/JNEUROSCI.21-07-02330.2001. - DOI - PMC - PubMed
    1. Area-Gomez E, Del Carmen Lara Castillo M, Tambini MD, Guardia-Laguarta C, de Groof AJ, Madra M, Ikenouchi J, Umeda M, Bird TD, Sturley SL, Schon EA. Upregulated function of mitochondria-associated ER membranes in alzheimer disease. The EMBO Journal. 2012;31:4106–4123. doi: 10.1038/emboj.2012.202. - DOI - PMC - PubMed

Publication types

MeSH terms

LinkOut - more resources