Quantification of Retinal Ganglion Cell Morphology in Human Glaucomatous Eyes
- PMID: 33760041
- PMCID: PMC7995922
- DOI: 10.1167/iovs.62.3.34
Quantification of Retinal Ganglion Cell Morphology in Human Glaucomatous Eyes
Abstract
Purpose: To characterize retinal ganglion cell morphological changes in patients with primary open-angle glaucoma associated with hemifield defect (HD) using adaptive optics-optical coherence tomography (AO-OCT).
Methods: Six patients with early to moderate primary open-angle glaucoma with an average age of 58 years associated with HD and six age-matched healthy controls with an average age of 61 years were included. All participants underwent in vivo retinal ganglion cell (RGC) imaging at six primary locations across the macula with AO-OCT. Ganglion cell layer (GCL) somas were manually counted, and morphological parameters of GCL soma density, size, and symmetry were calculated. RGC cellular characteristics were correlated with functional visual field measurements.
Results: GCL soma density was 12,799 ± 7747 cells/mm2, 9370 ± 5572 cells/mm2, and 2134 ± 1494 cells/mm2 at 3°, 6°, and 12°, respectively, in glaucoma patients compared with 25,058 ± 4649 cells/mm2, 15,551 ± 2301 cells/mm2, and 3891 ± 1105 cells/mm2 (P < 0.05 for all locations) at the corresponding retinal locations in healthy participants. Mean soma diameter was significantly larger in glaucoma patients (14.20 ± 2.30 µm) compared with the health controls (12.32 ± 1.94 µm, P < 0.05 for all locations); symmetry was 0.36 ± 0.32 and 0.86 ± 0.13 in glaucoma and control cohorts, respectively.
Conclusions: Glaucoma patients had lower GCL soma density and symmetry, greater soma size, and increased variation of GCL soma reflectance compared with age-matched control subjects. The morphological changes corresponded with HD, and the cellular level structural loss correlated with visual function loss in glaucoma. AO-based morphological parameters could be potential sensitive biomarkers for glaucoma.
Conflict of interest statement
Disclosure:
Figures


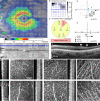
 ) in (A) and (B) denote more diseased hemifield and filled purple symbols (
 ) represent relatively healthier hemifield. For the control group, open green symbols were from (
 ) superior retina and filled green symbols (
 ) are from inferior retina. In each plot, different symbols represent different subjects. In (D) data is color-coded with respect to eccentricity: 3° data in darkest color symbol and 12° in lightest color symbol. Colors in (E) and (F) are coded with respect to retinal eccentricities, and the percentage was normalized to control eyes. The black dashed line denotes x = −y that indicates an equal rate of structural and functional loss. While the true structure-function relationship is non-linear and more complex, a coarse rule-of-thumb is that datapoints above the x = −y line (log-log scaling) represent structural losses preceding functional loss and datapoints below represent the opposite. The red dashed line denotes 3 dB PD loss. P-Value < 0.01 **, and P-Value < 0.05 * (Students’ t-test). r in (D-E) is the Pearson correlation coefficient.


References
-
- Tham YC, Li X, Wong TY, Quigley HA, Aung T, Cheng CY. Global prevalence of glaucoma and projections of glaucoma burden through 2040: a systematic review and meta-analysis. Ophthalmology. 2014; 121: 2081–2090. - PubMed
-
- Nickells RW. From ocular hypertension to ganglion cell death: a theoretical sequence of events leading to glaucoma. Can J Ophthalmol. 2007; 42: 278–287. - PubMed
-
- Quigley HA. Neuronal death in glaucoma. Prog Retin Eye Res. 1999; 18: 39–57. - PubMed
Publication types
MeSH terms
Grants and funding
LinkOut - more resources
Full Text Sources
Other Literature Sources
Medical

