. 2021 May 3;218(5):e20200924.
doi: 10.1084/jem.20200924.

Mitochondrial metabolism supports resistance to IDH mutant inhibitors in acute myeloid leukemia

Affiliations

Mitochondrial metabolism supports resistance to IDH mutant inhibitors in acute myeloid leukemia

Lucille Stuani et al. J Exp Med. .

Abstract

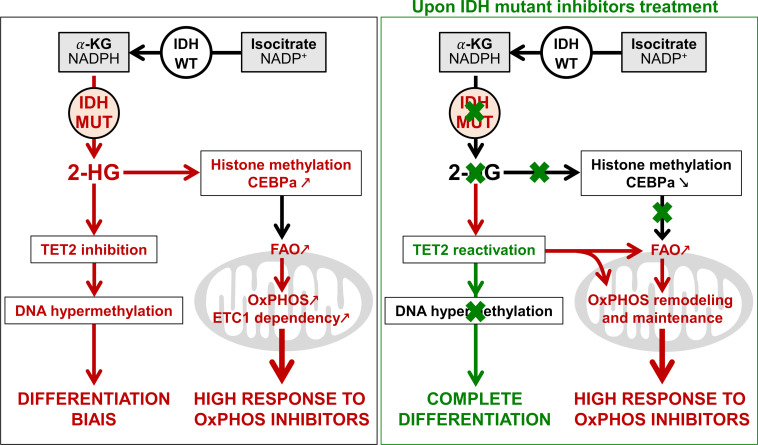
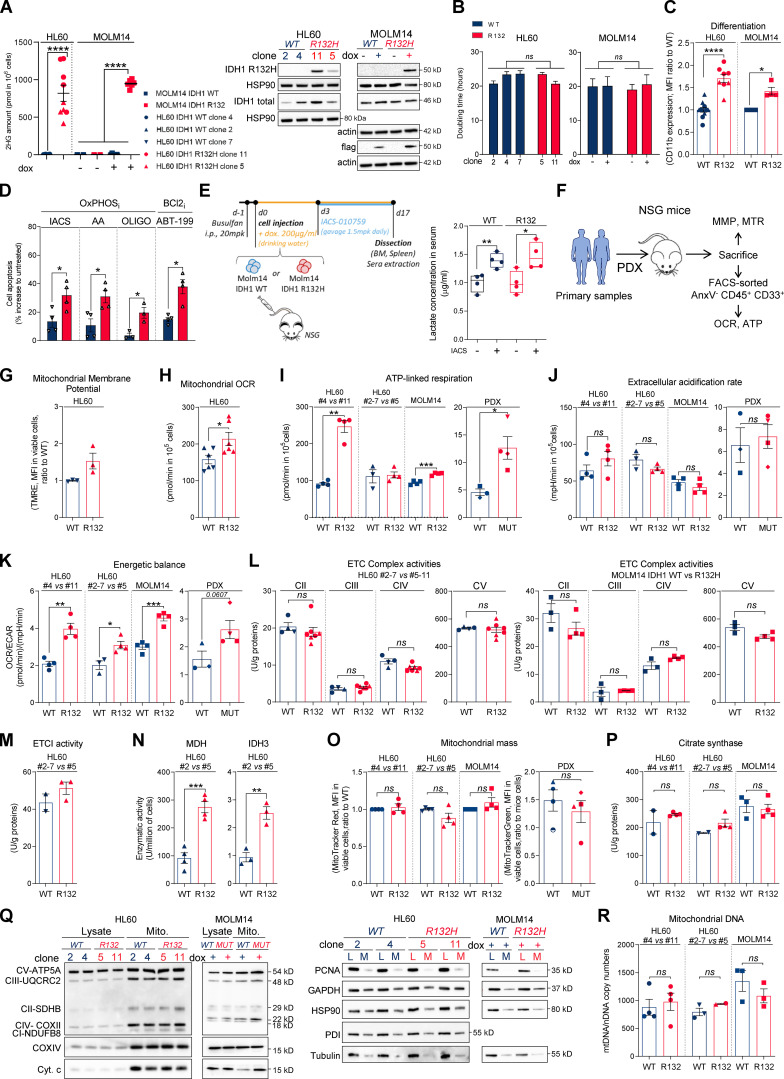
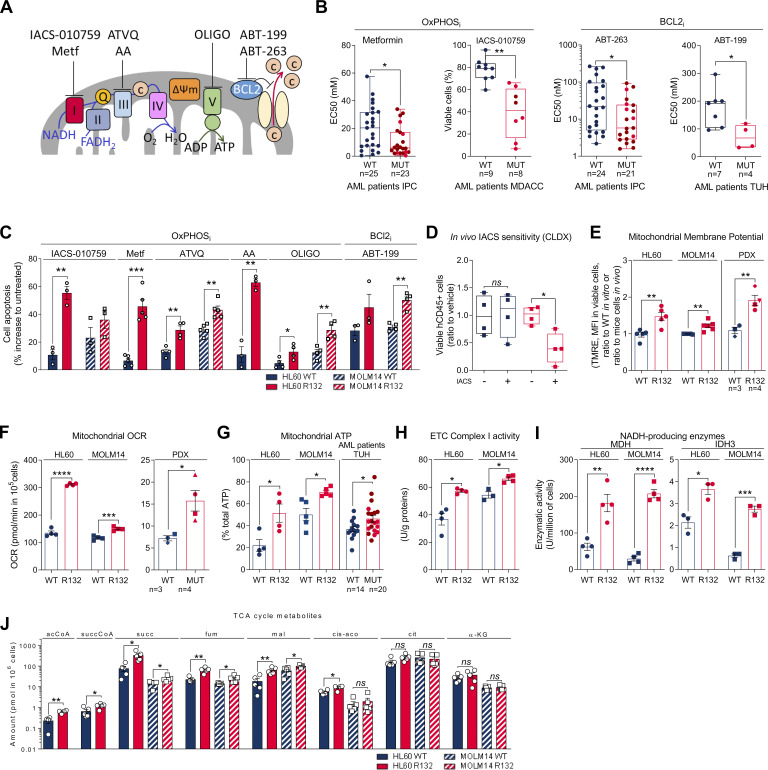
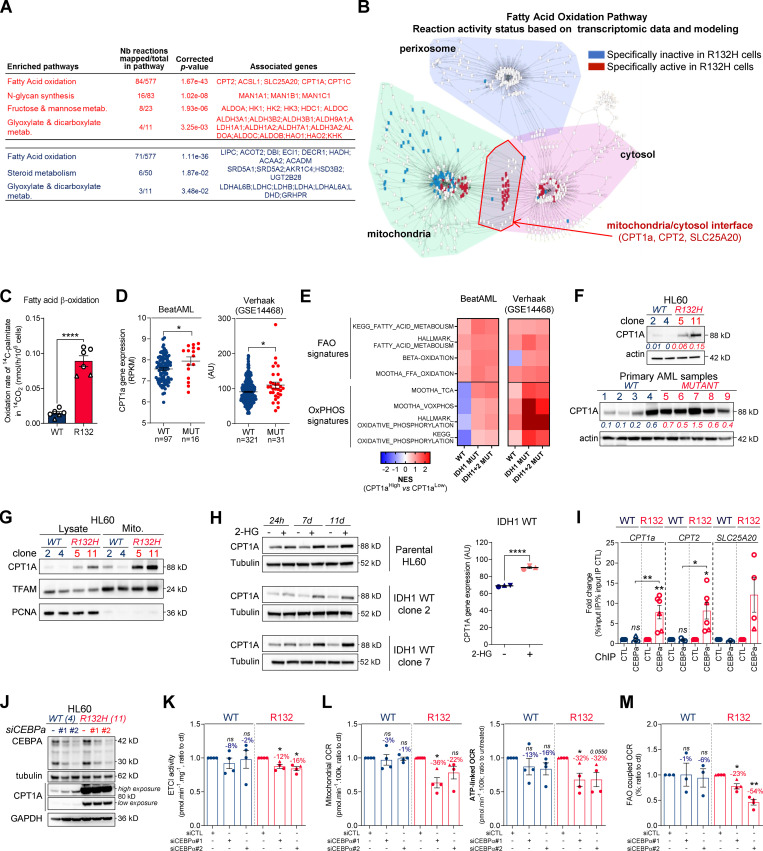
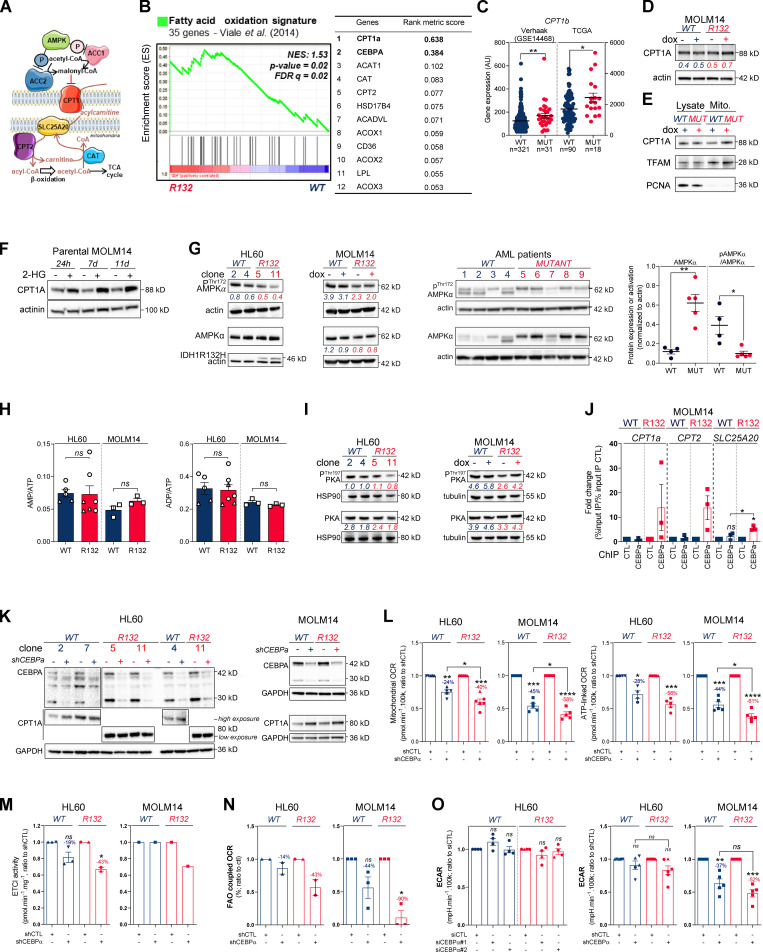
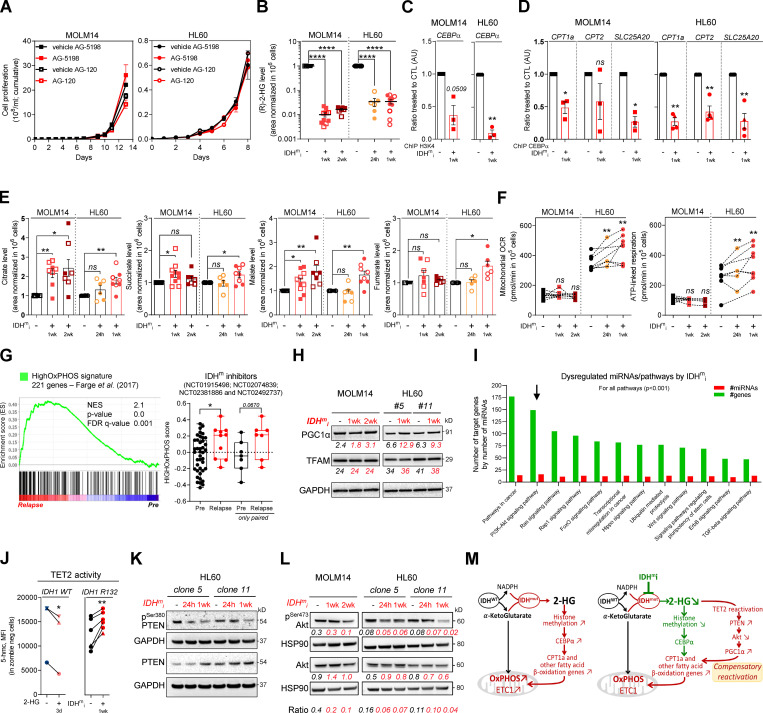
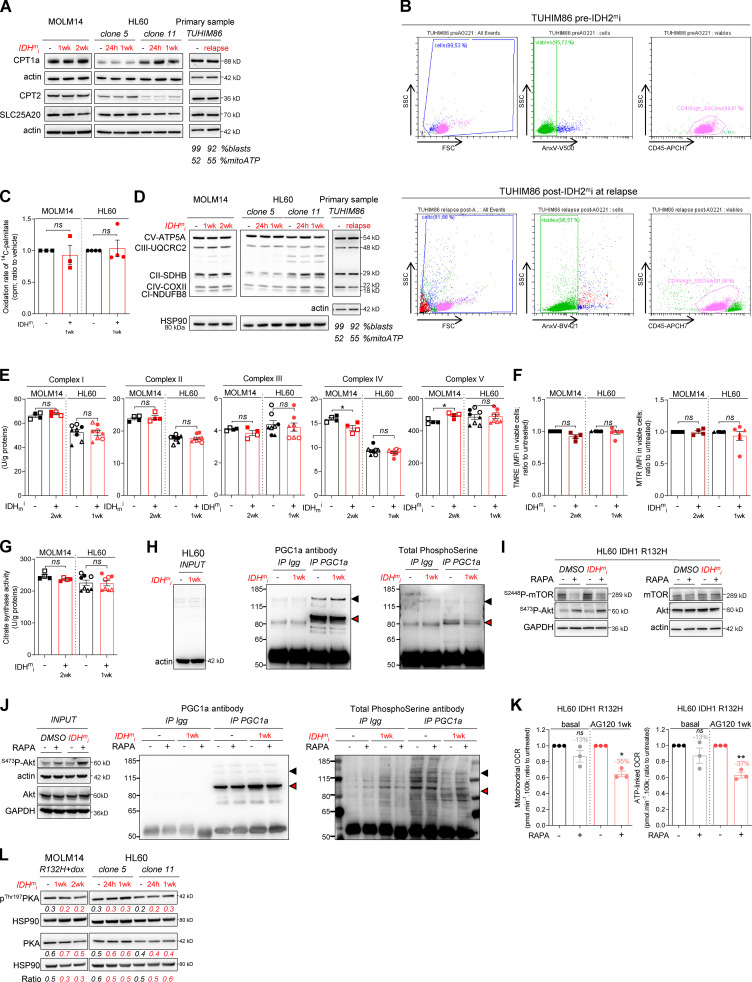
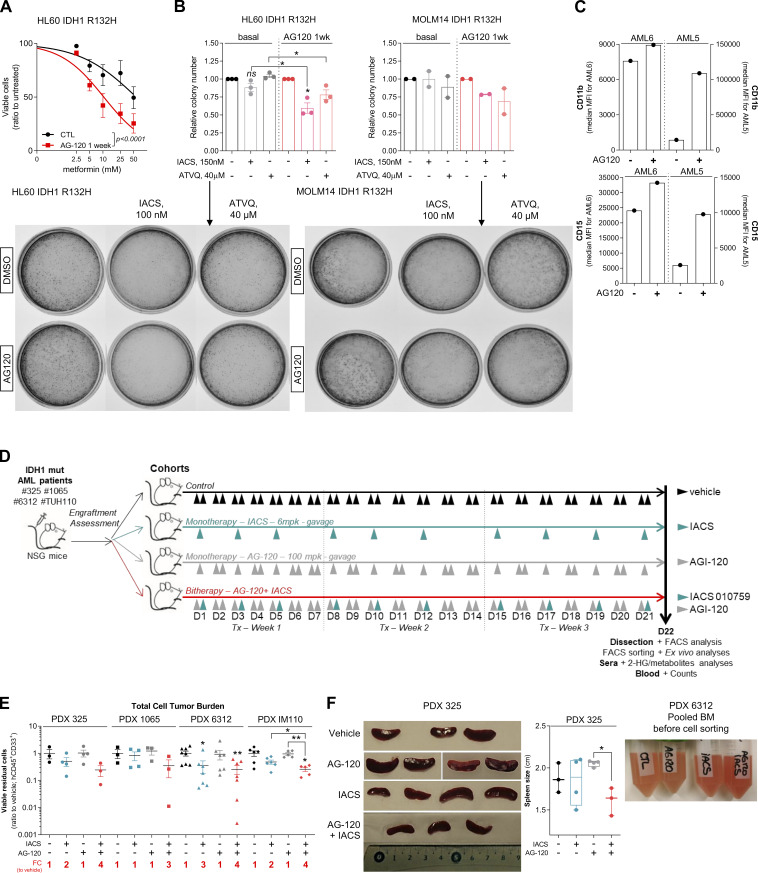
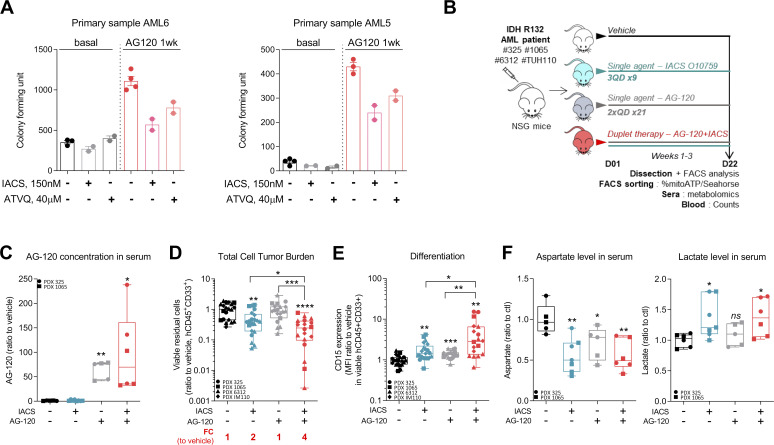
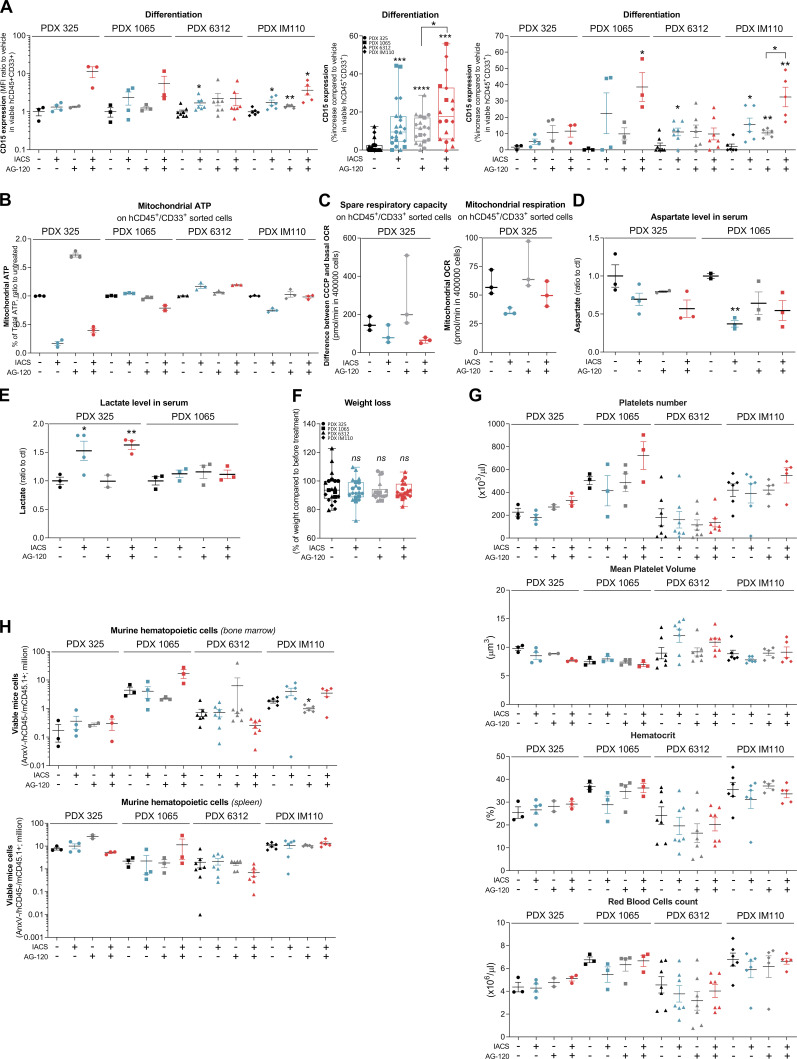
Mutations in IDH induce epigenetic and transcriptional reprogramming, differentiation bias, and susceptibility to mitochondrial inhibitors in cancer cells. Here, we first show that cell lines, PDXs, and patients with acute myeloid leukemia (AML) harboring an IDH mutation displayed an enhanced mitochondrial oxidative metabolism. Along with an increase in TCA cycle intermediates, this AML-specific metabolic behavior mechanistically occurred through the increase in electron transport chain complex I activity, mitochondrial respiration, and methylation-driven CEBPα-induced fatty acid β-oxidation of IDH1 mutant cells. While IDH1 mutant inhibitor reduced 2-HG oncometabolite and CEBPα methylation, it failed to reverse FAO and OxPHOS. These mitochondrial activities were maintained through the inhibition of Akt and enhanced activation of peroxisome proliferator-activated receptor-γ coactivator-1 PGC1α upon IDH1 mutant inhibitor. Accordingly, OxPHOS inhibitors improved anti-AML efficacy of IDH mutant inhibitors in vivo. This work provides a scientific rationale for combinatory mitochondrial-targeted therapies to treat IDH mutant AML patients, especially those unresponsive to or relapsing from IDH mutant inhibitors.


Conflict of interest statement

Disclosures: B. Nicolay reported "other" from Agios Pharmaceuticals outside the submitted work and is an employee and shareholder of Agios Pharmaceuticals. J.R. Marszalek reported a patent to IACS-010759 issued. K. Takahashi reported personal fees from Celgene during the conduct of the study; and personal fees from Symbio Pharmaceuticals, GSK, and Novartis outside the submitted work. C.D. DiNardo reported personal fees from Agios Pharmaceuticals, Celgene, and AbbVie outside the submitted work. M. Konopleva reported "other" from Amgen, Kisoji, and Reata Pharmaceutical; and grants from AbbVie, Genentech, and Stemline Therapeutics, F. Hoffman La-Roche, Forty Seven, Eli Lilly, Cellectis, Calithera, Ablynx, Agios, Ascentage, Astra Zeneca, Rafael Pharmaceutical, and Sanofi outside the submitted work. In addition, M. Konopleva had a patent to Novartis pending (62/993,166), a patent to Eli Lilly issued, and a patent to Reata Pharmaceutical issued (7,795,305 B2 CDDO). C. Récher reported grants from Celgene, Amgen, Novartis, Jazz, AbbVie, Astellas, MaatPharma, Agios, Daiichi-Sankyo, and Roche; personal fees from Incyte, Macrogenics, Otsuka, Janssen, Pfizer, and Takeda; and non-financial support from Sanofi and Gilead outside the submitted work. No other disclosures were reported.

Figures

None
Graphical abstract
Figure S1.
Figure S1.
IDH1m cells exhibit a higher sensitivity to OxPHOSi and BCL2i due to their enhanced mitochondrial capabilities and OxPHOS activity in AML. (A) 2-HG concentration was determined from fresh HL60 (different clones) and MOLM14 IDH1 WT and R132H cells (left panel). Total lysates of HL60 (different clones) and MOLM14 IDH1 WT and R132H were immunoblotted with the corresponding antibodies (right panel; representative of three independent experiments). Error bars indicate mean ± SEM of at least five independent experiments. Each point is the mean of three technical replicates. (B) Doubling time of HL60 (different clones) and MOLM14 IDH1 WT and R132H treated or not with doxycycline (dox). Error bars indicate mean ± SEM of at least three independent experiments. (C) Intensity of CD11b staining (median) HL60 (different clones) and MOLM14 IDH1 WT and R132H treated with doxycycline. Error bars indicate mean ± SEM of at least three independent experiments. (D) Apoptosis induction following 48 h IACS-010759 (100 nM), 48 h metformin (10 mM), AA (10 µM), ATVQ (20 µM), oligomycin (OLIGO; 2 µM), and ABT-199 (200 nM) in other clones of HL60 IDH1 WT (clone 2) or R132H (clone 5). Error bars indicate mean ± SEM of at least three independent experiments. (E) Experimental scheme detailing administration time of IACS-010759 by gavage in MOLM14 CLDX. In this model, IDH1 R132 mutation or IDH1 WT overexpression is induced by doxycycline (left panel). Lactate concentration in the serum of mice engrafted with MOLM14 IDH1 WT and R132H AML cells and treated or not with IACS corresponding to Fig. 1D (right panel). (F) Schematic diagram of the in vivo strategy applied for the experiments described in Fig. 1, Fig. S1, Fig. 4, and Fig. S4. (G) TMRE assay in other clones of HL60 IDH1 WT (clones 2 and 7) or R132H (clone 5) to estimate MMP. Error bars indicate mean ± SEM (n = 3 independent experiments). (H) Mitochondrial OCR in other clones of HL60 IDH1 WT (clones 2 and 7) or R132H (clone 5). Error bars indicate mean ± SEM of at least three independent experiments. Each point is the mean of three technical replicates. (I) ATP-linked respiration of different clones of HL60 and MOLM14 IDH1 WT or R132H measured in vitro (n ≥ 3, independent experiments) and ex vivo in PDXs after cell sorting (three patients IDH1 WT and four patients IDH1 MUT). See also Table S1 for patient information. Error bars indicate mean ± SEM. Each point is the mean of three technical replicates. (J) ECAR of different clones of HL60 and MOLM14 IDH1 WT or R132H measured in vitro (n ≥ 3, independent experiments) and ex vivo in PDXs (three patients IDH1 WT and four patients IDH1 MUT; see also Table S1). Error bars indicate mean ± SEM. Each point is the mean of three technical replicates. (K) Energetic balance corresponding to the ratio between OCR and ECAR of different clones of HL60 and MOLM14 IDH1 WT or R132H measured in vitro (n ≥ 3, independent experiments) and ex vivo in PDXs (three patients IDH1 WT and four patients IDH1 MUT; see also Table S1). Error bars indicate mean ± SEM. Each point is the mean of three technical replicates. (L) Mitochondrial ETC complex II to ETC complex V complex activities in different clones of HL60 (left panel) and MOLM14 (right panel) IDH1 WT and R132H. Error bars indicate mean ± SEM of at least three independent experiments. (M) Mitochondrial ETC complex I activity in other clones of HL60 IDH1 WT (clones 2 and 7) or R132H (clone 5). Error bars indicate mean ± SEM of at least two independent experiments. (N) NADH-producing enzyme activities of MDH and IDH3 in other clones of HL60 IDH1 WT (clone 2) and R132H (clone 5). Error bars indicate mean ± SEM of at least three independent experiments. (O) Mitochondrial mass assay (MTR in cell lines or MTG in PDXs) in different clones of HL60 and MOLM14 IDH1 WT or R132H measured in vitro (n ≥ 4) and ex vivo from PDXs (four patients IDH1 WT and four patients IDH1 MUT). Error bars indicate mean ± SEM. (P) Citrate synthase enzymatic activities measured after 24 h in different clones of HL60 and MOLM14 IDH1 WT or R132H. Error bars indicate mean ± SEM of at least two independent experiments. (Q) Total lysates and lysates of purified mitochondria of different clones of HL60 and MOLM14 IDH1 WT or R132H were immunoblotted with the indicated antibodies related to OxPHOS (left panel) and to assess quality of the mitochondrial (Mito.) extraction (right panel). (R) mtDNA copy numbers in different clones of HL60 and MOLM14 IDH1 WT or R132H. nDNA, nuclear DNA. Error bars indicate mean ± SEM of at least two independent experiments. For each panel, groups were compared with unpaired two-tailed t test with Welch’s correction. *, P < 0.05; **, P < 0.01; ***, P < 0.001; ****, P < 0.0001. BM, bone marrow.
Figure 1.
Figure 1.
IDH1m cells exhibit a higher sensitivity to OxPHOSi and BCL2i due to their enhanced mitochondrial capabilities and OxPHOS activity in AML. (A) Schematic representation of the ETC and BCL2 with OXPHOSi and BCL2i used in this study. Metf, metformin. (B) Plots of effective half-maximal concentration (EC50) values from ATP viability assays of metformin and ABT-263 after 48 h, from Annexin V–positive cell assays of ABT-199 after 24 h and percentage of viable cells after 72 h of IACS-010759 in primary samples with WT or mutant (MUT) IDH1 (red circles) or IDH2 (burgundy circles). See also Table S1 for patient information. (C) Apoptosis induction following IACS-010759 (100 nM during 48 h for HL60 and during 6 d for MOLM14; n = 3), 48 h metformin (10 mM; n = 5), AA (10 µM; n = 3), ATVQ (20 µM for HL60; n = 4 and 40 µM for MOLM14; n = 5), oligomycin (OLIGO; 2 µM; n = 4), and ABT-199 (200 nM; n = 3 for HL60 and n = 4 for MOLM14) in HL60 and MOLM14 IDH1 WT or R132H. (D) Total number of human viable AML cells expressing CD45 in vehicle compared with IACS-treated MOLM14 IDH1 WT and R132 mice in bone marrow and spleen (n = 5/group). (E) Assessment of MMP using TMRE assay in HL60 and MOLM14 IDH1 WT or R132H measured in vitro (n = 5, independent experiments) and in vivo in PDXs (three patients IDH1 WT and four patients IDH1 MUT). See also Table S1 for patient information. (F) Mitochondrial OCR of HL60 and MOLM14 IDH1 WT or R132H measured in vitro (n = 4, independent experiments) and ex vivo in PDXs after cell sorting (three patients IDH1 WT and four patients IDH1 MUT). See also Table S1 for patient information. Each point is the mean of three technical replicates. (G) Mitochondrial ATP in HL60 (n = 4) and MOLM14 (n = 5) IDH1 WT and R132H and in patients with IDH WT (n = 14) or MUT IDH1 (red circles) or IDH2 (burgundy circles; n = 21). See also Table S1 for patient information. Each point is the mean of three technical replicates. (H) Mitochondrial ETC complex I activity in HL60 and MOLM14 IDH1 WT and R132H (n ≥ 4). (I) NADH-producing enzyme activities of MDH (n = 4) and IDH3 (n = 3) in HL60 and MOLM14 IDH1 WT and R132H. (J) Acetyl-CoA (acCoA), succinyl-CoA (succCoA), succinate (succ), fumarate (fum), malate (mal), cis-aconitate (cis-aco), citrate (cit), and α-KG amounts measured over 24-h culture in HL60 and MOLM14 IDH1 WT and R132H (n ≥ 4). Each point is the mean of two technical replicates. For each panel, HL60 IDH1 WT is represented in blue by circles (clone 4), whereas R132H is represented in red by circles (clone 11). Results with other clones are described in Fig. S1. MOLM14 is represented by squares, blue for IDH1 WT and red for IDH1 R132H (both induced by doxycycline). Error bars indicate mean ± SEM of at least three independent experiments. Groups were compared with unpaired two-tailed t test with Welch’s correction. *, P < 0.05; **, P < 0.01; ***, P < 0.001; ****, P < 0.0001.
Figure 2.
Figure 2.
Methylation- and CEBPα-dependent mitochondrial FAO is increased in IDH1m cells. (A) Comparison of the predicted activity of reactions in the metabolic network of HL60 IDH1 WT versus R132H cells. Predictions of reaction activity or inactivity were made using the Recon2 metabolic network reconstruction and transcriptomic data from HL60 IDH1 WT and R132H. Pathway enrichment was performed on the set of reactions identified as specifically active (red) or specifically inactive (blue) in R132H cells. Corrected P values were obtained by performing a hypergeometric test followed by a Bonferroni correction. (B) Visualization of modulated reactions within the FAO pathway of the Recon2 metabolic network. Reactions predicted to be specifically active (red) or inactive (blue) in R132H using the computational modeling approach were mapped using the MetExplore web server (Chazalviel et al., 2018). (C) 14C palmitate oxidation by HL60 IDH1 WT clone 4 (circle; n = 4) and 2 (triangle; n = 2) and R132H clone 11 (circle; n = 4) and 5 (triangle; n = 2) to assessFAO rate. Each point is the mean of two technical replicates. (D) CPT1a gene expression across AML patient samples from BeatAML (Tyner et al., 2018) and GSE14468 (Verhaak cohort) datasets in function of their IDH1 status. Groups were compared using unpaired nonparametric Mann-Whitney test (*, P < 0.05). (E) Normalized ESs following GSEA analysis of patients with high or low expression of CPT1a (median as the reference) in IDH WT, IDH1m, or IDH1+2 mutant across AML transcriptomes from two independent cohorts, BeatAML and Verhaak (GSE14468). (F) Total lysates of HL60 IDH1 WT and R132H (representative of three independent experiments) and total lysates of primary samples IDH1 WT or MUT were immunoblotted with the indicated antibodies. See also Table S1 for patient information. (G) Total lysates (Lysate) and lysates of purified mitochondria (Mito.) of HL60 IDH1 WT and R132H were immunoblotted with the indicated antibodies (representative of two independent experiments). (H) Total lysates of parental HL60 and HL60 IDH1 WT clones 2 and 7 treated with exogenous 2-HG (100 µM) during 24 h, 7 d, and 11 d were immunoblotted with the indicated antibodies (left panel; representative of two independent experiments). CPT1a gene expression in HL60 IDH1 WT clones 2, 4, and 7 treated with exogenous 2-HG (100 µM) during 2 d (Boutzen et al., 2016). (I) qChIP experiments showing the relative recruitment of CEBPα on CPT1a, CPT2, and SLC25A20 locus in mutant IDH1 R132H versus IDH1 WT HL60, as indicated. Results are represented as the relative ratio between the mean value of IP chromatin (calculated as a percentage of the input) with the indicated antibodies and the one obtained with a control irrelevant antibody. HL60 IDH1 WT is represented in blue by circles (clone 4; n = 4) and triangles (clone 2; n = 2), whereas R132H is represented in red by circles (clone 11; n = 4) and triangles (clone 5; n = 2). (J) Total lysates of HL60 IDH1 WT and R132H transfected with siRNA control or targeting CEBPα were immunoblotted to confirm the knockdown and to measure CPT1a protein expression. This confirmation was performed for each siRNA experiment (n = 4). (K) Mitochondrial ETC complex I activity in HL60 IDH1 WT and R132H transfected with siRNA control or targeting CEBPα (n = 4, independent experiments). (L) Mitochondrial OCR and ATP-linked OCR of HL60 IDH1 WT or R132H transfected with siRNA control or targeting CEBPα (n = 4, independent experiments). Each point is the mean of three technical replicates. (M) FAO-coupled OCR of HL60 IDH1 WT or R132H transfected with siRNA control or targeting CEBPα (n ≥ 3, independent experiments). Each point is the mean of three technical replicates. For each panel except D as indicated, groups were compared with unpaired two-tailed t test with Welch’s correction. *, P < 0.05; **, P < 0.01; ****, P < 0.0001. Error bars indicate mean ± SEM. AU, arbitrary units; NES, normalized ES.
Figure S2.
Figure S2.
Methylation- and CEBPα-dependent mitochondrial FAO is increased in IDH1m cells. (A) Schematic representation of FAO and its regulation. (B) GSEA of FAO signature identified by Viale et al. (2014) performed using transcriptomes of HL60 IDH1 R132H clones compared with WT already published (Boutzen et al., 2016) and associated genes with top rank metric scores. (C) CPT1b gene expression across AML patient samples from GSE14468 (Verhaak cohort) and TCGA datasets in function of their IDH1 status. Groups were compared using unpaired nonparametric Mann-Whitney test. (D) Total lysates of MOLM14 IDH1 WT and R132H were immunoblotted with the indicated antibodies (representative of two independent experiments). (E) Total lysates (lysate) and lysates of purified mitochondria (Mito.) of MOLM14 IDH1 WT and R132H were immunoblotted with the indicated antibodies (representative of two independent experiments). (F) Total lysates of parental MOLM14 treated with exogenous 2-HG (50 µM) during 24 h, 7 d, and 11 d were immunoblotted with the indicated antibodies (representative of two independent experiments). (G) Lysates of different clones of HL60 and MOLM14 (left panel) and of AML primary samples (right panel) IDH1 WT or mutant (MUT) were immunoblotted with the indicated antibodies and quantified. (H) AMP/ATP (left panel) and ADP/ATP (right panel) ratios determined by metabolomics in HL60 IDH1 WT (clones 4 and 2) and R132H (clones 11 and 5) and in MOLM14 IDH1 WT and R132H cells. Error bars indicate mean ± SEM of at least three independent experiments. (I) Lysates of different clones of HL60 and MOLM14 IDH1 WT or R132H were immunoblotted with the indicated antibodies and quantified. (J) qChIP experiments showing the relative recruitment of CEBPα on CPT1a, CPT2, and SLC25A20 locus in mutant IDH1 R132H versus IDH1 WT MOLM14, as indicated. Results were represented as the relative ratio between the mean value of IP chromatin (calculated as a percentage of the input) with the indicated antibodies and the one obtained with a control irrelevant antibody. Error bars indicate mean ± SEM of at least three independent experiments. (K) Total lysates of HL60 and MOLM14 IDH1 WT and R132H transfected with shRNA control or targeting CEBPα were immunoblotted to confirm the knockdown and measure CPT1a protein expression. This confirmation was performed for each siRNA experiment (n ≥ 3). (L) Mitochondrial OCR and ATP-linked OCR of HL60 and MOLM14 IDH1 WT or R132H transfected with shRNA control or targeting CEBPα (n ≥ 4, independent experiments). Error bars indicate mean ± SEM. Each point is the mean of three technical replicates. (M) Mitochondrial ETC complex I activity in HL60 and MOLM14 IDH1 WT and R132H transfected with shRNA control or targeting CEBPα. Error bars indicate mean ± SEM of at least two independent experiments for HL60. For MOLM14, only one independent measure was performed. (N) FAO-coupled OCR of HL60 and MOLM14 IDH1 WT or R132H transfected with shRNA control or targeting CEBPα (n ≥ 2, independent experiments). Error bars indicate mean ± SEM. Each point is the mean of three technical replicates. (O) ECAR of HL60 and MOLM14 IDH1 WT or R132H transfected with siRNA or shRNA control or targeting CEBPα (n ≥ 4, independent experiments). For each panel, HL60 IDH1 WT is represented in blue by circles (clone 4), up triangles (clone 2), and down triangles (clone 7), whereas R132H is represented in red by circles (clone 11) or up triangles (clone 5). MOLM14 is represented by squares, blue for IDH1 WT and red for IDH1 R132H (both induced by doxycycline). Error bars indicate mean ± SEM. Each point is the mean of three technical replicates. For all panels except C as indicated, groups were compared with unpaired two-tailed t test with Welch’s correction. *, P < 0.05; **, P < 0.01; ***, P < 0.001; ****, P < 0.0001. AU, arbitrary units; CTL, control; dox, doxycycline; FDR, false discovery rate.
Figure 3.
Figure 3.
IDHmi reverse 2-HG production but do not necessarily decrease high OxPHOS phenotype and mitochondrial metabolism. (A) Cumulative cell proliferation through time in MOLM14 and HL60 IDH1 R132H treated with vehicle (DMF) or AG-5198 (2 µM) and vehicle (DMSO) or AG-120 (2 µM; n = 4, independent experiments). (B) 2-HG levels normalized to IS measured over 24-h culture in MOLM14 and HL60 IDH1 R132H following 24-h, 1-wk, or 2-wk treatment with AG-5198 (2 µM, plain symbols) or AG-120 (2 µM, empty symbols; n ≥ 3, independent experiments). (C) qChIP experiments showing the relative recruitment of histone H3 trimethylation at lysine 4 (H3K4me3) on CEBPα promoter in MOLM14 and HL60 IDH1 R132H following 1-wk treatment with AG-5198 (2 µM). Results are represented as the relative ratio between the mean value of IP chromatin (calculated as a percentage of the input) with CEBPα antibody and the one obtained with a control irrelevant antibody, normalized to the untreated condition (n = 3, independent experiments). (D) qChIP experiments showing the relative recruitment of CEBPα on CPT1a, CPT2, and SLC25A20 locus in MOLM14 and HL60 IDH1 R132H following 1-wk treatment with AG-5198 (2 µM). Results are represented as the relative ratio between the mean value of IP chromatin (calculated as a percentage of the input) with the indicated antibodies and the one obtained with a control irrelevant antibody, normalized to the untreated condition. HL60 IDH1 R132H is represented by circles (clone 11; n = 3) and triangles (clone 5; n = 1). (E) Citrate, succinate, malate, and fumarate levels normalized to IS measured over 24-h culture in MOLM14 and HL60 IDH1 R132H following 24-h, 1-wk, or 2-wk treatment with AG-5198 (2 µM, plain symbols) or AG-120 (2 µM, empty symbols; n ≥ 3, independent experiments). (F) Mitochondrial OCR and ATP-linked OCR of MOLM14 and HL60 IDH1 R132H in vehicle (DMF) and after 24-h, 1-wk, or 2-wk treatment with AG-5198 (2 µM; n ≥ 3, independent experiments). (G) GSEA of HighOxPHOS signature (identified by Farge et al., 2017) performed using transcriptomes of patients harboring an IDH mutation included in clinical trials for IDHmi and published (GSE153348) with associated score. (H) Total lysates of MOLM14 and HL60 IDH1 R132H following 1-wk or 2-wk treatment with AG-5198 (2 µM) were immunoblotted with the indicated antibodies relative to mitochondrial regulation. Immunoblot representative of three independent experiments. (I) Bioinformatics analysis of differentially expressed miRNAs following AG-5198 (2 µM) treatment of HL60 and MOLM14 IDH1m cells for 1 wk. The graph is showing the top KEGG pathways of biological function of the targets of all differentially expressed miRNAs between untreated and treated cells. This enrichment pathways analysis utilizes the union of targeted genes by the selected miRNAs before the statistical calculation. For all these analyses, a P value threshold <0.001 was used. The arrow highlights the pathway of interest in this study (PI3K/Akt). (J) Intensities of 5-OH-methylcytosine staining (median) in HL60 IDH1 WT (circle for clone 4, n = 1; up triangle for clone 2, n = 1; and down triangle for clone 7, n = 1) treated with exogenous 2-HG (100 µM) during 3 d and in HL60 IDH1 R132H (circle for clone 11, n = 5; and triangle for clone 5, n = 1) treated 1 wk with AG-120 (2 µM). (K) Total lysates of HL60 IDH1 R132H following 24-h or 1-wk treatment with AG-120 (2 µM) were immunoblotted with the indicated antibodies. (L) Total lysates of MOLM14 and HL60 IDH1 R132H following 24-h, 1-wk, or 2-wk treatment with AG-5198 (2 µM) were immunoblotted with the indicated antibodies relative to signaling proteins and were quantified. Ratio of phosphorylated to total form of Akt was measured to assess the activation of the pathway. (M) Schematic diagram of metabolic reprogramming induced by IDH1 mutation in AML cells and its impact on OxPHOS status through FAO regulation at the steady state and upon treatment with IDHmi. For each panel, groups were compared with unpaired two-tailed t test with Welch’s correction. *, P < 0.05; **, P < 0.01; ***, P < 0.001; ****, P < 0.0001. Error bars indicate mean ± SEM. AU, arbitrary units; CTL, control; FDR, false discovery rate; NES, normalized ES.
Figure S3.
Figure S3.
IDHmi reverse 2-HG production but do not necessarily decrease high OxPHOS phenotype and mitochondrial metabolism. (A) Total lysates of MOLM14 and HL60 IDH1 R132H following 24-h, 1-wk, or 2-wk treatment with AG-5198 (2 µM) were immunoblotted with the indicated antibodies relative to FAO proteins. Total lysates of one primary sample IDH2 MUT before IDH1mi (AG221) and at relapse was immunoblotted with the indicated antibodies. Percentage of blasts determined as CD45dim/SSClow–positive cells and percentage of mitochondrial ATP (mitoATP) are given for both time points. See gating strategy in B and Table S1 for patient information. (B) Gating strategy used to assess the percentage of AML blasts in primary AML specimen TUHIM86 before treatment with IDHmi and at relapse. Human peripheral blood mononuclear cells are gated based on the forward (FSC) and side scatter (SSC). Dead cells are excluded with Annexin V staining. AML blast gate is CD45dim and SSClow. (C) 14C palmitate oxidation by MOLM14 and HL60 IDH1 R132H following 1-wk treatment with AG-5198 (2 µM) to assess FAO rate. Error bars indicate mean ± SEM of three independent experiments. Each point is the mean of three technical replicates. The results are given in mean counts per minute (cpm) and normalized to the untreated condition. (D) Total lysates of MOLM14 and HL60 IDH1 R132H following 24-h, 1-wk, or 2-wk treatment with AG-5198 (2 µM) were immunoblotted with the indicated antibodies relative to ETC proteins (representative of at least three independent experiments). Total lysates of one primary sample IDH2 MUT before IDH1mi (AG221) and at relapse were immunoblotted with the indicated antibodies. (E) Mitochondrial ETC complex activities in different clones of HL60 and MOLM14 IDH1 R132H following 1- or 2-wk treatment with AG-5198 (2 µM, plain circles) or AG-120 (2 µM, empty circles). Error bars indicate mean ± SEM of at least four independent experiments. (F) MMP (TMRE assay) and mitochondrial mass (MTR stain) in viable cells measured in different clones of HL60 and MOLM14 IDH1 R132H following 1 or 2 wk of treatment with AG-5198 (2 µM), respectively. Error bars indicate mean ± SEM of at least three independent experiments. (G) Citrate synthase enzymatic activity measured after 24 h in HL60 and MOLM14 IDH1 R132H following 1- or 2-wk treatment with AG-5198 (2 µM, plain circles) or AG-120 (2 µM, empty circles), respectively. Error bars indicate mean ± SEM of at least four independent experiments. (H) IP of PGC1α was followed by immunoblotting using total phosphoserine antibody (right panel) in HL60 IDH1 R132H following 1-wk treatment with control (DMSO) or AG-120 (2 µM). Immunoblots of the inputs confirmed same amount of proteins loaded in the two conditions (left panel). The arrowheads highlight the bands corresponding to PGC1a. (I) Akt was activated through short mTOR inhibition with rapamycin (4 h, 100 nM) in HL60 IDH1 R132H following 1-wk treatment with AG-120 (2 µM). Corresponding total lysates were immunoblotted with the indicated antibodies. (J) IP of PGC1α was followed by immunoblotting using total phosphoserine antibody (right panel) in HL60 IDH1 R132H following 1-wk treatment with control (DMSO) or AG-120 (2 µM) and treated with rapamycin (4 h, 100 nM). Immunoblots of the inputs confirmed same amount of proteins loaded in the two conditions and activation of Akt with rapamycin (left panel). The arrowheads highlight the bands corresponding to PGC1a. (K) Mitochondrial OCR and ATP-linked OCR of HL60 IDH1 R132H following 1-wk treatment with control (DMSO) or AG-120 (2 µM) and treated with rapamycin (4 h, 100 nM). For each panel, HL60 IDH1 WT is represented in blue by circles (clone 4), up triangles (clone 2), and down triangles (clone 7), whereas R132H is represented in red by circles (clone 11) or up triangle (clone 5). MOLM14 is represented by squares, blue for IDH1 WT and red for IDH1 R132H (both induced by doxycycline). Error bars indicate mean ± SEM of three independent experiments. Each point is the mean of three technical replicates. (L) Total lysates of two different clones of HL60 and MOLM14 IDH1 R132H following 24-h, 1-wk, or 2-wk treatment with AGI-5198 (2 µM) were immunoblotted with the indicated antibodies. For each panel, groups were compared with unpaired two-tailed t test with Welch’s correction. *, P < 0.05; **, P < 0.01. CI, complex I; CII, complex II; CIII, complex III, CIV, complex IV; CV, complex V.
Figure S4.
Figure S4.
Treatment with an OxPHOS inhibitor enhances antileukemic effects of IDHmi in IDH1m primary samples ex vivo and in vivo. (A) Percentage of viable cells measured by flow cytometry (% AnxV neg) of HL60 IDH1 R132H following 1-wk pretreatment with control (DMSO) or AG-120 (2 µM) and treated with increasing concentrations of metformin. Error bars indicate mean ± SEM of at least three independent experiments. (B) Relative colony number (ratio to ctl) assessed in methylcellulose assays after a 6-d incubation of HL60 and MOLM14 IDH1 R132H pretreated 1 wk with control (DMSO) or AG-120 (2 µM) and then treated with IACS or ATVQ. Corresponding representative photographs of colony-formation units stained using MTT assay (10 mg/ml; 2 h, 37°C). The pictures of each well were taken at the same time. The numbers of colonies with ≥20 cells were counted manually under the microscope. (C) CD11b and CD15 intensities staining measured by flow cytometry of the two primary samples AML5 and AML6 after a 17-d and a 27-d incubation with AG-120, respectively. (D) Experimental scheme detailing exhaustive administration times of IACS-010759 and AG-120 by gavages in PDX models of AML. (E) Total number of human viable AML cells expressing CD45 and CD33 in mono or duplet therapies compared with vehicle for each IDH1 R132 PDXs 325, 1065, 6312, and TUH110 in bone marrow and spleen. Fold change (FC) between the mean of each group and the mean of vehicle was calculated. (F) Photos and corresponding spleen size from mice of PDX 325. Photos of the different groups were taken separately to allow direct and quick crushing but with the same ruler and dimensions to allow comparison (left panel). Photo of the pooled BM of the mice of each treatment group of PDX 6312 before cell sorting (right panel). For each panel, groups were compared with unpaired two-tailed t test with Welch’s correction. *, P < 0.05; **, P < 0.01. BM, bone marrow; ctl, control; Tx, treatment.
Figure 4.
Figure 4.
Treatment with an OxPHOS inhibitor enhances antileukemic effects of IDHmi in vivo. (A) Number of colony-forming units following methylcellulose assays in two primary samples after a 17-d (AML6) and a 27-d incubation (AML5) with the indicated treatments. The numbers of colonies with ≥20 cells were counted manually under the microscope. See also Table S1 for patient information. (B) Experimental scheme detailing administration time of IACS-010759 and AG-120 by gavages in PDX models of AML. See also Table S1 for patient information. (C) AG-120 concentration in mice sera of PDXs 325 and 1065. (D) Total number of human viable AML cells expressing CD45 and CD33 in mono or duplet therapies compared with vehicle IDH1 R132 PDXs 325, 1065, 6312, and TUH110 in bone marrow and spleen. Fold change (FC) between the mean of each group and the mean of vehicle was calculated. (E) Intensity of CD15 staining (median) in bone marrow in mono and duplet therapies compared with vehicle-treated IDH1 R132 PDXs 325, 1065, 6312, and TUH110. (F) Aspartate and lactate levels normalized to control group in mice sera of IDH1 R132 PDXs 325 and 1065. For C–F, groups were compared with vehicle (no bracket) or other groups (corresponding brackets) with unpaired two-tailed t test with Welch’s correction. *, P < 0.05; **, P < 0.01; ***, P < 0.001; ****, P < 0.0001. Error bars indicate mean ± SEM. ctl, control.
Figure S5.
Figure S5.
Effect of the combination of OxPHOS inhibitor and IDHmi on differentiation, mitochondrial readouts, mice weight, complete blood count, and murine hematopoietic cells in IDH1m PDXs in vivo. (A) Intensity of CD15 staining (median) in bone marrow in mono and duplet therapies compared with vehicle treated for each IDH1 R132 PDXs 325, 1065, 6312, and TUH110 (left panel). Percentage of CD15-positive cells in bone marrow in mono and duplet therapies compared with vehicle treated for IDH1 R132 PDXs 325, 1065, 6312, and TUH110 (pooled in middle panel and separated in right panel). (B) Percentage of mitochondrial ATP contribution to total ATP after FACS sorting of human viable cells expressing CD45 and CD33 in bone marrow of IDH1 R132H PDXs 325, 1065, 6312, and TUH110 mice treated with mono and duplet therapies compared with vehicle. Error bars indicate mean ± SEM of at least two technical replicates. (C) Spare respiratory capacity and mitochondrial OCR after FACS sorting of human viable cells expressing CD45 and CD33 in bone marrow of IDH1 R132H PDXs 325 treated with mono and duplet therapies compared with vehicle. Error bars indicate mean ± SEM of three technical replicates. (D and E) Aspartate (D) and lactate (E) levels normalized to control group in mice sera of IDH1 R132 PDXs 325 and 1065. (F) Change in body weight of mice during the different treatments of PDXs 325, 1065, 6312, and TUH110 mice compared with vehicle. Error bars indicate mean ± SEM. (G) Change in platelets and red blood cell features during the different treatments of PDXs 325, 1065, 6312, and TUH110 mice compared with vehicle. Errors bar indicate mean ± SEM. (H) Total number of murine viable AML cells expressing CD45.1 in negative CD45 population in mono or duplet therapies compared with vehicle for each IDH1 R132 PDXs 325, 1065, 6312, and TUH110 in bone marrow and spleen. For each panel, PDX 325 is represented by circles, PDX 1065 by squares, PDX 6312 by triangles, and PDX TUH110 by lozenges. Groups were compared with unpaired two-tailed t test with Welch’s correction. *, P < 0.05; **, P < 0.01; ***, P < 0.001; ****, P < 0.0001. ctl, control.

References

    1. Alvarez-Calderon, F., Gregory M.A., Pham-Danis C., DeRyckere D., Stevens B.M., Zaberezhnyy V., Hill A.A., Gemta L., Kumar A., Kumar V., et al. . 2015. Tyrosine kinase inhibition in leukemia induces an altered metabolic state sensitive to mitochondrial perturbations. Clin. Cancer Res. 21:1360–1372. 10.1158/1078-0432.CCR-14-2146 - DOI - PMC - PubMed
    1. Amatangelo, M.D., Quek L., Shih A., Stein E.M., Roshal M., David M.D., Marteyn B., Farnoud N.R., de Botton S., Bernard O.A., et al. . 2017. Enasidenib induces acute myeloid leukemia cell differentiation to promote clinical response. Blood. 130:732–741. 10.1182/blood-2017-04-779447 - DOI - PMC - PubMed
    1. Baccelli, I., Gareau Y., Lehnertz B., Gingras S., Spinella J.-F., Corneau S., Mayotte N., Girard S., Frechette M., Blouin-Chagnon V., et al. . 2019. Mubritinib Targets the Electron Transport Chain Complex I and Reveals the Landscape of OXPHOS Dependency in Acute Myeloid Leukemia. Cancer Cell. 36:84–99.e8. 10.1016/j.ccell.2019.06.003 - DOI - PubMed
    1. Bhalla, K., Hwang B.J., Dewi R.E., Ou L., Twaddel W., Fang H.B., Vafai S.B., Vazquez F., Puigserver P., Boros L., and Girnun G.D.. 2011. PGC1α promotes tumor growth by inducing gene expression programs supporting lipogenesis. Cancer Res. 71:6888–6898. 10.1158/0008-5472.CAN-11-1011 - DOI - PMC - PubMed
    1. Birsoy, K., Wang T., Chen W.W., Freinkman E., Abu-Remaileh M., and Sabatini D.M.. 2015. An Essential Role of the Mitochondrial Electron Transport Chain in Cell Proliferation Is to Enable Aspartate Synthesis. Cell. 162:540–551. 10.1016/j.cell.2015.07.016 - DOI - PMC - PubMed

Publication types

MeSH terms