Fine particulate matter induces airway inflammation by disturbing the balance between Th1/Th2 and regulation of GATA3 and Runx3 expression in BALB/c mice
- PMID: 33760131
- PMCID: PMC7986036
- DOI: 10.3892/mmr.2021.12017
Fine particulate matter induces airway inflammation by disturbing the balance between Th1/Th2 and regulation of GATA3 and Runx3 expression in BALB/c mice
Abstract
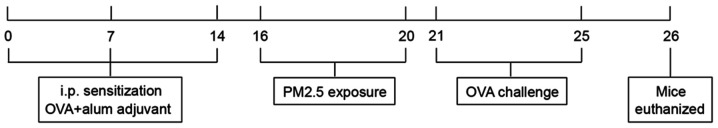
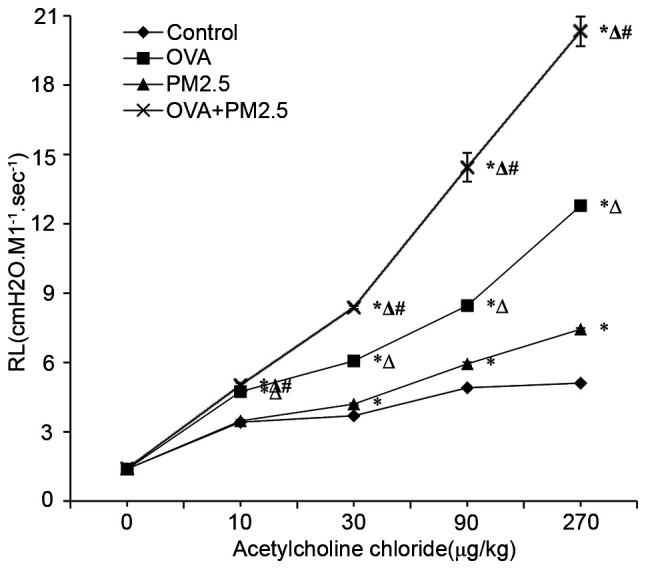
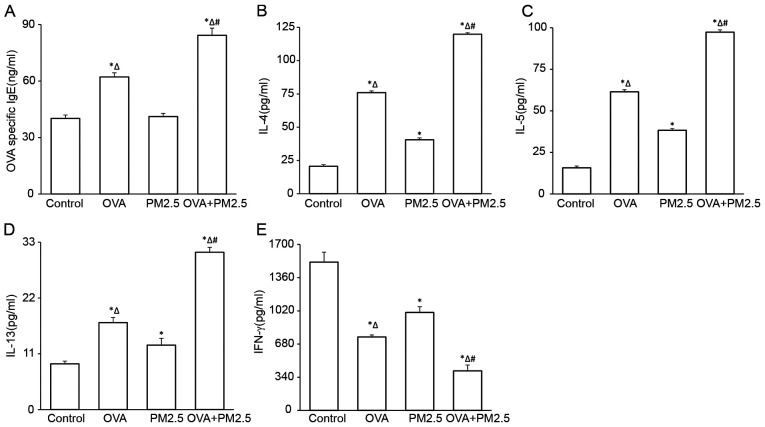
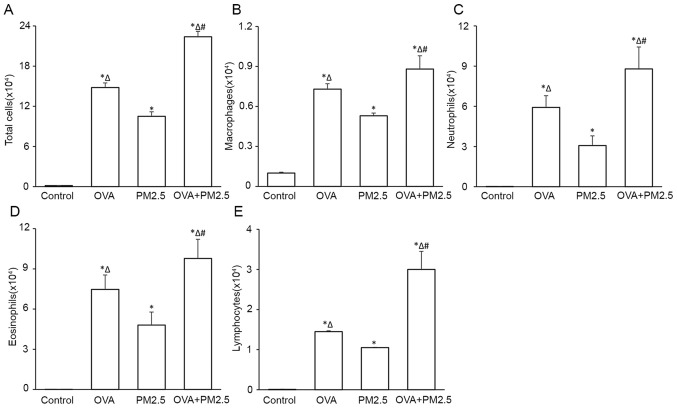
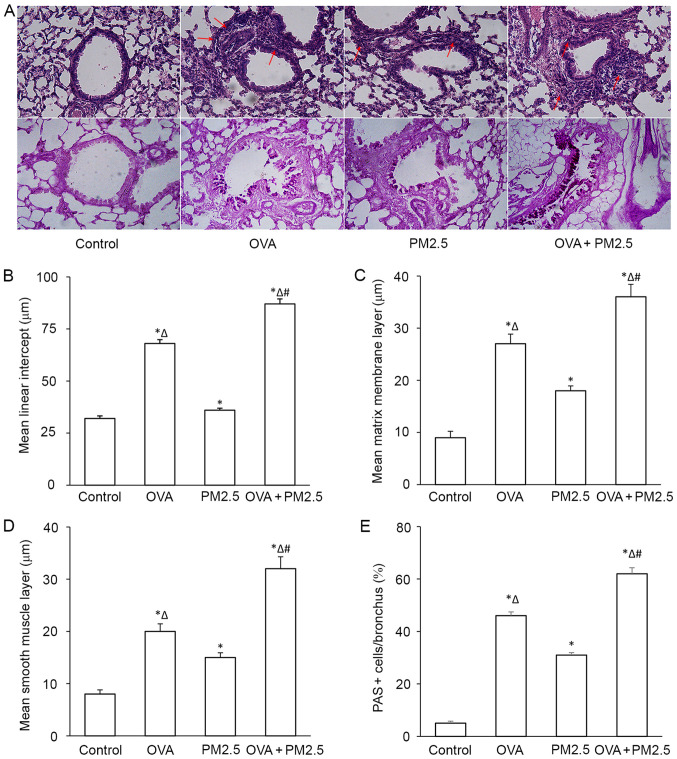
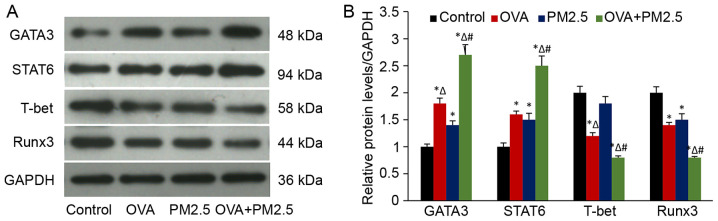
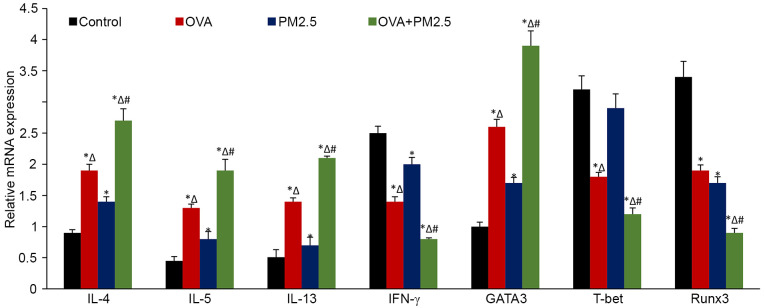
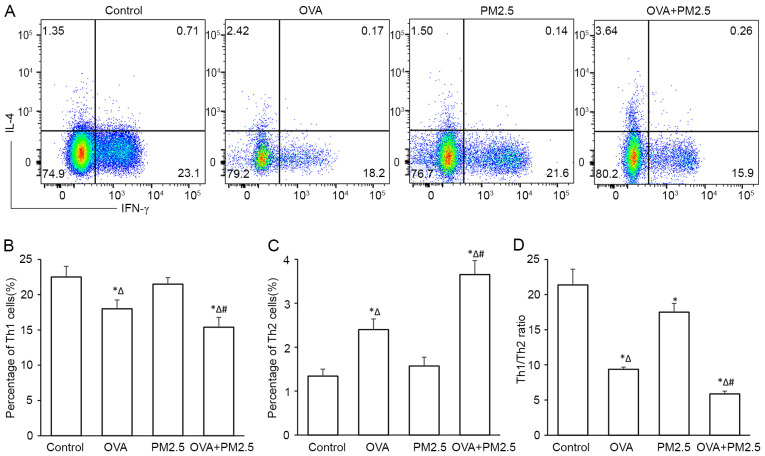
The present study aimed to examine the effects of 2.5 µm particulate matter (PM2.5) on airway inflammation and to investigate the possible underlying mechanism. Specifically, the focus was on the imbalance of T helper (Th)1/Th2 cells and the dysregulated expression of transcription factors, including trans‑acting T cell‑specific transcription factor 3 (GATA3), runt‑related transcription factor 3 (Runx3) and T‑box transcription factor TBX21 (T‑bet). In this study, ambient PM2.5 was collected and analyzed, male BALB/c mice were sensitized and treated with PBS, ovalbumin (OVA), PM2.5 or OVA + PM2.5. The effects of PM2.5 alone or PM2.5 + OVA on immunopathological changes, the expression of transcription factors GATA3, Runx3 and T‑bet, and the imbalance of Th1/Th2 were investigated. It was found that PM2.5 + OVA co‑exposure significantly enhanced inflammatory cell infiltration, increased higher tracheal secretions in lung tissue and upregulated respiratory resistance response to acetylcholine compared with PM2.5 or OVA single exposure and control groups. In addition, higher protein and mRNA expression levels of Th2 inflammatory mediators interleukin (IL)‑4, IL‑5 and IL‑13 in bronchoalveolar lavage fluid were observed in PM2.5 + OVA treated mice, whereas the expression levels of GATA3 and STAT6 were exhibited in mice exposed to OVA + PM2.5 compared with the OVA and PM2.5 groups. By contrast, PM2.5 exposure decreased the protein and mRNA expression levels of Th1 cytokine interferon‑γ and transcription factors Runx3 and T‑bet, especially among asthmatic mice, different from OVA group, PM2.5 exposure only failed to influence the expression of T‑bet. To conclude, PM2.5 exposure evoked the allergic airway inflammation response, especially in the asthmatic mouse model and led to Th1/Th2 imbalance. These effects worked mainly by upregulating GATA3 and downregulating Runx3. These data suggested that Runx3 may play an important role in PM2.5‑aggravated asthma in BALB/c mice.
Keywords: 2.5 µm particulate matter; runt‑related transcription factor 3; trans‑acting T cell‑specific transcription factor GATA‑3; T helper 1/2; asthma.
Conflict of interest statement
The authors declare that they have no competing interests.
Figures
Similar articles
-
T-helper type 1-T-helper type 2 shift and nasal remodeling after fine particulate matter exposure in a rat model of allergic rhinitis.Am J Rhinol Allergy. 2017 May 11;31(3):148-155. doi: 10.2500/ajra.2017.31.4437. Epub 2017 Apr 11. Am J Rhinol Allergy. 2017. PMID: 28401852
-
Immunoregulatory Effects of Paeoniflorin Exerts Anti-asthmatic Effects via Modulation of the Th1/Th2 Equilibrium.Inflammation. 2015 Dec;38(6):2017-25. doi: 10.1007/s10753-015-0182-5. Inflammation. 2015. PMID: 25971794
-
PM2.5 exposure deteriorates Th1/Th2 balance in pediatric asthma by downregulating ALKBH5 and enhancing SRSF1 m6A methylation.Int J Biometeorol. 2025 Mar;69(3):681-694. doi: 10.1007/s00484-024-02848-6. Epub 2025 Jan 2. Int J Biometeorol. 2025. PMID: 39747709
-
An updated view on transcription factor GATA3-mediated regulation of Th1 and Th2 cell differentiation.Int Immunol. 2011 Jul;23(7):415-20. doi: 10.1093/intimm/dxr029. Epub 2011 Jun 1. Int Immunol. 2011. PMID: 21632975 Free PMC article. Review.
-
Linking GATA-3 and interleukin-13: implications in asthma.Inflamm Res. 2014 Apr;63(4):255-65. doi: 10.1007/s00011-013-0700-6. Epub 2013 Dec 22. Inflamm Res. 2014. PMID: 24363163 Review.
Cited by
-
The relationship between PM2.5 and the onset and exacerbation of childhood asthma: a short communication.Front Pediatr. 2023 Aug 1;11:1191852. doi: 10.3389/fped.2023.1191852. eCollection 2023. Front Pediatr. 2023. PMID: 37593445 Free PMC article.
-
Joint Effects of Long-Term Exposure to Ambient Fine Particulate Matter and Ozone on Asthmatic Symptoms: Prospective Cohort Study.JMIR Public Health Surveill. 2023 Aug 3;9:e47403. doi: 10.2196/47403. JMIR Public Health Surveill. 2023. PMID: 37535415 Free PMC article.
-
Nucleus Pulposus Cells from Calcified Discs Promote the Degradation of the Extracellular Matrix through Upregulation of the GATA3 Expression.Curr Med Sci. 2023 Feb;43(1):146-155. doi: 10.1007/s11596-022-2686-1. Epub 2023 Feb 23. Curr Med Sci. 2023. PMID: 36821040
-
Expression levels of RUNX3 and FGFR2 in peripheral blood of severe acute pancreatitis and their clinical significance.Ann Surg Treat Res. 2023 Feb;104(2):90-100. doi: 10.4174/astr.2023.104.2.90. Epub 2023 Jan 31. Ann Surg Treat Res. 2023. PMID: 36816737 Free PMC article.
-
Impact of particulate air pollution on airway injury and epithelial plasticity; underlying mechanisms.Front Immunol. 2024 Mar 8;15:1324552. doi: 10.3389/fimmu.2024.1324552. eCollection 2024. Front Immunol. 2024. PMID: 38524119 Free PMC article. Review.
References
-
- Global Initiative for Asthma (GINA), corp-author GINA; Fontana, WI: 2019. GINA Global strategy for asthma management and prevention.
-
- GBD 2016 Disease and Injury Incidence and Prevalence Collaborators, corp-author. Global, regional, and national incidence, prevalence, and years lived with disability for 328 diseases and injuries for 195 countries, 1990–2016: A systematic analysis for the Global Burden of Disease Study 2016. Lancet. 2017;390:1211–1259. doi: 10.1016/S0140-6736(17)32154-2. - DOI - PMC - PubMed
MeSH terms
Substances
LinkOut - more resources
Full Text Sources
Other Literature Sources
Medical
Research Materials
Miscellaneous