Phosphorylated‑myosin light chain mediates the destruction of small intestinal epithelial tight junctions in mice with acute liver failure
- PMID: 33760163
- PMCID: PMC8008219
- DOI: 10.3892/mmr.2021.12031
Phosphorylated‑myosin light chain mediates the destruction of small intestinal epithelial tight junctions in mice with acute liver failure
Abstract
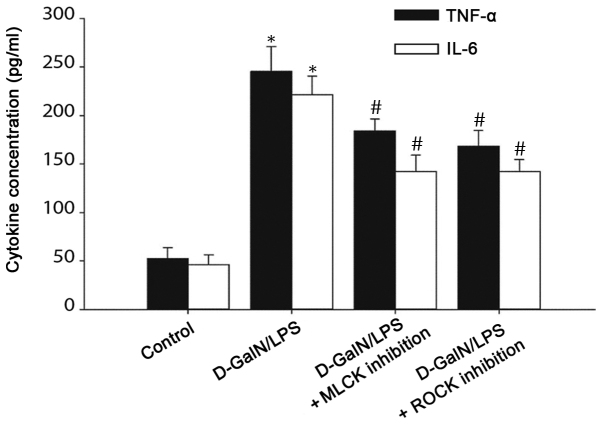
Tight junction dysregulation and epithelial damage contribute to intestinal barrier loss in patients with acute liver failure (ALF); however, the regulatory mechanisms of these processes remain poorly understood. The aim of the present study was to investigate the changes of intestinal tight junction and intestinal mucosa in mice with ALF and their mechanisms. In the present study, ALF was induced in mice through an intraperitoneal injection of D‑galactosamine and lipopolysaccharide (D‑GalN/LPS), and the morphological changes of the liver or small intestine were analyzed using hematoxylin and eosin staining, scanning electron microscopy (SEM) and transmission electron microscopy (TEM). The intestinal tissues and isolated serum were analyzed using western blotting, immunofluorescence staining and ELISA. D‑GalN/LPS‑induced mice exhibited signs of hepatocyte necrosis, alongside inflammatory cell infiltration into the liver tissue and partial microvilli detachment in the small intestinal mucosa. TEM demonstrated that the intestinal epithelial tight junctions were impaired, whereas SEM micrographs revealed the presence of abnormal microvilli in D‑GalN/LPS‑induced mice. In addition, the expression levels of phosphorylated (p)‑myosin light chain (MLC), MLC kinase (MLCK) and Rho‑associated kinase (ROCK) were significantly increased in the D‑GalN/LPS‑induced mice compared with those in the control mice, whereas the subsequent inhibition of MLCK or ROCK significantly reduced p‑MLC expression levels. Conversely, the expression levels of occludin and zonula occludens‑1 (ZO‑1) were significantly decreased in the D‑GalN/LPS‑induced mice, and the inhibition of MLCK or ROCK significantly increased occludin and ZO‑1 protein expression levels compared with those in the control group. Changes in the serum levels of tumor necrosis factor‑α (TNF‑α) and interleukin (IL)‑6 were similar to the trend observed in p‑MLC expression levels. In conclusion, the findings of the present study suggested that in a D‑GalN/LPS‑induced ALF model, TNF‑α and IL‑6 signaling may increase MLCK and ROCK expression levels, further mediate phosphorylation of MLC, which may result in tight junction dysregulation and intestinal barrier dysfunction.
Keywords: myosin light chain; myosin light chain kinase; Rho‑associated kinase.
Conflict of interest statement
The authors declare that they have no competing interests.
Figures


Similar articles
-
Adrenomedullin improves intestinal epithelial barrier function by downregulating myosin light chain phosphorylation in ulcerative colitis rats.Mol Med Rep. 2015 Sep;12(3):3615-3620. doi: 10.3892/mmr.2015.3887. Epub 2015 Jun 3. Mol Med Rep. 2015. PMID: 26043783
-
Myosin light chain kinase mediates intestinal barrier disruption following burn injury.PLoS One. 2012;7(4):e34946. doi: 10.1371/journal.pone.0034946. Epub 2012 Apr 18. PLoS One. 2012. PMID: 22529961 Free PMC article.
-
TNFR2 activates MLCK-dependent tight junction dysregulation to cause apoptosis-mediated barrier loss and experimental colitis.Gastroenterology. 2013 Aug;145(2):407-15. doi: 10.1053/j.gastro.2013.04.011. Epub 2013 Apr 22. Gastroenterology. 2013. PMID: 23619146 Free PMC article.
-
The Regulation of Intestinal Mucosal Barrier by Myosin Light Chain Kinase/Rho Kinases.Int J Mol Sci. 2020 May 18;21(10):3550. doi: 10.3390/ijms21103550. Int J Mol Sci. 2020. PMID: 32443411 Free PMC article. Review.
-
Contributions of Myosin Light Chain Kinase to Regulation of Epithelial Paracellular Permeability and Mucosal Homeostasis.Int J Mol Sci. 2020 Feb 3;21(3):993. doi: 10.3390/ijms21030993. Int J Mol Sci. 2020. PMID: 32028590 Free PMC article. Review.
Cited by
-
Probiotic Properties and Safety Evaluation of Lactobacillus plantarum HY7718 with Superior Storage Stability Isolated from Fermented Squid.Microorganisms. 2023 Sep 8;11(9):2254. doi: 10.3390/microorganisms11092254. Microorganisms. 2023. PMID: 37764098 Free PMC article.
-
The interventional role and mechanism of total flavonoids in lychee seeds on rats with liver fibrosis.Sci Rep. 2025 Jul 7;15(1):24320. doi: 10.1038/s41598-025-10007-z. Sci Rep. 2025. PMID: 40624122 Free PMC article.
-
Rho-Proteins and Downstream Pathways as Potential Targets in Sepsis and Septic Shock: What Have We Learned from Basic Research.Cells. 2021 Jul 21;10(8):1844. doi: 10.3390/cells10081844. Cells. 2021. PMID: 34440613 Free PMC article. Review.
-
Tumor Necrosis Factor Alpha Effects on the Porcine Intestinal Epithelial Barrier Include Enhanced Expression of TNF Receptor 1.Int J Mol Sci. 2021 Aug 14;22(16):8746. doi: 10.3390/ijms22168746. Int J Mol Sci. 2021. PMID: 34445450 Free PMC article.
References
MeSH terms
Substances
LinkOut - more resources
Full Text Sources
Other Literature Sources