Acute glucose fluctuation promotes RAGE expression via reactive oxygen species‑mediated NF‑κB activation in rat podocytes
- PMID: 33760170
- PMCID: PMC7974412
- DOI: 10.3892/mmr.2021.11969
Acute glucose fluctuation promotes RAGE expression via reactive oxygen species‑mediated NF‑κB activation in rat podocytes
Abstract
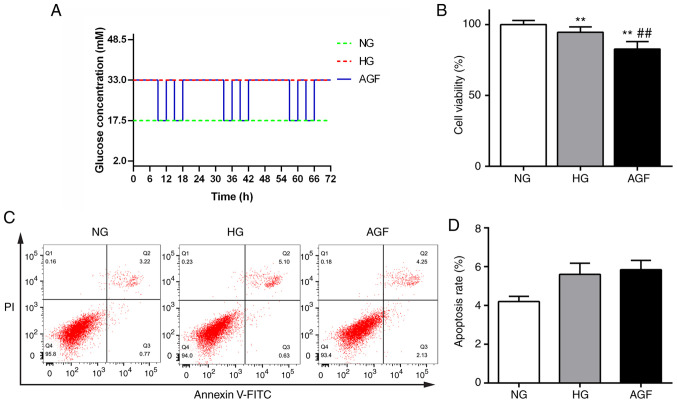
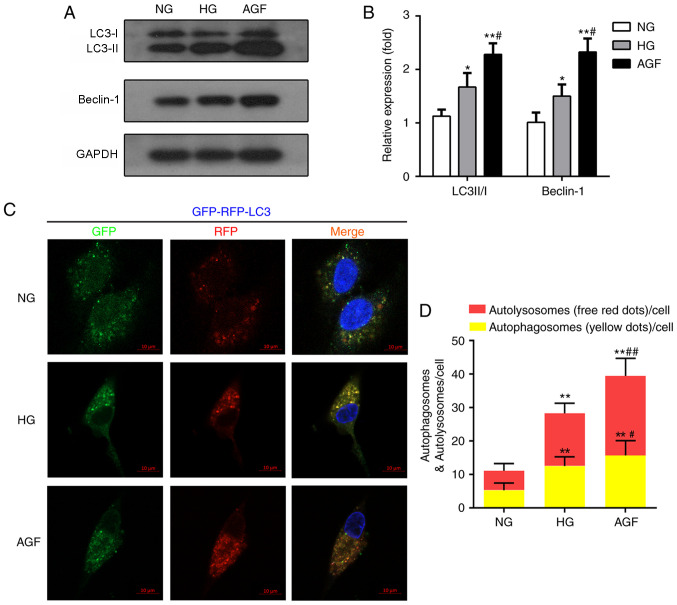
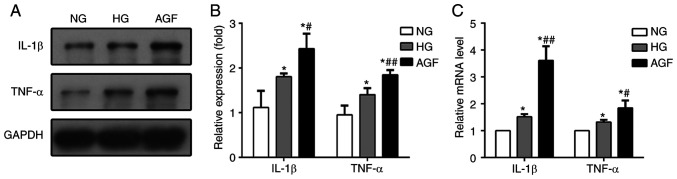
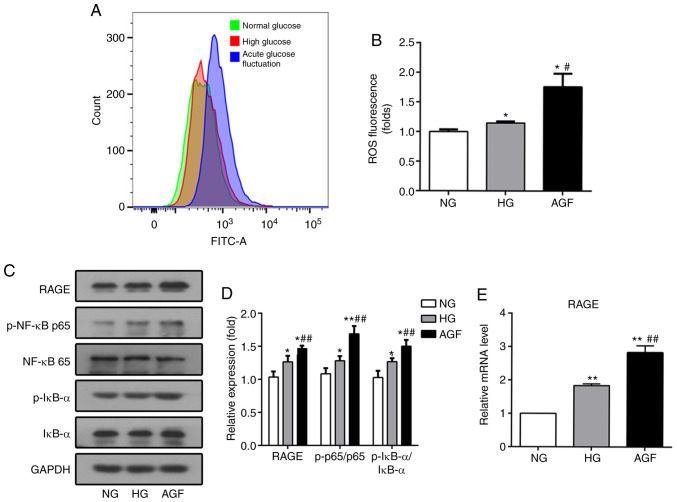
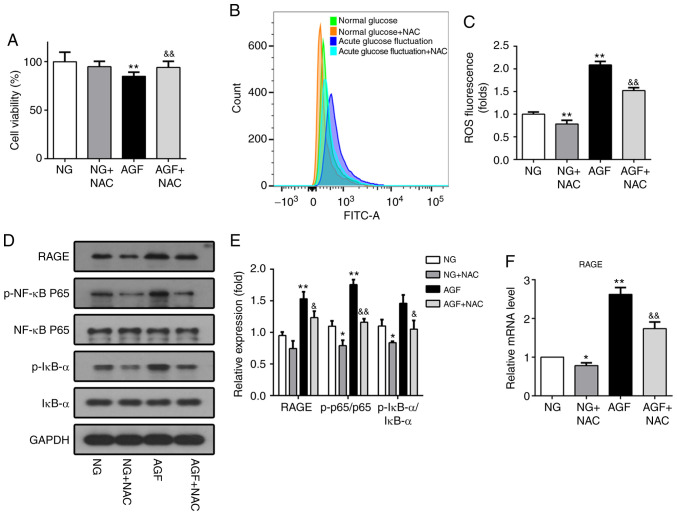
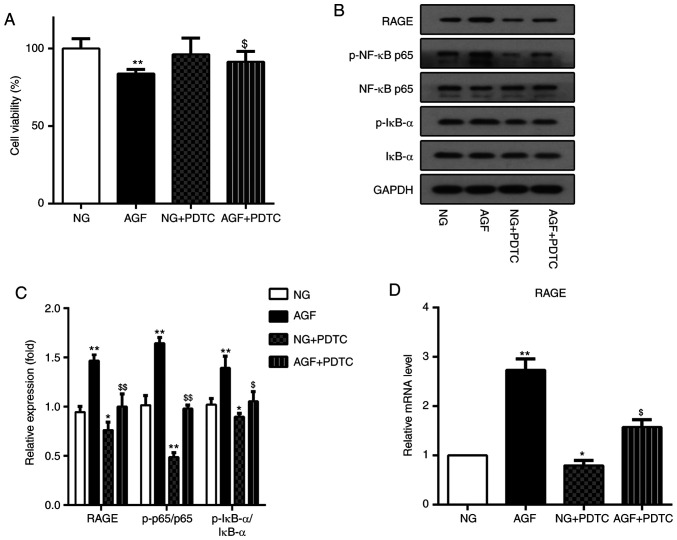
Diabetic nephropathy (DN) is a common chronic complication of diabetes, for which acute glucose fluctuation (AGF) is a potential risk factor. Fluctuating hyperglycemia has been confirmed to induce more serious kidney damage than hyperglycemia in diabetic rats; however, the mechanism remains unknown. The purpose of this study was to explore the potential role of AGF in the progression of DN. Viability of rat podocytes following 72‑h AGF treatment was detected using Cell Counting‑Kit‑8. The rates of apoptosis and the level of reactive oxygen species (ROS) in rat podocytes were assessed by flow cytometry. Western blotting and reverse transcription‑quantitative PCR were performed to measure relative protein and mRNA expression levels, respectively. Transfection with an mRFP‑GFP‑LC3 adenoviral vector was used to track autophagic flux under confocal microscopy. The results indicated that AGF could inhibit cell proliferation, promote TNF‑α, interleukin‑1β (IL‑1β), and reactive oxygen species (ROS) generation, and increase autophagy in rat podocytes. Moreover, AGF upregulated receptor for advanced glycation end products (RAGE) expression via activation of NF‑κB/p65 and IκBα. Pretreatment with 5 mM N‑Acetyl‑L‑cysteine or 10 µM pyrrolidine dithiocarbamate effectively reduced cellular damage and inhibited activation of the NF‑κB/RAGE signaling pathway. Thus, AGF induces rat podocyte injury by aggravating oxidative stress, promoting the inflammatory response, and regulating ROS‑mediated NF‑κB/RAGE activation.
Keywords: diabetes; acute glucose fluctuation; diabetic nephropathy; autophagy; RAGE; oxidative stress.
Conflict of interest statement
The authors declare that they have no competing interests.
Figures
Similar articles
-
RAGE-Aptamer Blocks the Development and Progression of Experimental Diabetic Nephropathy.Diabetes. 2017 Jun;66(6):1683-1695. doi: 10.2337/db16-1281. Epub 2017 Apr 6. Diabetes. 2017. PMID: 28385802
-
Molecular Pathways Involved in the Amelioration of Myocardial Injury in Diabetic Rats by Kaempferol.Int J Mol Sci. 2017 May 15;18(5):1001. doi: 10.3390/ijms18051001. Int J Mol Sci. 2017. PMID: 28505121 Free PMC article.
-
Loganin and catalpol exert cooperative ameliorating effects on podocyte apoptosis upon diabetic nephropathy by targeting AGEs-RAGE signaling.Life Sci. 2020 Jul 1;252:117653. doi: 10.1016/j.lfs.2020.117653. Epub 2020 Apr 8. Life Sci. 2020. PMID: 32277978
-
AGE/RAGE signaling-mediated endoplasmic reticulum stress and future prospects in non-coding RNA therapeutics for diabetic nephropathy.Biomed Pharmacother. 2020 Nov;131:110655. doi: 10.1016/j.biopha.2020.110655. Epub 2020 Aug 24. Biomed Pharmacother. 2020. PMID: 32853909 Review.
-
Linking RAGE and Nox in diabetic micro- and macrovascular complications.Diabetes Metab. 2015 Sep;41(4):272-281. doi: 10.1016/j.diabet.2015.01.006. Epub 2015 Aug 29. Diabetes Metab. 2015. PMID: 26323666 Review.
Cited by
-
Quantitative Assessment of Intracellular Effectors and Cellular Response in RAGE Activation.Arch Intern Med Res. 2024;7(2):80-103. doi: 10.26502/aimr.0168. Epub 2024 Apr 26. Arch Intern Med Res. 2024. PMID: 38784044 Free PMC article.
-
Serum Cytokines and Growth Factors in Subjects with Type 1 Diabetes: Associations with Time in Ranges and Glucose Variability.Biomedicines. 2023 Oct 19;11(10):2843. doi: 10.3390/biomedicines11102843. Biomedicines. 2023. PMID: 37893217 Free PMC article.
-
Curcumin Antagonizes Glucose Fluctuation-Induced Renal Injury by Inhibiting Aerobic Glycolysis via the miR-489/LDHA Pathway.Mediators Inflamm. 2021 Aug 18;2021:6104529. doi: 10.1155/2021/6104529. eCollection 2021. Mediators Inflamm. 2021. PMID: 34456629 Free PMC article.
-
Global research trends and hot spots on autophagy and kidney diseases: a bibliometric analysis from 2000 to 2022.Front Pharmacol. 2023 Nov 30;14:1275792. doi: 10.3389/fphar.2023.1275792. eCollection 2023. Front Pharmacol. 2023. PMID: 38099142 Free PMC article. Review.
-
Serum Metabolomics Reveals a Potential Benefit of Methionine in Type 1 Diabetes Patients with Poor Glycemic Control and High Glycemic Variability.Nutrients. 2023 Jan 19;15(3):518. doi: 10.3390/nu15030518. Nutrients. 2023. PMID: 36771224 Free PMC article.
References
MeSH terms
Substances
LinkOut - more resources
Full Text Sources
Other Literature Sources
Medical