. 2021 Mar;1(3):e48.
doi: 10.1002/cpz1.48.

Imaging Spontaneous Neuronal Activity with Voltage-Sensitive Dyes

Affiliations

Imaging Spontaneous Neuronal Activity with Voltage-Sensitive Dyes

Benjamin K Raliski et al. Curr Protoc. 2021 Mar.

Erratum in

Abstract

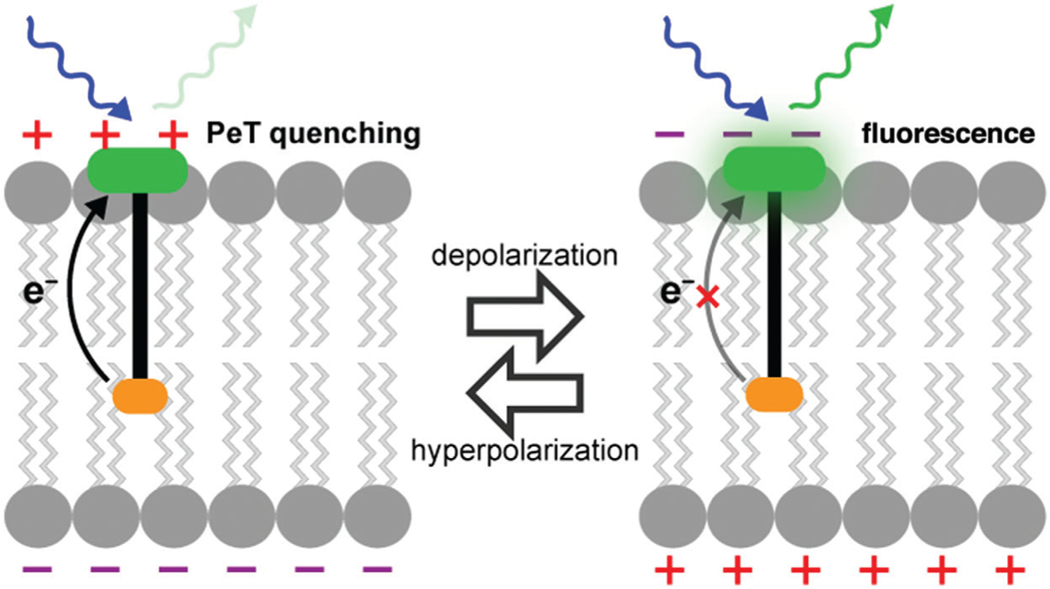
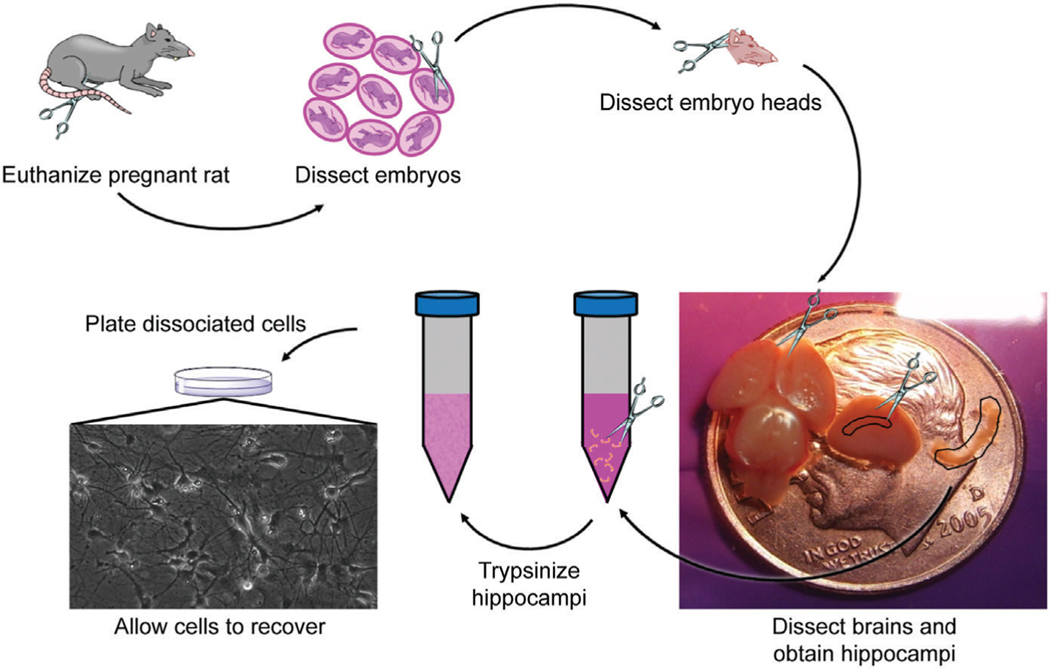
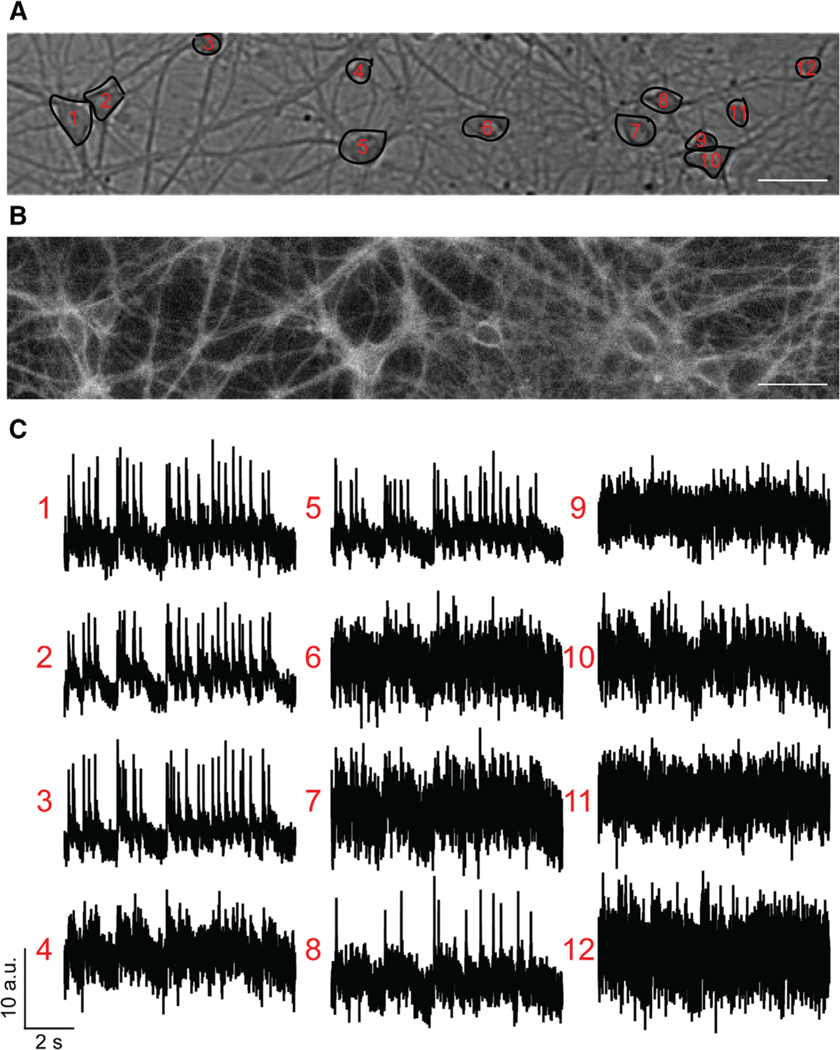
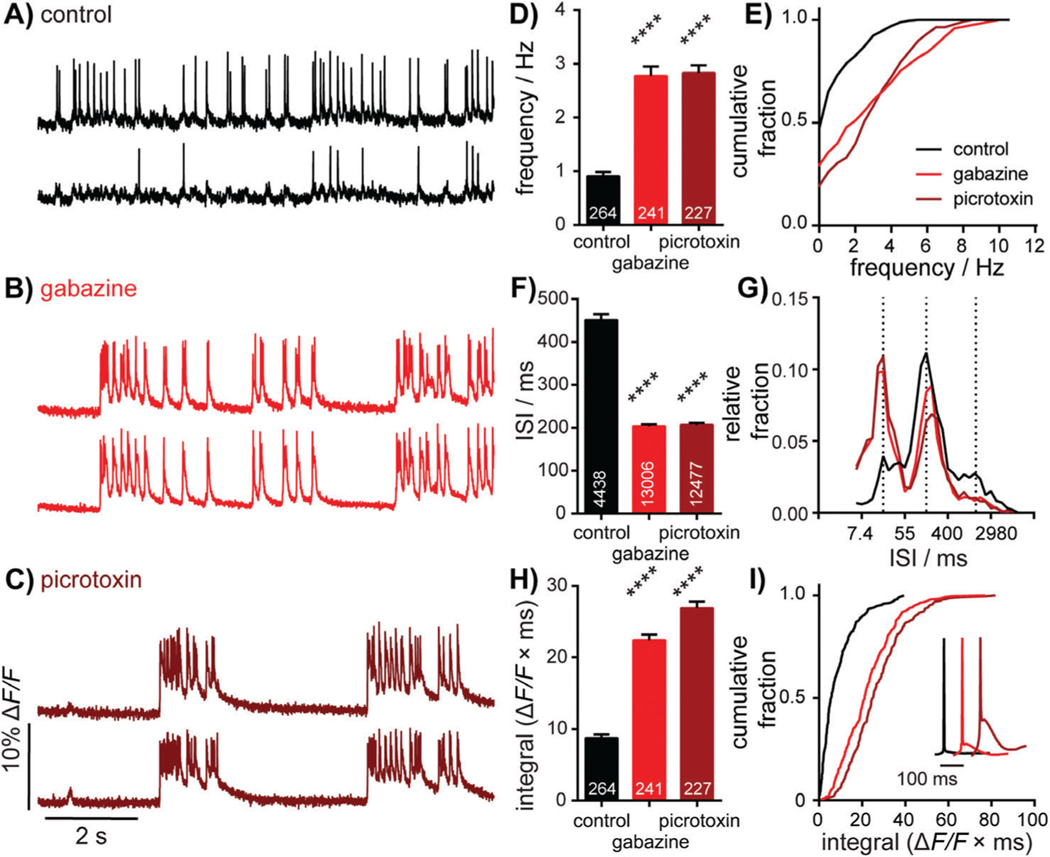
Accurately mapping changes in cellular membrane potential across large groups of neurons is crucial for understanding the organization and maintenance of neural circuits. Measuring cellular voltage changes by optical means allows greater spatial resolution than traditional electrophysiology methods and is adaptable to high-throughput imaging experiments. VoltageFluors, a class of voltage-sensitive dyes, have recently been used to optically study the spontaneous activity of many neurons simultaneously in dissociated culture. VoltageFluors are particularly useful for experiments investigating differences in excitability and connectivity between neurons at different stages of development and in different disease models. The protocols in this article describe general procedures for preparing dissociated cultures, imaging spontaneous activity in dissociated cultures with VoltageFluors, and analyzing optical spontaneous activity data. © 2021 Wiley Periodicals LLC. Basic Protocol 1: Preparation of dissociated rat hippocampal or cortical cultures Alternate Protocol: Preparation of microisland dissociated cultures Basic Protocol 2: Imaging of spontaneous activity in dissociated cultures using voltage-sensitive dyes Basic Protocol 3: Analysis of spontaneous activity imaging data.

Keywords: SpikeConnect; VoltageFluor; dissociated culture; imaging; spontaneous activity.


Figures

Figure 1
Figure 1
Schematic depicting the mechanism of action of VoltageFluor dyes. Adapted from Miller (2016).
Figure 2
Figure 2
Workflow for preparing dissociated rat hippocampal cultures, with an example of a healthy culture plated at a density of 30,000/well.
Figure 3
Figure 3
Schematic of patterned microislands. Dimensions of each microisland (small rectangles) are ~120 μm × 650 μm, and rectangles are spaced ~220 μm apart horizontally and 370 μm apart vertically. The circle in the upper right allows the user to identify microislands for post-hoc immunostaining after functional imaging.
Figure 4
Figure 4
Voltage imaging with BeRST 1. (A) Example brightfield image with selected regions of interest (ROIs). (B) Example fluorescence image from the same field of view (FOV). (C) Raw fluorescence traces from the selected ROIs. These traces will be analyzed by SpikeConnect in Basic Protocol 3. Scale bar, 10 μm.
Figure 5
Figure 5
Characterization of neuronal responses to pharmacological manipulation. Representative ΔF/F voltage imaging traces of spontaneous spiking activity measured by BeRST 1 in hippocampal neurons under control conditions (A) or following acute administration of 10 μM gabazine (B) or 50 μM picrotoxin (C).Traces are of two neurons from the same acquisition. Summarized data show plots of frequency (D and E), inter-spike interval (ISI; F and G), and integrated area (H and I) for spontaneously active neurons following acute treatment with gabazine or picrotoxin compared to sister control neurons. Data are represented as bar plots (D, F, and H), cumulative frequency plots (E and I), or relative frequency distribution of ISI data (G). Insets in I show mean traces scaled for amplitude. Biological n is 3 for gabazine and picrotoxin treatments. Values indicated on bar graphs in D and H the indicate number of individual neurons used to determine frequency (D) and integrated area (H). Values on bar graph in F indicate the number of pairs of consecutive action potentials used to determine ISI. Statistical tests are Kruskal-Wallis ANOVAs with multiple-comparisons tests to control data. ****p < 0.0001. Figure adapted from Walker, Raliski, & Karbasi, et al. (2020).

References

    1. Abdelfattah AS, Kawashima T, Singh A, Novak O, Liu H, Shuai Y, … Schreiter ER (2019). Bright and photostable chemigenetic indicators for extended in vivo voltage imaging. Science, 365, 699–704. doi: 10.1126/science.aav6416. - DOI - PubMed
    1. Audesirk G, Audesirk T, & Ferguson C. (2001). Culturing rat hippocampal neurons. Current Protocols in Toxicology, 1–17. doi: 10.1002/0471140856.tx1203s04. - DOI - PubMed
    1. Fluhler E, Burnham VG, & Loew LM (1985). Spectra, membrane binding, and potentiometric responses of new charge shift probes. Biochemistry, 24(21), 5749–5755. doi: 10.1021/bi00342a010. - DOI - PubMed
    1. González JE, & Tsien RY (1995). Voltage sensing by fluorescence resonance energy transfer in single cells. Biophysical Journal, 69(4), 1272–1280. doi: 10.1016/S0006-3495(95)80029-9. - DOI - PMC - PubMed
    1. Huang YL, Walker AS, & Miller EW (2015). A photostable silicon rhodamine platform for optical voltage sensing. Journal of the American Chemical Society, 137, 10767–10776. doi: 10.1021/jacs.5b06644. - DOI - PMC - PubMed

Substances