

Visceral Adipose Tissue Phospholipid Signature of Insulin Sensitivity and Obesity
- PMID: 33760621
- PMCID: PMC8631729
- DOI: 10.1021/acs.jproteome.0c00918
Visceral Adipose Tissue Phospholipid Signature of Insulin Sensitivity and Obesity
Abstract
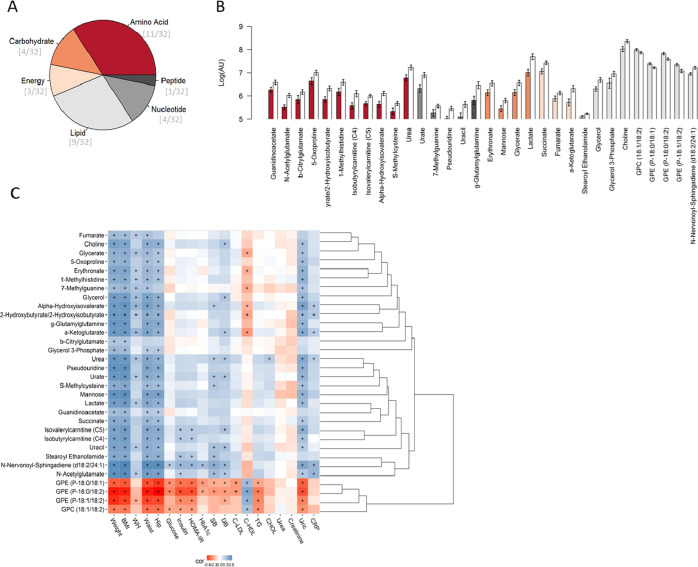
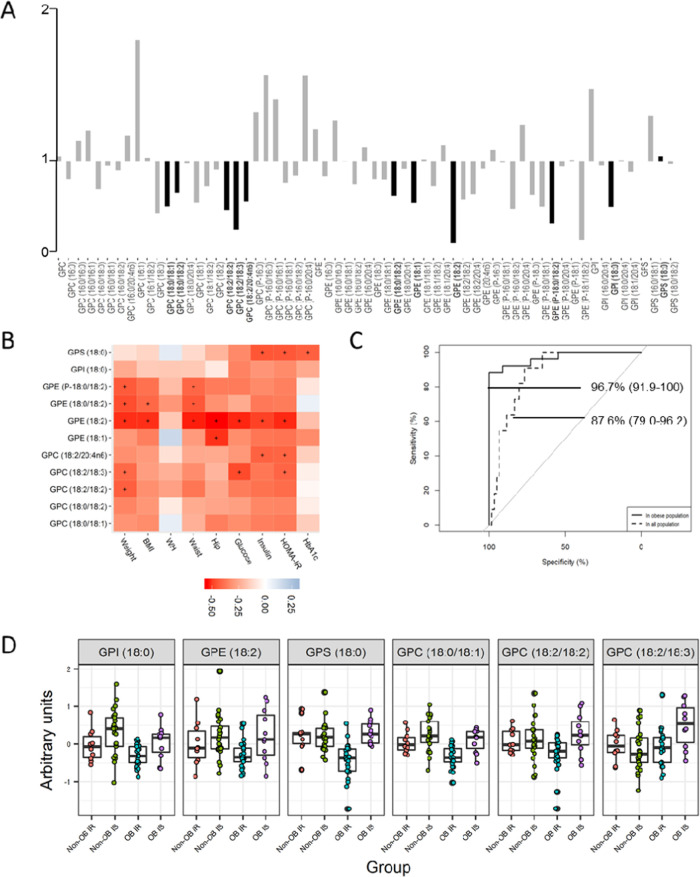
Alterations in visceral adipose tissue (VAT) are closely linked to cardiometabolic abnormalities. The aim of this work is to define a metabolic signature in VAT of insulin resistance (IR) dependent on, and independent of, obesity. An untargeted UPLC-Q-Exactive metabolomic approach was carried out on the VAT of obese insulin-sensitive (IS) and insulin-resistant subjects (N = 11 and N = 25, respectively) and nonobese IS and IR subjects (N = 25 and N = 10, respectively). The VAT metabolome in obesity was defined among other things by changes in the metabolism of lipids, nucleotides, carbohydrates, and amino acids, whereas when combined with high IR, it affected the metabolism of 18 carbon fatty acyl-containing phospholipid species. A multimetabolite model created by glycerophosphatidylinositol (18:0); glycerophosphatidylethanolamine (18:2); glycerophosphatidylserine (18:0); and glycerophosphatidylcholine (18:0/18:1), (18:2/18:2), and (18:2/18:3) exhibited a highly predictive performance to identify the metabotype of "insulin-sensitive obesity" among obese individuals [area under the curve (AUC) 96.7% (91.9-100)] and within the entire study population [AUC 87.6% (79.0-96.2)]. We demonstrated that IR has a unique and shared metabolic signature dependent on, and independent of, obesity. For it to be used in clinical practice, these findings need to be validated in a more accessible sample, such as blood.
Keywords: biomarker; diabetes; discordant phenotypes; insulin resistance; lipid remodeling; metabolomics; metabotype; obesity; phospholipids.
Conflict of interest statement
The authors declare no competing financial interest.
Figures
Similar articles
-
The epigenetic signature of systemic insulin resistance in obese women.Diabetologia. 2016 Nov;59(11):2393-2405. doi: 10.1007/s00125-016-4074-5. Epub 2016 Aug 18. Diabetologia. 2016. PMID: 27535281 Free PMC article.
-
Alterations of plasma metabolite profiles related to adipose tissue distribution and cardiometabolic risk.Am J Physiol Endocrinol Metab. 2015 Oct 15;309(8):E736-46. doi: 10.1152/ajpendo.00231.2015. Epub 2015 Aug 25. Am J Physiol Endocrinol Metab. 2015. PMID: 26306599
-
Adipose Cell Size and Regional Fat Deposition as Predictors of Metabolic Response to Overfeeding in Insulin-Resistant and Insulin-Sensitive Humans.Diabetes. 2016 May;65(5):1245-54. doi: 10.2337/db15-1213. Epub 2016 Feb 16. Diabetes. 2016. PMID: 26884438 Free PMC article.
-
Visceral adiposity and inflammatory bowel disease.Int J Colorectal Dis. 2021 Nov;36(11):2305-2319. doi: 10.1007/s00384-021-03968-w. Epub 2021 Jun 9. Int J Colorectal Dis. 2021. PMID: 34104989 Review.
-
Visceral obesity, impaired glucose tolerance, metabolic syndrome, and growth hormone therapy.Growth Horm IGF Res. 2006 Jul;16 Suppl A:S62-7. doi: 10.1016/j.ghir.2006.03.004. Epub 2006 Apr 18. Growth Horm IGF Res. 2006. PMID: 16624603 Review.
Cited by
-
Metabolomic Profiling of Adipose Tissue in Type 2 Diabetes: Associations with Obesity and Insulin Resistance.Metabolites. 2024 Jul 26;14(8):411. doi: 10.3390/metabo14080411. Metabolites. 2024. PMID: 39195507 Free PMC article.
-
Untargeted metabolomics reveals that declined PE and PC in obesity may be associated with prostate hyperplasia.PLoS One. 2024 Apr 19;19(4):e0301011. doi: 10.1371/journal.pone.0301011. eCollection 2024. PLoS One. 2024. PMID: 38640132 Free PMC article.
-
Association between skeletal muscle mass to visceral fat area ratio and insulin resistance in type 2 diabetes.J Diabetes Metab Disord. 2025 Jun 11;24(2):148. doi: 10.1007/s40200-025-01644-2. eCollection 2025 Dec. J Diabetes Metab Disord. 2025. PMID: 40520240
-
Insulin resistance and inflammation mediate the association of abdominal obesity with colorectal cancer risk.Front Endocrinol (Lausanne). 2022 Nov 3;13:983160. doi: 10.3389/fendo.2022.983160. eCollection 2022. Front Endocrinol (Lausanne). 2022. PMID: 36407320 Free PMC article.
-
Unraveling the complexities of diet induced obesity and glucolipid dysfunction in metabolic syndrome.Diabetol Metab Syndr. 2025 Jul 22;17(1):292. doi: 10.1186/s13098-025-01837-y. Diabetol Metab Syndr. 2025. PMID: 40696355 Free PMC article. Review.
References
-
- Liesenfeld D. B.; Grapov D.; Fahrmann J. F.; Salou M.; Scherer D.; Toth R.; Habermann N.; Bohm J.; Schrotz-King P.; Gigic B.; Schneider M.; Ulrich A.; Herpel E.; Schirmacher P.; Fiehn O.; Lampe J. W.; Ulrich C. M. Metabolomics and Transcriptomics Identify Pathway Differences between Visceral and Subcutaneous Adipose Tissue in Colorectal Cancer Patients: The ColoCare Study. Am. J. Clin. Nutr. 2015, 102, 433–443. 10.3945/ajcn.114.103804. - DOI - PMC - PubMed
Publication types
MeSH terms
Substances
LinkOut - more resources
Full Text Sources
Other Literature Sources
