

Glucodensities: A new representation of glucose profiles using distributional data analysis
- PMID: 33760665
- PMCID: PMC8189016
- DOI: 10.1177/0962280221998064
Glucodensities: A new representation of glucose profiles using distributional data analysis
Abstract
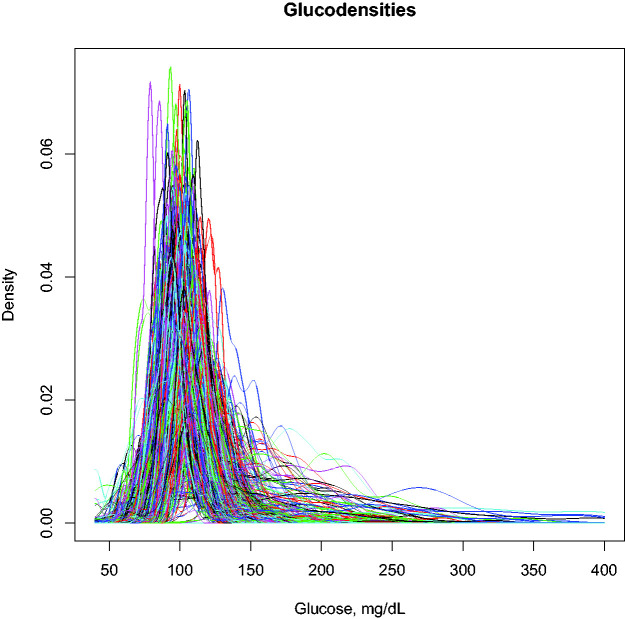
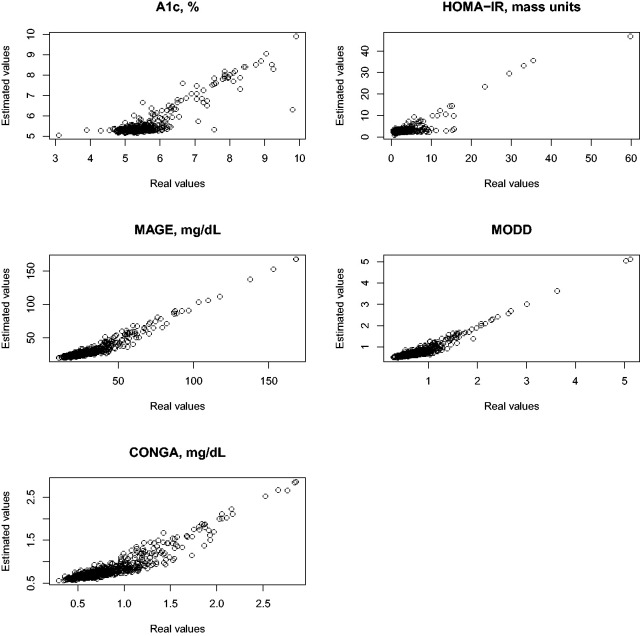
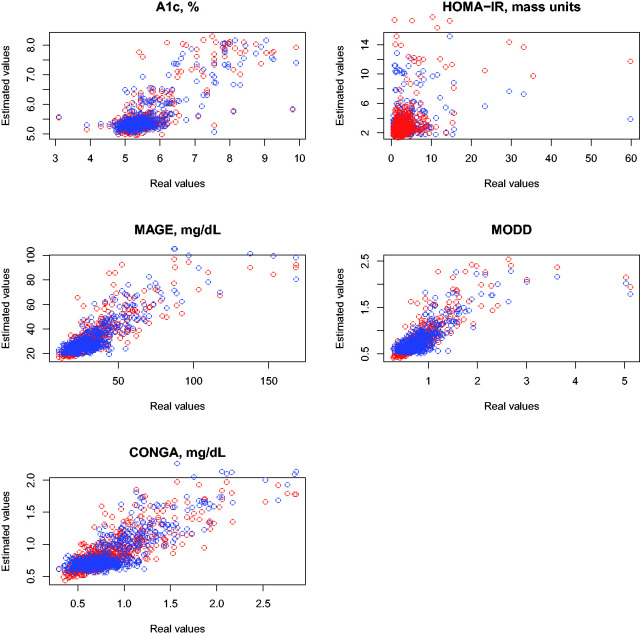
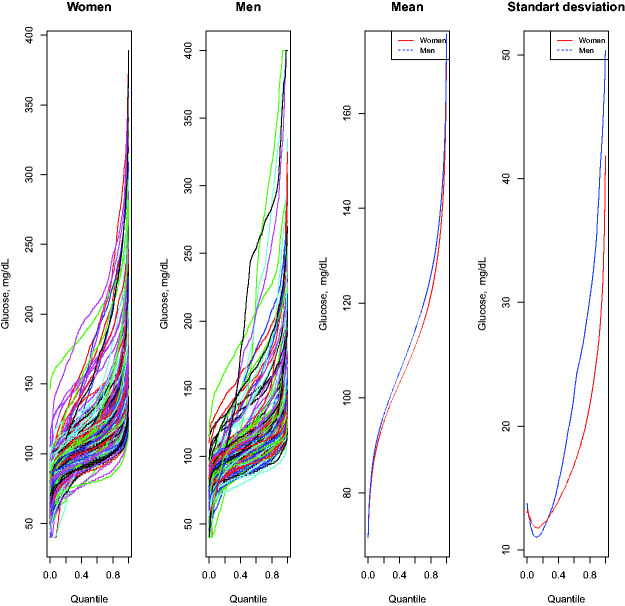
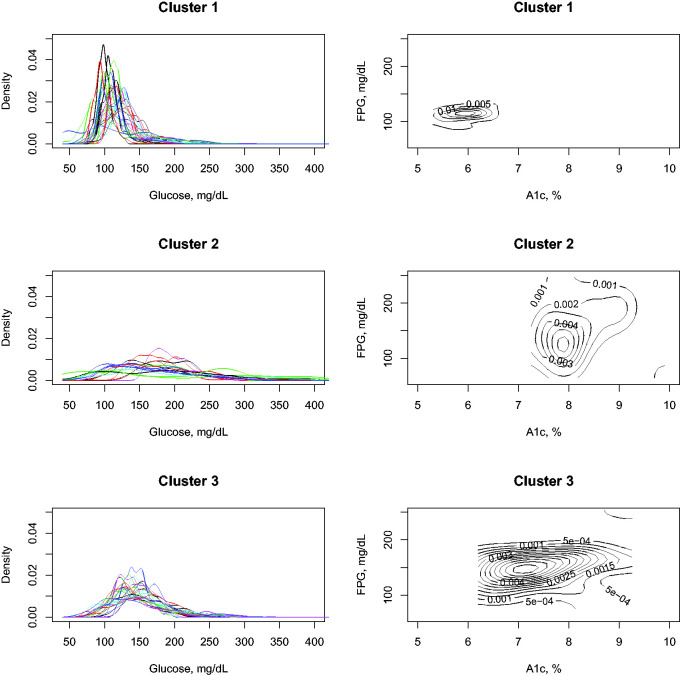
Biosensor data have the potential to improve disease control and detection. However, the analysis of these data under free-living conditions is not feasible with current statistical techniques. To address this challenge, we introduce a new functional representation of biosensor data, termed the glucodensity, together with a data analysis framework based on distances between them. The new data analysis procedure is illustrated through an application in diabetes with continuous-time glucose monitoring (CGM) data. In this domain, we show marked improvement with respect to state-of-the-art analysis methods. In particular, our findings demonstrate that (i) the glucodensity possesses an extraordinary clinical sensitivity to capture the typical biomarkers used in the standard clinical practice in diabetes; (ii) previous biomarkers cannot accurately predict glucodensity, so that the latter is a richer source of information and; (iii) the glucodensity is a natural generalization of the time in range metric, this being the gold standard in the handling of CGM data. Furthermore, the new method overcomes many of the drawbacks of time in range metrics and provides more in-depth insight into assessing glucose metabolism.
Keywords: CGM technology; biosensor data; diabetes; distributional data analysis.
Conflict of interest statement
Figures
References
-
- Ewings SM, Sahu SK, Valletta JJ, et al.. A Bayesian network for modelling blood glucose concentration and exercise in type 1 diabetes. Stat Meth Med Res 2015; 24: 342–372. - PubMed
-
- Zaccardi F, Khunti K. Glucose dysregulation phenotypes – time to improve outcomes. Nature Rev Endocrinol 2018; 14: 632–633. - PubMed
-
- Selvin E, Crainiceanu CM, Brancati FL, et al.. Short-term variability in measures of glycemia and implications for the classification of diabetes. Arch Intern Med 2007; 167: 1545–1551. - PubMed
-
- Group BAW. Need for regulatory change to incorporate beyond A1c glycemic metrics. Diabetes Care 2018; 41: e92–e94. - PubMed
Publication types
MeSH terms
Substances
LinkOut - more resources
Full Text Sources
Other Literature Sources
Medical
