. 2021 Mar 24;16(3):e0247795.
doi: 10.1371/journal.pone.0247795. eCollection 2021.

The sociospatial factors of death: Analyzing effects of geospatially-distributed variables in a Bayesian mortality model for Hong Kong

Affiliations

The sociospatial factors of death: Analyzing effects of geospatially-distributed variables in a Bayesian mortality model for Hong Kong

Thayer Alshaabi et al. PLoS One. .

Abstract

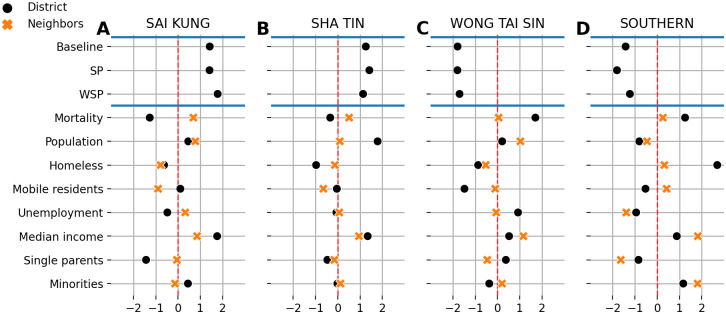
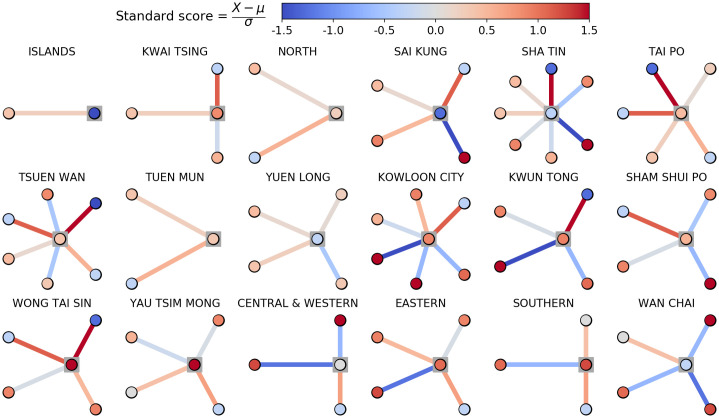
Human mortality is in part a function of multiple socioeconomic factors that differ both spatially and temporally. Adjusting for other covariates, the human lifespan is positively associated with household wealth. However, the extent to which mortality in a geographical region is a function of socioeconomic factors in both that region and its neighbors is unclear. There is also little information on the temporal components of this relationship. Using the districts of Hong Kong over multiple census years as a case study, we demonstrate that there are differences in how wealth indicator variables are associated with longevity in (a) areas that are affluent but neighbored by socially deprived districts versus (b) wealthy areas surrounded by similarly wealthy districts. We also show that the inclusion of spatially-distributed variables reduces uncertainty in mortality rate predictions in each census year when compared with a baseline model. Our results suggest that geographic mortality models should incorporate nonlocal information (e.g., spatial neighbors) to lower the variance of their mortality estimates, and point to a more in-depth analysis of sociospatial spillover effects on mortality rates.


Conflict of interest statement

The authors have read the journal’s policy and have the following competing interests: DRD was a paid employee of Massachusetts Mutual Life Insurance at the time of the study. DRD is currently affiliated with Charles River Analytics Inc. There are no patents, products in development or marketed products associated with this research to declare. This does not alter our adherence to PLOS ONE policies on sharing data and materials.

Figures

Fig 1
Fig 1. A graphical model representing the likelihood function given in Eq 5.
Latent log σt and βt evolve as biased random walks, while ytn and Xtn are treated as observable random variables and exogenous parameters respectively. The entire temporal model is plated across districts N = 18.
Fig 2
Fig 2. Spatial networks of Hong Kong’s districts.
(A) We cross-reference the roads and bridges connecting these districts to build a spatial network [63, 64]. (B) We demonstrate the first undirected network layout of Hong Kong’s districts. Districts (nodes) are linked if they border each other or share a direct road/bridge in a binary fashion. (C) We show a fully connected version of the network. For the fully connected network, edges to neighboring districts are weighted exponentially. Different weighting schemes can be applied here, however, for our application we use the spatial distance measured by the length of the shortest path connecting any two districts on the network.
Fig 3
Fig 3. Temporal dynamics of spatial socioeconomic characteristics of Hong Kong.
We show the spatial distribution of five features in our datasets for three different census years. Here, heatmaps are normalized by the mean and standard deviation. Darker shades of red show areas above the mean for each of these variables while shades of grey show areas below the mean. (A–C) We display the spatial growth of population over time. (D–F) We demonstrate the variation of mortality rates, and life insurance converge (G–I). We see some segregation of unemployment rates in (J–L), and median income in (M–O).
Fig 4
Fig 4. Relative likelihood of systematic bias for models trained on the default set of features in 2016.
We examine the distribution of probable outcomes of signed deviation by computing the difference between our predictions Y^i2016 and the ground truth mortality rates Yi2016 for each district. A perfect model would have a narrow distribution centred on 0 (solid red line going across). Positive values show overestimation, whereas negative values show an underestimation of mortality rates for each district. We color models with significance systematic overestimation in orange, while use blue to highlight models with significance systematic underestimation as measured by the 80% CI.
Fig 5
Fig 5. Impact of sociospatial factors on mortality risks.
The first three rows show the mean signed deviation for four districts that are poorly fit by our models. (A, B) We show districts with systematic overestimation of mortality rates, while (C, D) show districts where mortality rates are systematically underestimated. For each district, we show the normalized value of some features of interest (black markers) along with the average value of the same features in the neighboring districts (orange markers). The red dashed line shows the average value for each of these normalized features centered at zero. We can see evidence of sociospatial factors of longevity in all four districts. Particularly, we note a spillover of wealth measured by median income. Districts in (A) and (B) maintain lower mortality rates while surrounded by districts with average mortality rates. Districts in (C) and (D) have a socioeconomic pull, driving the entire neighborhood to have higher mortality rates.
Fig 6
Fig 6. Ego networks of each district demonstrating sociospatial factors of mortality for the 2016 weighted spatial model.
We display ego networks of each district in Hong Kong and its nearest neighbors in the road and bridge network. The central node (highlighted with a grey box) of each network corresponds to the labelled district. Neighbors are not arranged around the ego district geographically. Node color corresponds to normalized mortality rate and edge color corresponds to signed prediction error for the 2016 WSP model. These ego networks encode a qualitative measure of the sociospatial factors in mortality modeling. We display the equivalent networks for the Baseline and SP models in S10 and S11 Figs in S1 File respectively.

Similar articles

References

    1. Wong IO, Schooling C, Cowling BJ, Leung GM. Breast cancer incidence and mortality in a transitioning Chinese population: Current and future trends. British Journal of Cancer. 2015;112(1):167–170. 10.1038/bjc.2014.532 - DOI - PMC - PubMed
    1. Wu P, Presanis AM, Bond HS, Lau EH, Fang VJ, Cowling BJ. A joint analysis of influenza-associated hospitalizations and mortality in Hong Kong, 1998–2013. Scientific Reports. 2017;7(1):929. 10.1038/s41598-017-01021-x - DOI - PMC - PubMed
    1. Wong CM, Ma S, Hedley AJ, Lam TH. Effect of air pollution on daily mortality in Hong Kong. Environmental Health Perspectives. 2001;109(4):335–340. 10.1289/ehp.01109335 - DOI - PMC - PubMed
    1. Qiu H, Tian L, Ho Kf, Pun VC, Wang X, Ignatius T. Air pollution and mortality: Effect modification by personal characteristics and specific cause of death in a case-only study. Environmental Pollution. 2015;199:192–197. 10.1016/j.envpol.2015.02.002 - DOI - PubMed
    1. Lam TH, Ho SY, Hedley AJ, Mak KH, Leung GM. Leisure time physical activity and mortality in Hong Kong: Case-control study of all adult deaths in 1998. Annals of Epidemiology. 2004;14(6):391–398. 10.1016/j.annepidem.2003.09.005 - DOI - PubMed

Publication types

LinkOut - more resources