. 2021 Mar 24;17(3):e1009432.
doi: 10.1371/journal.ppat.1009432. eCollection 2021 Mar.

Neuronal death in pneumococcal meningitis is triggered by pneumolysin and RrgA interactions with β-actin

Affiliations

Neuronal death in pneumococcal meningitis is triggered by pneumolysin and RrgA interactions with β-actin

Mahebali Tabusi et al. PLoS Pathog. .

Abstract

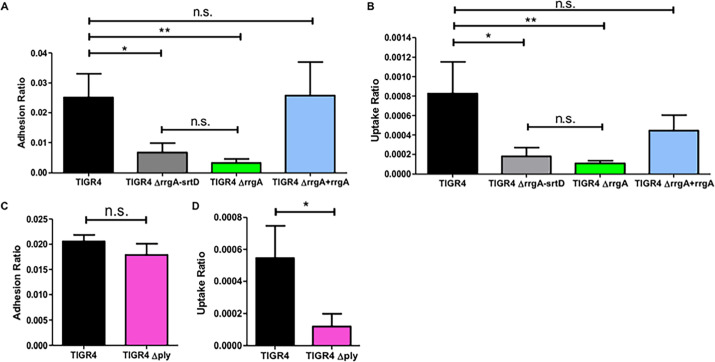
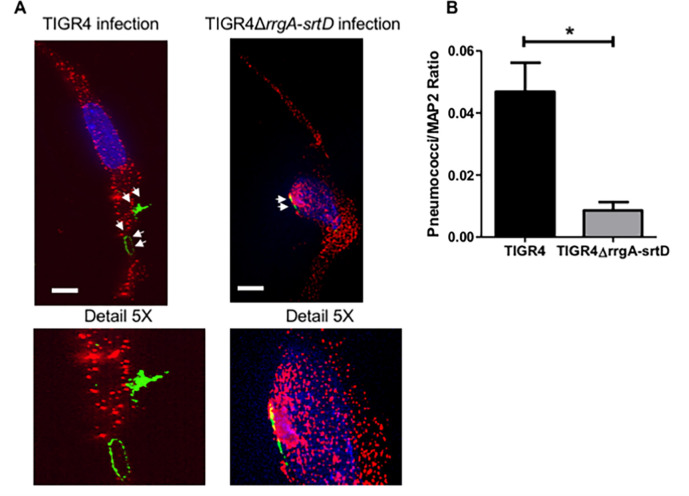
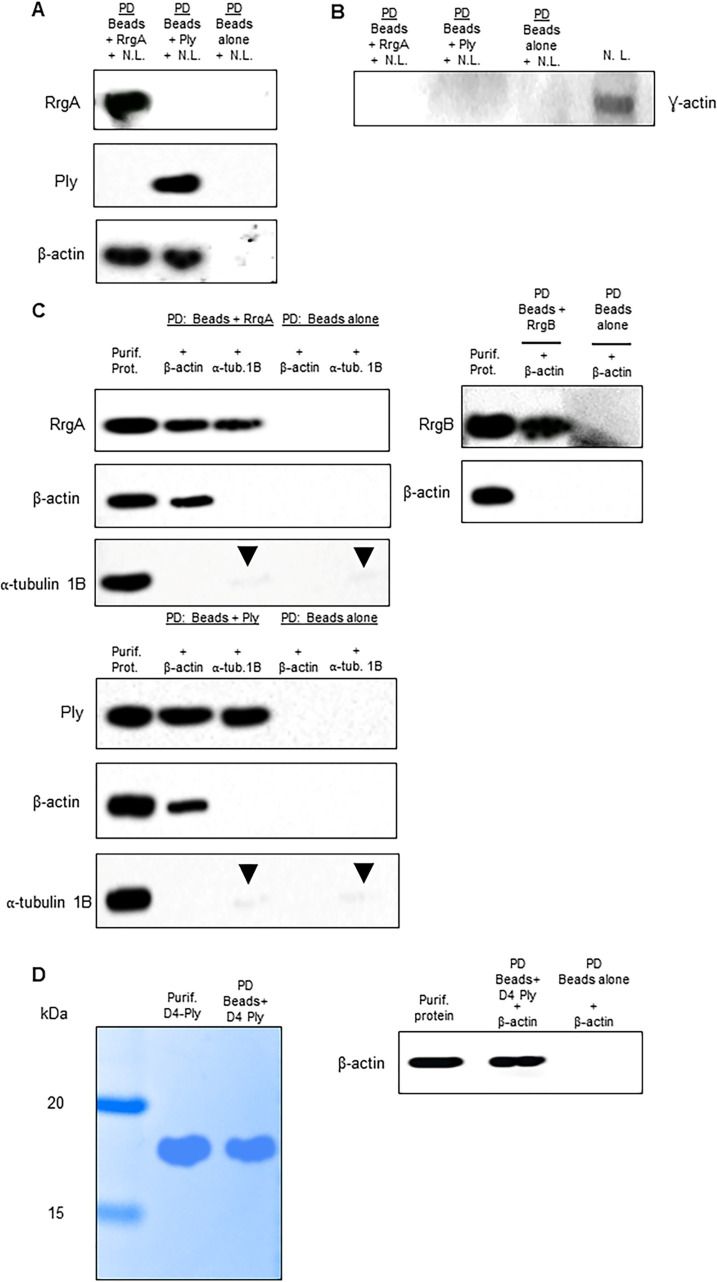
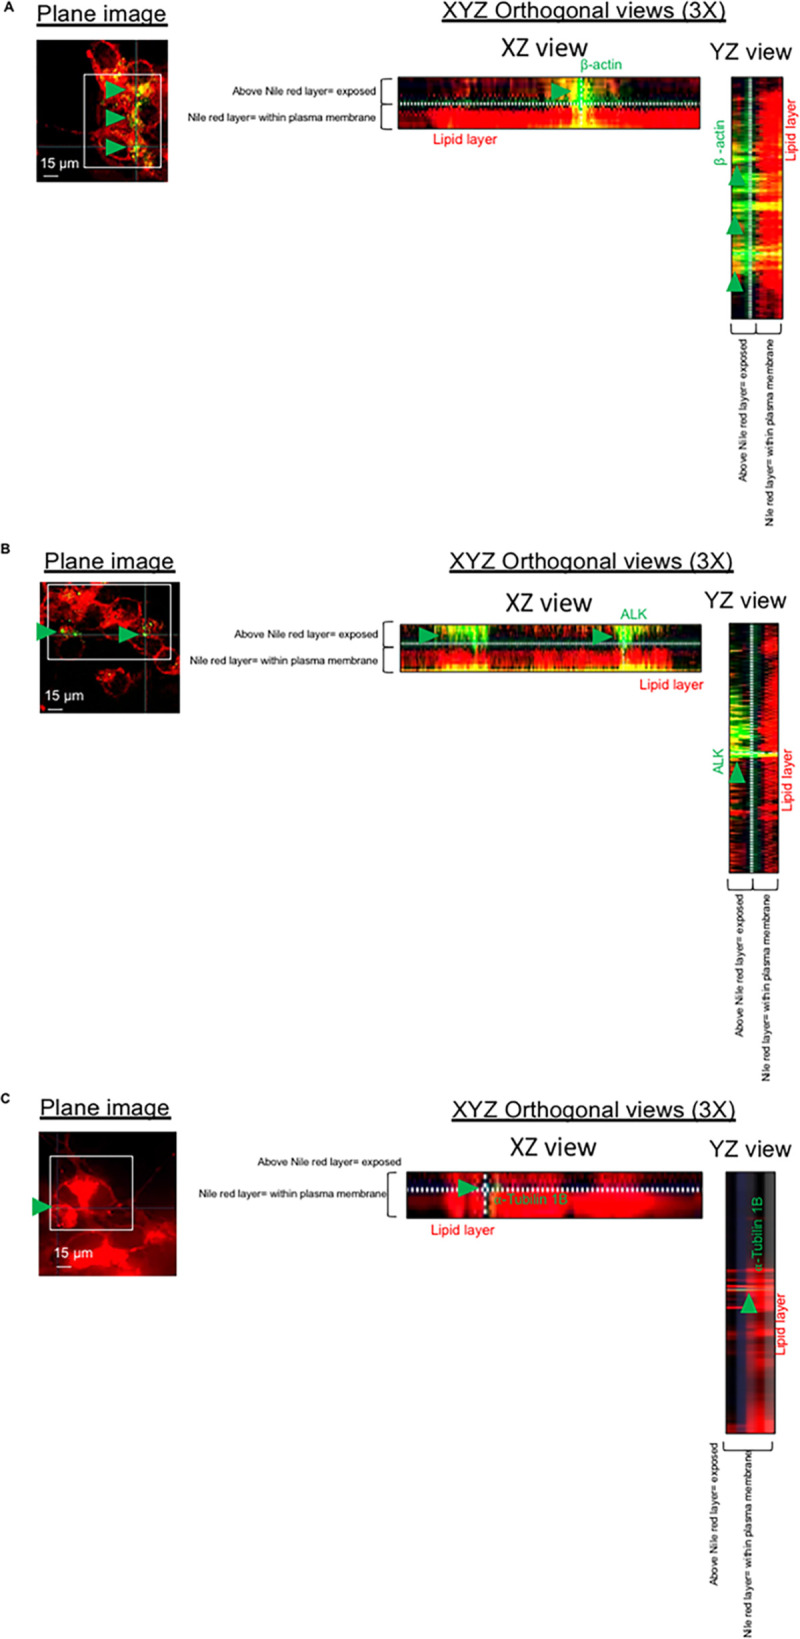
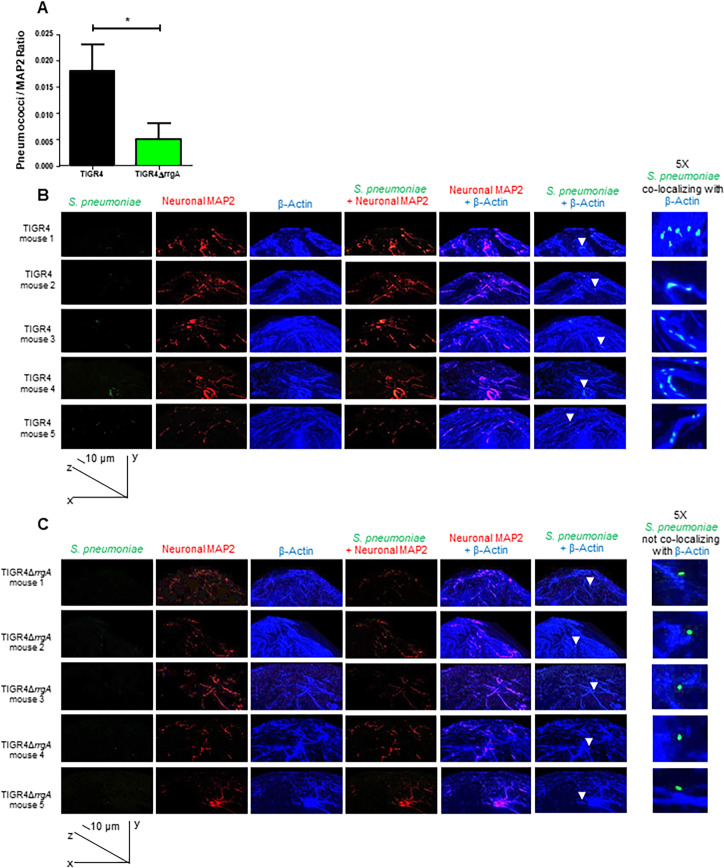
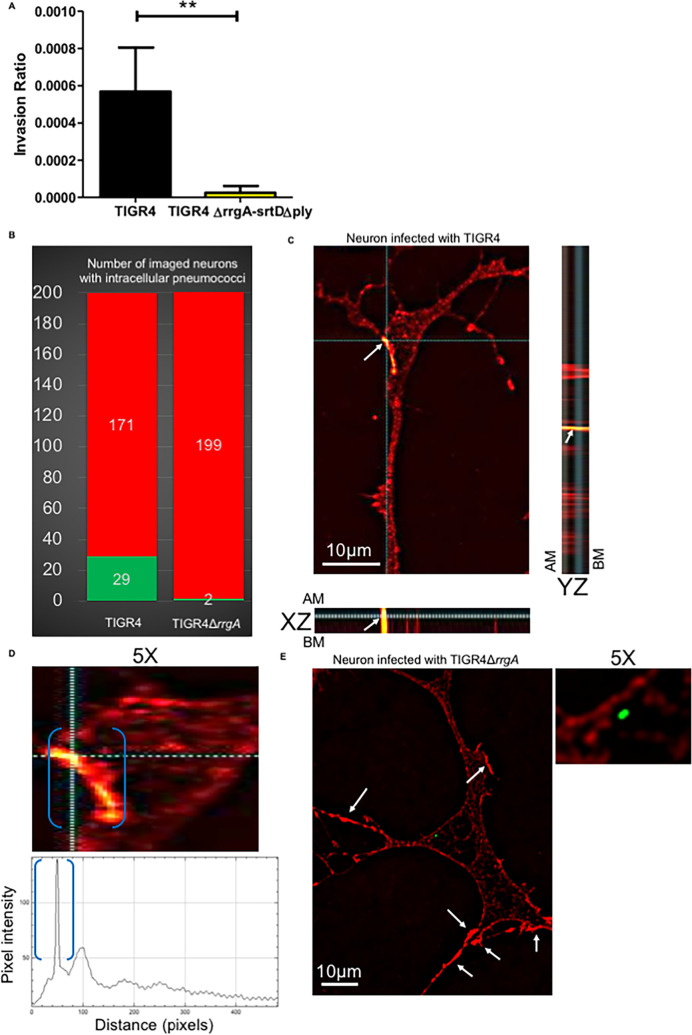
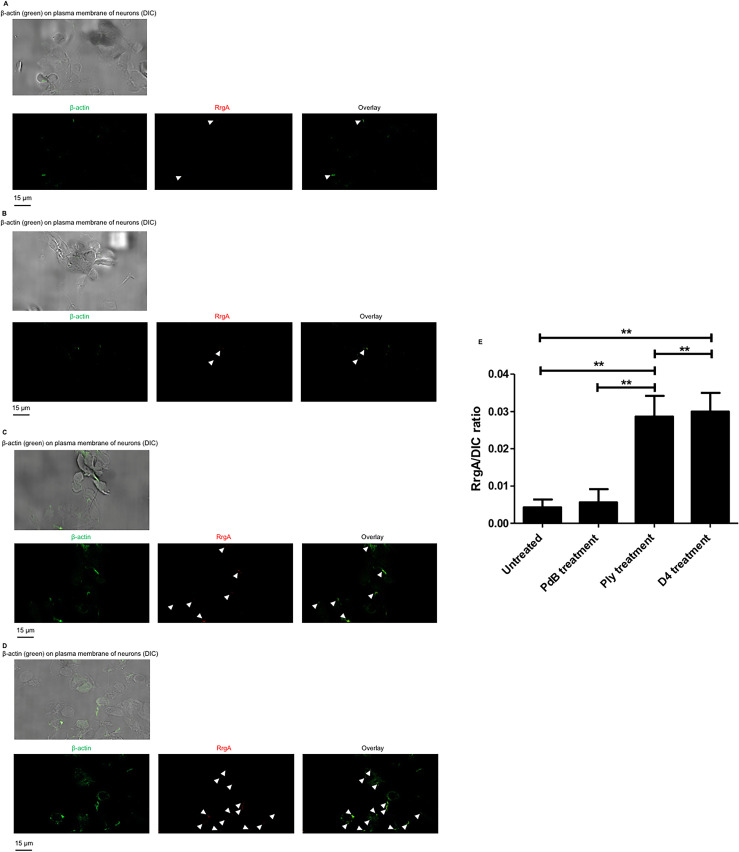
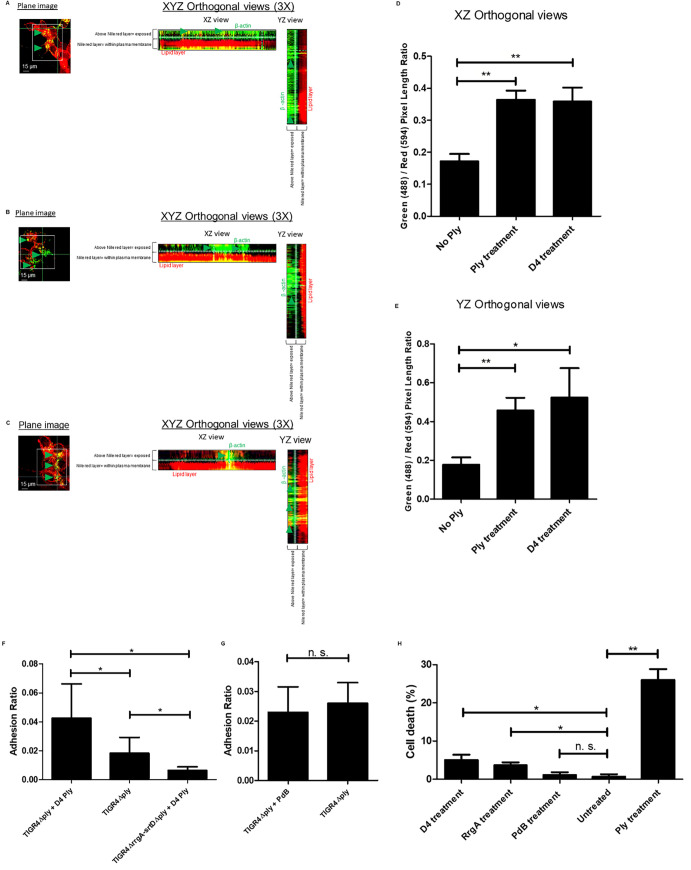
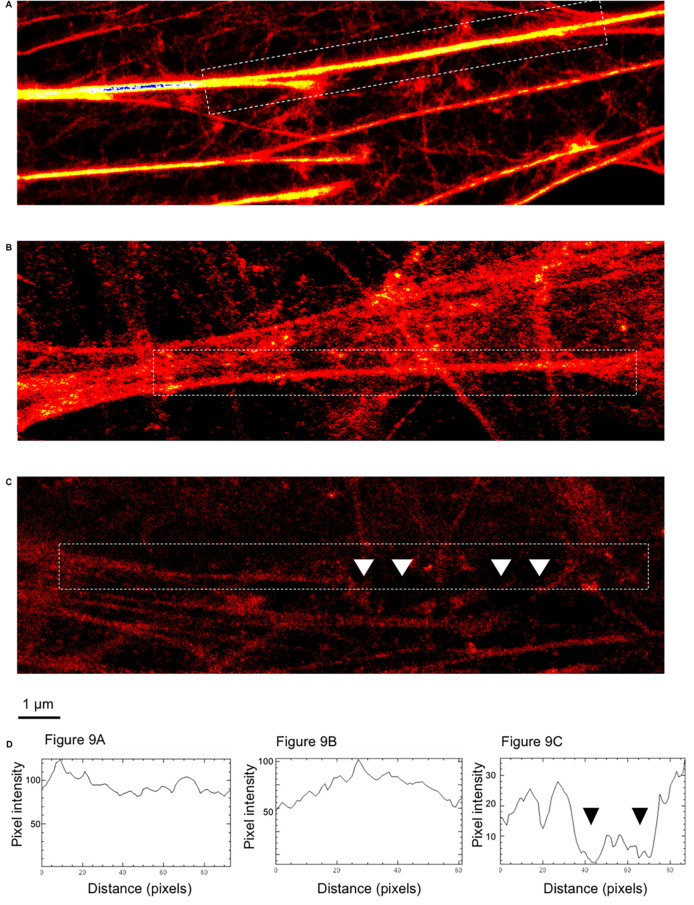
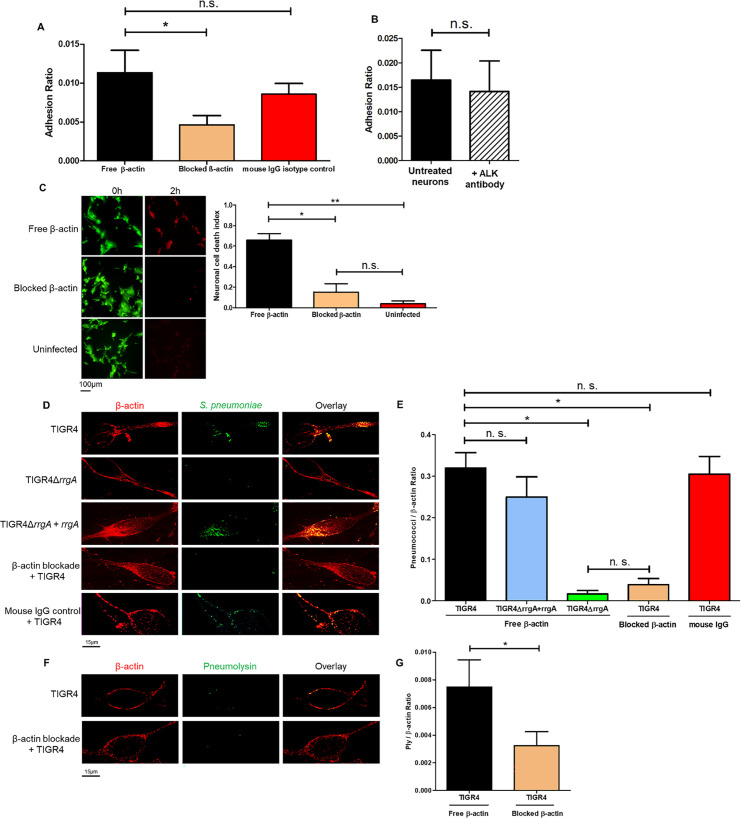
Neuronal damage is a major consequence of bacterial meningitis, but little is known about mechanisms of bacterial interaction with neurons leading to neuronal cell death. Streptococcus pneumoniae (pneumococcus) is a leading cause of bacterial meningitis and many survivors develop neurological sequelae after the acute infection has resolved, possibly due to neuronal damage. Here, we studied mechanisms for pneumococcal interactions with neurons. Using human primary neurons, pull-down experiments and mass spectrometry, we show that pneumococci interact with the cytoskeleton protein β-actin through the pilus-1 adhesin RrgA and the cytotoxin pneumolysin (Ply), thereby promoting adhesion and invasion of neurons, and neuronal death. Using our bacteremia-derived meningitis mouse model, we observe that RrgA- and Ply-expressing pneumococci co-localize with neuronal β-actin. Using purified proteins, we show that Ply, through its cholesterol-binding domain 4, interacts with the neuronal plasma membrane, thereby increasing the exposure on the outer surface of β-actin filaments, leading to more β-actin binding sites available for RrgA binding, and thus enhanced pneumococcal interactions with neurons. Pneumococcal infection promotes neuronal death possibly due to increased intracellular Ca2+ levels depending on presence of Ply, as well as on actin cytoskeleton disassembly. STED super-resolution microscopy showed disruption of β-actin filaments in neurons infected with pneumococci expressing RrgA and Ply. Finally, neuronal death caused by pneumococcal infection could be inhibited using antibodies against β-actin. The generated data potentially helps explaining mechanisms for why pneumococci frequently cause neurological sequelae.


Conflict of interest statement

The authors have declared that no competing interests exist.

Figures

Fig 1
Fig 1. RrgA promotes pneumococcal binding to neurons, and both RrgA and Ply increases pneumococcal invasion into neuronal cells.
Pneumococcal interaction with neurons was investigated in vitro using differentiated neurons and infection with (A and B) wt TIGR4 and its isogenic mutants, TIGR4ΔrrgA-srtD, TIGR4ΔrrgA, and TIGR4ΔrrgA+rrgA, and in (C and D) wt TIGR4 and TIGR4Δply. (A) CFU-based adhesion to neurons. (B) Invasion into neurons. (C) Adhesion ratio was calculated as [CFU of adhered bacteria] / [CFU of (non−adhered bacteria + adhered bacteria)]. (D) Invasion ratio was calculated as [CFU of invaded bacteria] / [CFU of adhered bacteria)]. For all graphs (A-D) the columns represent average values, and error bars represent standard deviations. Each graph shows an overview at least three (n≥3) biological replicates. ** = p<0.001, * = p<0.05, n.s. = non-significant.
Fig 2
Fig 2. High-resolution fluorescence microscopy analysis supports that pilus-1 expression increases pneumococcal adhesion to neurons.
(A) Piliated TIGR4 bacteria or its isogenic mutant in pilus-1 TIGR4ΔrrgA-srtD were used to infect neuronal cells. High-resolution fluorescence microscopy analysis was performed on adhered bacteria where neurons were stained with anti-MAP2 antibody combined with goat anti mouse Alexa Fluor 594 (red), and the pneumococcal capsule stained with anti-serotype 4 capsule antibody combined with goat anti rabbit Alexa Fluor 488 (green). White arrows point to pneumococci that adhered to neurons. White scale bars represent 10 μm. Two representative images are shown selected from 200 cells with adhered bacteria imaged per pneumococcal strain. The panel “Detail 5X” displays a 5X-magnified image of the area in the original images where the bacteria adhered to neurons. (B) Quantification analysis of the amount of pneumococcal signal detected on the plasma membrane of neurons by high-resolution microscopy images shown in Fig 3A. For quantification of the bacterial fluorescence signal on neurons, in each image (n = 200 neurons with adhered bacteria per each pneumococcal strain) the area occupied by the green fluorescence signal of the bacteria was divided by the area occupied by the red fluorescence signal of neurons. All areas were measured in square pixels and calculated with the software Image J. Columns in the graph represent average values. Error bars represent standard deviations. The Pneumococci/MAP2 ratio is shown on the Y axis; * = p<0.05.
Fig 3
Fig 3. Pull-down experiments show that RrgA and Ply interact with β-actin of neurons.
(A) Western blot analysis performed using the protein content obtained after the pull-down experiments (P.D.) using Ni-NTA beads coupled with purified RrgA or Ply and incubated with neuronal lysate (N.L.). Three separate western blots using the same samples were performed for the detection of RrgA, Ply and β-actin respectively. (B) The same P.D. samples used in 4A were also used to assess binding of RrgA and Ply to γ-actin of neurons (C) Western blot analysis performed after co-immunoprecipitation experiments using purified RrgA and Ply, coupled with Ni-NTA beads, incubated with the purified recombinant proteins β-actin or ⍺-tubulin 1B (as negative control). Black arrows point to faint bands that were detected for ⍺-tubulin 1B. The presence of these bands of similar intensity in the IP samples with beads coupled with RrgA or Ply and beads alone indicates a slight unspecific affinity of ⍺-tubulin 1B for the Ni-NTA beads. Four separate western blots using the same samples were performed for detection of RrgA, Ply, β-actin and ⍺-tubulin 1B. As a specificity control, western blot analysis was also performed after the co-immunoprecipitation experiments using purified RrgB incubated with the purified recombinant proteins β-actin. Two separate western blots using the same samples were performed for detection of RrgB and β-actin. (D) Detection of D4-Ply and Ni-NTA beads coupled with D4-Ply by Coomassie staining, and western blot analysis performed after co-immunoprecipitation experiment using purified D4-Ply, coupled with Ni-NTA beads, incubated with the purified recombinant proteins β-actin.
Fig 4
Fig 4. Exposure of β-actin on the plasma membrane of neurons.
Immunofluorescence microscopy analysis showing fixed and non-permeabilized neurons and stained for nile red for the detection of plasma membrane lipids; neurons were co-stained with anti-β-actin antibody (A), anti-ALK antibody (B) and anti-⍺-tubulin 1B antibody (C). 3D-orthogonal views were used to assess whether the detection of β-actin antibody (A), anti-ALK antibody (B) and anti-⍺-tubulin 1B (C) was above the lipid layer of neuronal plasma membrane. Per each experimental group, n = 200 neurons (among two different biological replicates) were imaged.
Fig 5
Fig 5. Mouse brain tissue ex vivo analyzed by high-resolution fluorescence microscopy and 3D reconstruction imaging showing that pneumococci associated with neurons co-localize with neuronal β-actin only when expressing RrgA.
Pneumococci were stained with anti-serotype 4 capsule antibody combined with goat anti rabbit Alexa Fluor 488 (green), neurons were stained with anti-MAP2 antibody labelled with Zenon labeling mouse IgG 594 fluorophore (red), β-actin was stained with anti-β-actin antibody combined with goat anti mouse Alexa Fluor 647 (far red, a blue color was assigned using the Softworx imaging software). High-resolution microscopy analysis and 3D reconstruction imaging (Volume viewer function of the Softworx imaging software) was performed to firstly detect pneumococci in the brain tissue of the mice co-localized with neurons, then to analyze the co-localization between pneumococci and β-actin, and analysis of β-actin with the neuronal marker MAP-2 to distinguish β-actin of neurons co-localization. (A) For quantifying the bacterial fluorescence signal on neurons, in each image the area occupied by the green fluorescence signal of the bacteria was divided by the area occupied by the red fluorescence signal of neurons, all areas were measured in square pixels and calculated with the software Image J; columns in the graph represent average values, error bars represent standard deviations, the Pneumococci/MAP2 ratio is shown on the Y axis; * = p<0.05. (B and C) At the bottom left corner of figures in panels B and C the graph shows the angle of the 3D reconstruction of each image (XYZ axes) and the scale bars; six tissue sections for each mouse (5 mice) infected with either TIGR4 (A) or TIGR4ΔrrgA (B) were imaged, and per each section twenty-five images in random regions of the section were taken. White arrows in the panel “S. pneumoniae + β-actin” point towards specific area of the tissue sections to highlight the co-localization between piliated pneumococci and β-actin (A), and the absence of co-localization between non-piliated pneumococci and β-actin (B); the panel “5X S. pneumoniae co-localizing with β-actin” displays the region of brain tissue in close proximity of the white arrows with an enhanced 5X magnification.
Fig 6
Fig 6. RrgA and Ply increase pneumococcal invasion of neurons and intracellular piliated pneumococci co-localize with neuronal β-actin.
(A) CFU-based internalization assay using wt TIGR4 and its isogenic double mutant TIGR4ΔrrgA-srtDΔply. The uptake ratio by neurons was calculated as [CFU of intracellular bacteria] / [CFU of adhered bacteria)]. In the graph, columns represent average values, and error bars represent standard deviations. The graph shows an overview of three biological replicates. ** = p<0.001. (B) High-resolution fluorescence microscopy analysis was performed of neurons with intracellular pneumococci that were fixed, and permeabilized. Immunofluorescence staining was performed to detect β-actin with an anti-β-actin antibody combined with goat anti mouse Alexa Fluor 594 (red) and pneumococci with anti-serotype 4 capsule antibody combined with goat anti rabbit 488 (green). The graph shows a quantification of the number of neurons with intracellular pneumococci among a total number of 200 random neurons imaged per strain, either TIGR4 or TIGR4ΔrrgA. The green column represents the number of neurons with intracellular pneumococci and the red column the number of neurons without intracellular pneumococci. (C) Neurons with intracellular pneumococci after TIGR4 infection were imaged with z-stacks to capture the thickness of the neuronal cell (number z-stacks = 22). Intracellular pneumococci with the z-stack number = 9 was displayed from top view and in XZ-axes- and YZ-axes-orthogonal views to demonstrate intracellular localization of pneumococci (green). The imaged bacteria were within the neuronal cell thickness between the AM (apical membrane) and BM (basolateral membrane). Both XZ and YZ-axes-orthogonal views showed co-localization between pneumococci (white arrows) and intracellular β-actin. The image shown is a representative of 200 neurons imaged after TIGR4 infection. (D) 5X magnification of the neuron shown in Fig 6B focusing on the cell area in close proximity to intracellular pneumococci. The function Profile Plot of Image J was used to measure the intensity (pixels) of the red fluorescence signal of β-actin. Within blue brackets the β-actin staining in close proximity to intracellular pneumococci that corresponds to the pick of fluorescence intensity in the graph underneath the microscopy image is shown. (E) Neurons with intracellular pneumococci after TIGR4ΔrrgA infection were imaged with z-stacks to capture the thickness of the neuronal cell (number z-stacks = 22). The displayed image shows the z-stack number = 10; white arrowns point towards regions of the neuronal cell with a localized enhanced β-actin fluorescent signal. The panel “5X” shows the same image 5X magnified focusing on the area of neuronal cell in close proximity to the intracellular bacteria to highlight the absence of co-localization between TIGR4ΔrrgA and intracellular β-actin. This image is a representative of 200 neurons imaged after TIGR4ΔrrgA infection.
Fig 7
Fig 7. Ply interaction with the neuronal plasma membrane leads to increased levels of exposed β-actin, allowing more RrgA to adhere to neuronal β-actin.
Immunofluorescence microscopy analysis of fixed and non-permeabilized neurons without any pre-treatment (A), treated with non-pore-forming PdB (B), full length protein Ply (C), or D4-Ply (D). In A-D neurons are first shown with the DIC channel to show the neuronal cells seeded on the coverslips, and separate green (FITC-488 nm channel), red (TRITC-594 nm channel) are presented to show the fluorescent signals of β-actin, RrgA, and the overlay panel shows the co-localization of RrgA with β-actin on neuronal plasma membrane. (E) For quantification of RrgA fluorescence signal on neurons, in each image (n = 200 neurons with adhered bacteria, per each pneumococcal strain) the area occupied by the green fluorescence signal of the bacteria of RrgA was divided by the total area occupied neurons imaged through the DIC channel. All areas were measured in square pixels and calculated with the software Image J. Columns in the graph represent average values, and error bars represent standard deviations (n = 200 neurons with adhered RrgA imaged, per experimental group). The RrgA / DIC ratio is shown on the Y axis; ** = p<0.01.
Fig 8
Fig 8. Treatment with purified Ply and D4 enhance exposure of β-actin on the neuronal plasma membrane.
Immunofluorescence microscopy analysis showing fixed and non-permeabilized neurons pre-treated with purified Ply (A), D4 (B), or untreated (C), same figure shown in Fig 5A), and stained for the detection of plasma membrane lipids (nile red) and β-actin; 3D-orthogonal views were used to visualize the portions of neuronal cells with β-actin signal above the nile red staining (= exposed on plasma membrane); per each experimental group, n = 200 neurons (among two different biological replicates) were imaged. (D and E) Quantification graphs showing the amount of β-actin signal exposed on the plasma membrane assessed by measuring the length (pixels) of the β-actin signal detected above the nile red staining; Y axis displays Green (488 nm channel) / Red (594 nm channel) ratio that was calculated by dividing the length (pixels) of the β-actin signal (green) detected above the nile red signal (red) by the length of the nile red signal; measurement of the length values (pixels) was performed with the function of Image J Analyze/Plot Profile; bars and error bars in the graphs represent average and standard deviation values calculated among 200 neuronal cells imaged for each experimental group, ** = p<0.01, * = p<0.05 (F) Adhesion of TIGR4Δply to untreated and D4-treated neurons and of TIGR4ΔrrgA-srtDΔply to D4-treated neurons was calculated by dividing the total number of bacteria in each well for each pneumococcal strain after pneumococcal infection by the total number of adhered bacteria in each well for each pneumococcal strain. Columns represent average values, and error bars represent standard deviations; the graph shows data from n = 2 biological replicates (with n = 7 and n = 5 technical replicates per each biological replicate), * = p<0.05. (G) Adhesion of TIGR4Δply to untreated and PdB-treated neurons was calculated by dividing the total number of bacteria in each well for each pneumococcal strain after pneumococcal infection by the total number of adhered bacteria in each well for each pneumococcal strain. Columns represent average values, and error bars represent standard deviations; the graph shows data from n = 3 biological replicates (with n = 3 and n = 3 technical replicates per each biological replicate), * = p<0.05. (H) Neuronal cell death measured by LDH release in neurons treated with D4, or RrgA, or mutant toxoid PdB, or full Ply, non-treated neurons were used as control; columns represent average values, and error bars represent standard deviations; the graph shows data from n = 2 biological replicates (with n = 3 technical replicate per each biological replicate), ** = p<0.01, * = p<0.05.
Fig 9
Fig 9. Disruption of neuronal β-actin filaments imaged by STED super-resolution microscopy.
Immunofluorescence STED super-resolution microscopy analysis showing β-actin filaments (red) within neurons uninfected (A), infected with TIGR4ΔrrgA-srtDΔply (B) and TIGR4 (C). (D) Intensity profiles of the β-actin filaments selected within white dashed rectangles; fluorescent intensity profile measurement performed with the function of Image J Analyze/Plot Profile. the intensity profiles shown in D are representatives of the whole imaging experiment (for each experimental group, 25 neuronal cells were imaged). White arrows in C point towards gaps of β-actin filaments that correspond to the drop of fluorescent intensity measured in the intensity profile graph (black arrows, third graph from the left).
Fig 10
Fig 10. Blockade of β-actin on the plasma membrane with antibodies inhibit interactions with the cytotoxin Ply.
CFU-based adhesion assays were performed using wt TIGR4 bacteria and in (A) untreated neurons, anti-β-actin-antibody-treated neurons and mouse-IgG-treated neurons, and in (B) untreated neurons and anti-ALK-antibody-treated neurons. The adhesion ratio was calculated as [CFU of adhered bacteria] / [CFU of (non−adhered bacteria + adhered bacteria)]. The columns represent average values, and error bars represent standard deviations. The graph shows an overview at three biological replicates. * = p<0.05, n.s. = non-significant. (C) Images from the live-cell imaging experiment at the start (0 h) and at the end, 2 hours post infection, and related quantification of neuronal cell death. Differentiated neurons were stained with a live/dead dye expressing green fluorescence for live cells and red fluorescence when undergoing cell death. Ratio Green (488 nm) / Red (594 nm) represents the neuronal cell death index, calculated by dividing the total area occupied by the green fluorescence signal at time 0 by the total area occupied by the red fluorescence signal at 2 hrs (as performed for data shown in Fig 1). Per each condition with pneumococci, a total of four biological replicates were used, and a total of two biological replicates were used for uninfected neurons. Columns in the graphs represent average values, and error bars represents standard deviations. ** = p<0.001, * = p<0.05, n.s = non-significant. (D and F) Infected neurons were fixed and stained with anti-β-actin antibody combined with goat anti mouse Alexa Fluor 594 for the detection of β-actin, and with anti-serotype 4 capsule antibody combined with goat anti rabbit Alexa Fluor 488 (green) for the detection of pneumococci (D). Anti-Ply antibody combined with goat anti rabbit Alexa Fluor 488 (green) was used for detection of Ply (F). Each neuron imaged in D and F is representative of 200 neurons imaged per each pneumococcal strain. (E and G) Quantification analysis of the amount of pneumococcal signal detected on the plasma membrane of neurons by high-resolution microscopy. For quantification of the (E) pneumococcal or (G) Ply fluorescence signal on neurons, in each image (n = 200 neurons with adhered bacteria, per each pneumococcal strain) the area occupied by the green fluorescence signal of the bacteria or Ply was divided by the area occupied by the red fluorescence signal of β-actin. All areas were measured in square pixels and calculated with the software Image J. Columns in the graph represent average values, and error bars represent standard deviations. The Pneumococci/ β-actin ratio is shown on the Y axis; * = p<0.05, n.s. = non-significant.

Similar articles

Cited by

References

    1. Iovino F, Seinen J, Henriques-Normark B, van Dijl JM. How does Streptococcus pneumoniae invade the brain? Trends Microbiol. 2016. April;24(4):307–315 10.1016/j.tim.2015.12.012 - DOI - PubMed
    1. Mook-Kanamori BB, Geldhoff M, van der Poll T, van de Beek D. Pathogenesis and pathophysiology of pneumococcal meningitis. Clin Microbiol Rev. 2011. July;24(3):557–91 10.1128/CMR.00008-11 - DOI - PMC - PubMed
    1. van de Beek D, de Gans J, Tunkel AR, Wijdicks EFM. Community-acquired bacterial meningitis in adults. N Eng J Med. 2006. January 5;354(1):44–53 - PubMed
    1. van de Beek D, de Gans J, Spanjaard L, Weisfelt M, Reitsma JB, Vermeulen M. Clinical features and prognostic factors in adults with bacterial meningitis. N Eng J Med. 2004. October 28;351(18):1849–59 10.1056/NEJMoa040845 - DOI - PubMed
    1. Lucas MJ, Brouwer MC, van de Beek D. Neurological sequelae of bacterial meningitis. J Infect. 2016. July;73(1):18–27. 10.1016/j.jinf.2016.04.009 - DOI - PubMed

Publication types

LinkOut - more resources