. 2021 May 3;220(5):e202008090.
doi: 10.1083/jcb.202008090.

Plk4 triggers autonomous de novo centriole biogenesis and maturation

Affiliations

Plk4 triggers autonomous de novo centriole biogenesis and maturation

Catarina Nabais et al. J Cell Biol. .

Abstract

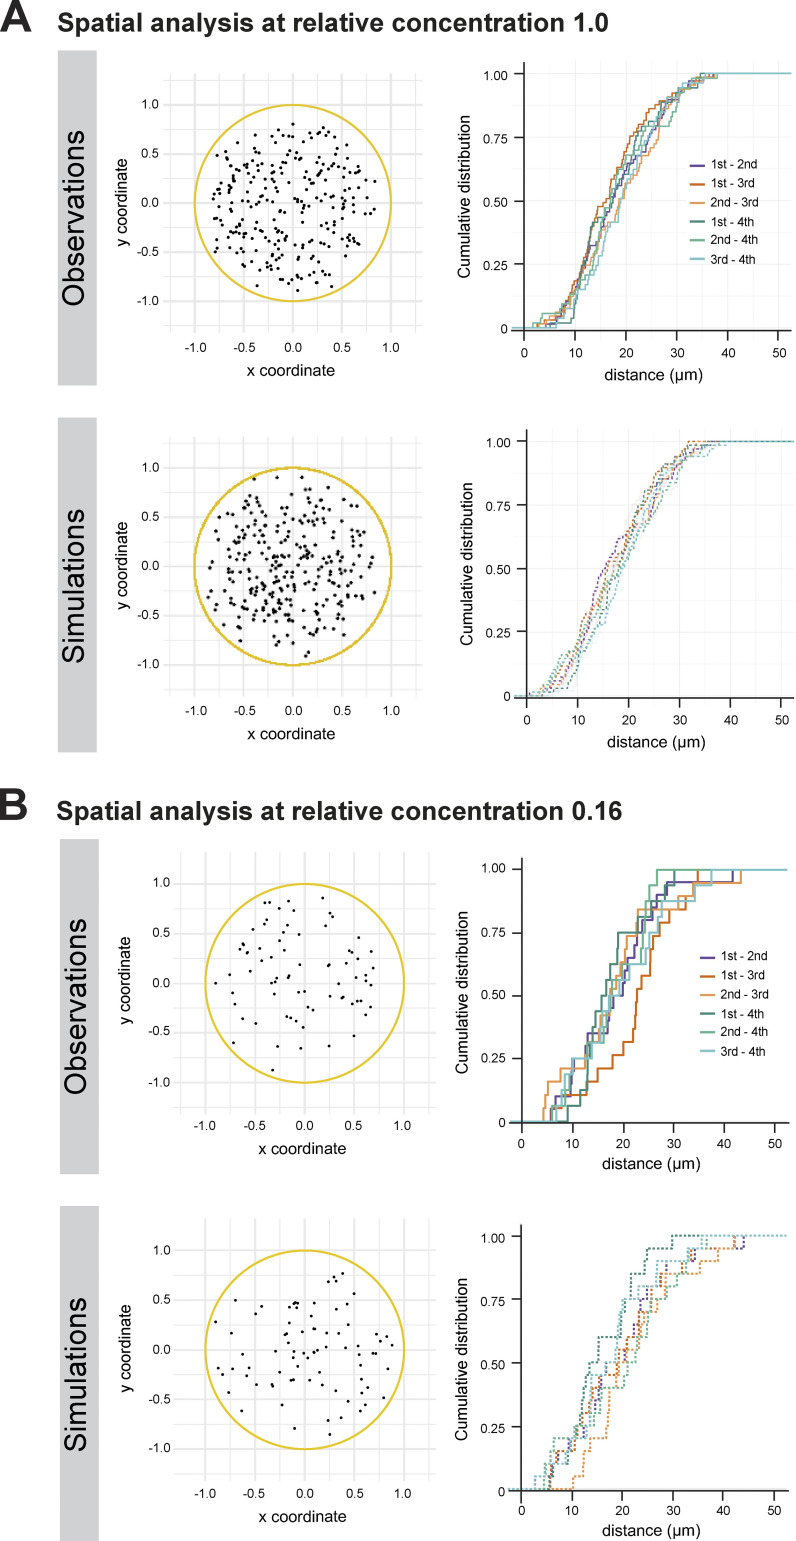
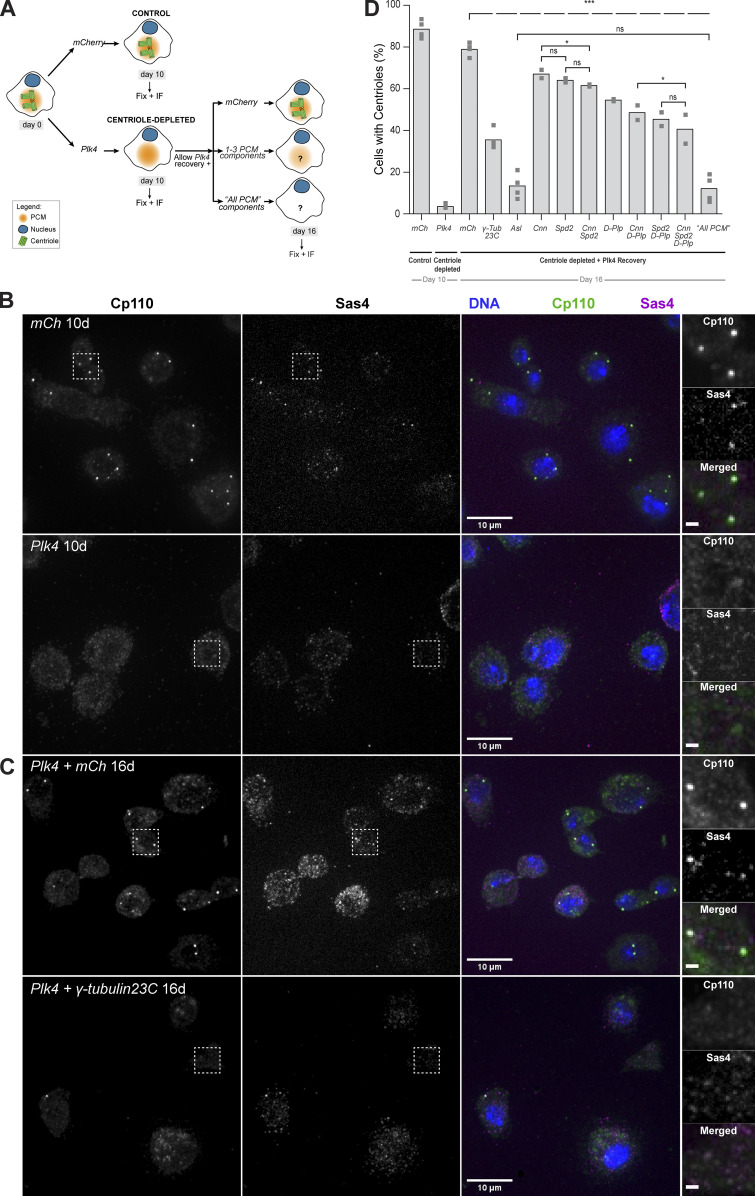
Centrioles form centrosomes and cilia. In most proliferating cells, centrioles assemble through canonical duplication, which is spatially, temporally, and numerically regulated by the cell cycle and the presence of mature centrioles. However, in certain cell types, centrioles assemble de novo, yet by poorly understood mechanisms. Herein, we established a controlled system to investigate de novo centriole biogenesis, using Drosophila melanogaster egg explants overexpressing Polo-like kinase 4 (Plk4), a trigger for centriole biogenesis. We show that at a high Plk4 concentration, centrioles form de novo, mature, and duplicate, independently of cell cycle progression and of the presence of other centrioles. Plk4 concentration determines the temporal onset of centriole assembly. Moreover, our results suggest that distinct biochemical kinetics regulate de novo and canonical biogenesis. Finally, we investigated which other factors modulate de novo centriole assembly and found that proteins of the pericentriolar material (PCM), and in particular γ-tubulin, promote biogenesis, likely by locally concentrating critical components.


Figures

Figure 1.
Figure 1.
Visualization of centrosome biogenesis in Drosophila egg extract. (A) Drosophila egg extract is prepared by rupturing the membrane and aspirating the cytoplasm with a micropipette. The content is deposited as a droplet on functionalized glass surface. (B) Each explant is followed by 3D time-lapse imaging, documenting centriole formation over time. (C) Maximum intensity z projections from a fluorescence time-lapse of a droplet of cytosolic extract isolated from a Drosophila egg overexpressing Plk4. Centrioles are absent in the first time point and form de novo throughout the experiment detected as spots (Spd2, in green) associated with a MT array (magenta; arrowheads, numbers indicate the order of birth), reported by the MT associated protein Jupiter. Signals in the two channels are detected almost simultaneously, without observing any clear trend of one signal appearing before the other one. The larger green circles are yolk, and the high background is caused by other lipid granules that are highly autofluorescent in the green spectrum, and that cannot be avoided. The insets depict the first centrosomes formed de novo in this time-lapse. The numbers represent their order of appearance. Example of n = 68 explants. Time is reported as minutes:seconds.
Figure S1.
Figure S1.
In support of Figs. 1 and 2: Measurement of concentration fold-change of Plk4 in overexpression lines. (A) Insertion of a fluorescent tag into Drosophila Plk4 endogenous locus. Schematic representation of the WT dmPlk4 locus (WT) and of the dmPlk4 locus after successful tag integration by homologous recombination (HR). A donor plasmid carrying the mNeonGreen reporter and a small linker (dark green) flanked by 1 kbp homology arms was used for homologous recombination. The UTRs are shown in gray, and the coding sequences are depicted in orange. The arrows indicate the position of the screening primers dmPLK4 5′UTR 3 FW and dmPLK4 1exon Rev, which are located outside the homology arms. The same strategy was used for mNeonGreen and GFP tags, generating two lines that were used at different parts of this paper. The GFP knock-in was used as WT control in measurement of Plk4 expression level. The inset shows the integration of a fluorescent tag into Plk4 endogenous locus (HR Plk4) by Western blot, causing a migration shift of the PCR product in the agarose gel compared with the untagged Plk4 locus (WT Plk4). (B) Western blot analysis of Plk4 concentration for endogenous expression and for overexpression constructs. Two (out of four) representative Western blots are shown. We emphasize that the detection of endogenous Plk4 with a Western blot approach is extremely challenging. In fact, most studies so far have only detected Plk4 by means of affinity-\ tag or fluorescent reporter and/or under an overexpression scenario. We were able to visualize the endogenous Plk4 tagged with mEGFP using αGFP antibody. Plk4 overexpression was visualized with a GFP–Plk4 overexpression (o.e.) construct, whose extract shows similar centriole biogenesis results as the nontagged Plk4 overexpression construct used in most parts of this work. We also made extract from flies overexpressing nondegradable (ND) Plk4, which accumulates in embryos and serves as a positive control (pUASp–ND-Plk4–EGFP; Cunha-Ferreira et al., 2013). WT embryos (w1118) were loaded as negative control as they do not have GFP-tagged protein. The black arrowhead points at GFP-tagged Plk4 constructs, while the white arrowhead points at an unspecific signal also present in WT embryos. We register 3.2 ± 1.9 times higher Plk4 concentration in the extract of embryos overexpressing Plk4 as compared with the WT (n = 4). Inter-experiment variability is largely due to systematic errors of Western blot quantification, but also due to the endogenous concentration of Plk4 being near the detection limit. Despite the variability, this quantitation is in line with our dilution results (Fig. 4 B); at 1/5 dilution of the Plk4-overexpressing extract, we detect very few de novo events, suggesting that with further dilution, the kinetics converges toward WT conditions where de novo events are not observed. Note that while the V32 driver for protein expression used in our experiments normally leads to high levels of protein expression, pUAS–GFP–Plk4 is likely being down-regulated through targeted degradation, in contrast to pUAS–ND-Plk4–GFP, which accumulates to higher levels. Ab, antibody; Chr., chromosome.
Figure 2.
Figure 2.
Centrioles assemble de novo, mature, and duplicate within the same explants, in the absence of cell-cycle progression. Images show maximum-intensity z projections from time-lapse videos of cytoplasmic explants extracted from noncycling unfertilized eggs overexpressing Plk4. Newly assembled centrosomes load Plk4 (A and B), Ana1 (C and D), Asl (E and F), and Spd2 (G, H, and J) shown in green, and nucleate MTs as reported by the MT-associated protein Jupiter (magenta). The larger green blobs result from yolk autofluorescence, highly noticeable in the Plk4 and Spd2 panels. (B, D, and F) Centrioles formed de novo also duplicate, which was inferred from changes in the intensity profile along the axis AB¯ across the centrosomal signal (bottom plots); from a symmetrical Gaussian curve to a Gaussian mixture, suggesting the presence of more than one diffraction-limited structure (centriole). A uni- or bimodal Gaussian distribution was fitted to each de novo and canonical intensity profile, respectively (dashed lines represent modes from fit). The coefficient of determination (R2) is presented for each fit. Scale bars, 0.5 µm. (G) Centrioles form de novo and canonically over time; therefore, both biogenesis pathways co-occur. Centriole duplication was inferred from the change in the intensity profile across the Spd2 signal (H, bottom plots). Uni- or bimodal Gaussian fitting as in B–F. Colors represent one centrosome that first assembled de novo and later duplicated. (I) The duplication time depicted in the graph is the time elapsed between the documentation of the first centriole formed de novo (unimodal density) and the detection of a centriole pair (bimodal density). The horizontal line and error bars represent the median and interquartile range (n = 66 explants from different eggs). (K) Insets of the first three centrosomes formed de novo in time-lapse (J) and their corresponding normalized and bleach-corrected intensity of Spd2 (L) and Jupiter reporting MTs (M), plotted over time. Time is reported in minutes:seconds. Scale bar, 0.5 µm. Norm., normal.
Figure S2.
Figure S2.
In support of Fig. 2: Temporal analysis of de novo centriole biogenesis at extended spatial resolution. (A) Visualization of centrosome biogenesis in a Drosophila egg extract by 3D-Structured Illumination Microscopy. Maximum-intensity z projections from a time-lapse acquisition of an unfertilized egg explant overexpressing Plk4. Centrioles (insets) are detected as barrel-shaped structures surrounded by the PCM component Spd2 (green) associated with a MT array (magenta), reported by the MT-associated protein Jupiter. Insets are single-plane images of three different centrosomes. Scale bar, 0.5 µm. Centrioles formed de novo can duplicate. Time is reported as minutes:seconds. (B) Time-lapse (top row) of an egg explant overexpressing GFP–Plk4, in which centriole form de novo over time (arrows) as shown in magnified views (bottom). Numbers indicate sequence of formation. Inter-event times are shown in Fig. S4 A. (C) Time-lapse (top row) of an egg explant overexpressing Asl–mCherry, in which centrioles form de novo over time (arrows) as shown in magnified views (bottom). Numbers indicate sequence of formation; after de novo event #1, two centrioles formed concomitantly within the temporal resolution (#2 and #2′′) followed by another event (#3). Inter-event times are shown in Fig. S4 B. (D) Histogram of frame-to-frame (instantaneous) displacements of first event centrosomes. Most of the centrosomes performed random movement and only in rare cases they moved away in a directed fashion from the explant boundaries. (E) Comparison of centrosome movement versus distance between registered biogenesis. Cumulative distribution functions of frame-to-frame displacement (black) in comparison with all subsequent inter-event distances as presented in Fig. 3. This comparison shows that the probability for a biogenesis event to quickly displace a distance typically seen between biogenesis events is extremely low. Any subsequent event after the first biogenesis is unlikely a duplication-and-run event.
Figure 3.
Figure 3.
Spatio-temporal kinetics of de novo centriole biogenesis. (A) Schematic representation of the experimental data analysis for distances. The first four centrosomes formed de novo in the explants were tracked in 3D using the intensity signal from the Jupiter (MT reporter) channel (first tracking round) and Spd2 (centrosomal reporter) channel (second tracking round) combined. For each of the de novo birth events, an XYZT coordinate matrix was retrieved, from which the inter-event distances were calculated. Experimental n = 68 explants/eggs. (B) Scatter plot of observed inter-event distances for all pairwise combinations of the first four de novo biogenesis events. Horizontal lines and error bars represent median and interquartile distance, respectively. (C) Cumulative distribution functions (CDF) of inter-event distance. Distributions were not significantly (ns) different (Kruskal–Wallis mean rank test, P = 0.467). (D) In silico simulations were performed to test if the observed experimental data deviates from a theoretical scenario in which all four birth events occurred at independent and identically distributed random positions with a uniform probability density distribution, within explants with similar geometry as in the experiments. Four random events were obtained in 100 simulations of 68 explants. The graph depicts the median CDF of all experimentally observed (obs, solid line) and all simulated (sim, dashed line) inter-events distances, while the gray envelope indicates the 95% confidence interval (from quantile 0.025 to 0.975) for the simulated data. The experimental observations do not deviate from random simulations. (E) Schematic representation of the experimental data analysis for time. For each of the four de novo birth events, an XYZT coordinate matrix was retrieved, from which the inter-event time were calculated. Experimental n = 68 explants/eggs. (F) Scatter plot of observed inter-event time between the first four de novo biogenesis events. Horizontal lines and error bars represent median and interquartile range, respectively. The first event time is significantly different (**) from subsequent inter-event times (Kruskal–Wallis mean rank test, P = 0.0047). Note that this first event time exhibits high (systematic) variability due to an ill-defined time reference (see Materials and methods). (G) Cumulative distribution functions of observed (continuous) and in silico obtained inter-event time (dashed). Simulations were performed to test if the observed experimental data deviates from a theoretical scenario where all four birth events occurred independently at a constant rate within an explant with similar geometry as in the experiments. Four random events were obtained in 100 simulations of 68 explants. In the simulation, the first event rate of birth was approximated to the inter-event time between the first and second events. The graph depicts the median CDF of the experimentally observed (obs, continuous line) and simulated (sim, dashed line) waiting times between the first and second, second and third, and third and fourth events, while the gray envelope indicates the 95% confidence interval (from quantile 0.025 to 0.975) for the simulations. The observed and simulated waiting time distributions do not overlap, and differ more as centriole number increases, suggesting that the rate of biogenesis is increasing over time. (H) Estimation of the experimental birth rates using maximum likelihood estimation fitting. An exponential distribution with rate λ > 0 was fitted by maximum likelihood estimation to the CDF of each observed waiting time. The estimated rate of de novo centriole assembly is represented in the graph as a function of the number of centrioles previously/already present in the volume.
Figure S3.
Figure S3.
In support of Fig. 3: Spatial analysis of de novo centriole biogenesis in fly explants at different Plk4 concentrations. (A) De novo centriole biogenesis in fly explants at high Plk4 concentration. Left: 2D z projections of the positions of centrioles at the moment they were first detected in the explants, 254 centrioles measured in 68 explants (Observations) and 272 centrioles from 68 in silico explants (Simulations). All coordinates were normalized to the measured explant diameter. Right: Distributions of observed and simulated inter-event distances measured in 3D for the first four centrosomes formed de novo in the explants. (B) De novo centriole biogenesis at lower Plk4 concentration. Left: z projections of the positions of centrioles at the moment they were first detected in the explants, 75 centrioles measured in 20 explants (Observations) and 80 centrioles from 20 in silico explants (Simulations). All coordinates were normalized to the measured explant diameter. Right: Distributions of observed and simulated inter-event distances measured in 3D for the first four centrosomes formed de novo in the explants, at the lowest Plk4 overexpression (0.16 relative concentration of Plk4). The gray envelope indicates the 95% confidence interval (from quantile 0.025 to 0.975) for the simulated data.
Figure S4.
Figure S4.
In support of Fig. 4: Temporal analysis of de novo biogenesis. (A) Scatter plot of observed inter-event time between the first four de novo biogenesis events in the GFP–Plk4 reporter fly line. Note that the fly line overexpresses two copies of Plk4, one of which is tagged with GFP. This higher expression level is a possible explanation for the slightly shorter time until the first de novo event. Horizontal lines and error bars represent median and interquartile range, respectively (n = 9). (B) Scatter plot of observed inter-event time between the first four de novo biogenesis events in the Asl–mCherry reporter fly line overexpressing Plk4. Horizontal lines and error bars represent median and interquartile range, respectively (n = 10). (C) Estimation of the mean centriole biogenesis times at the highest Plk4 concentration (1, in blue) and at the lowest Plk4 overexpression (0.16, in orange) by maximum likelihood estimation fitting of a simple exponential model to data shown in Fig. 4 C. (D) Estimation of the waiting time until the first de novo event and inter-event time between the first and subsequent de novo events, at high (1, in blue) and the lowest (0.16, in orange) concentration of Plk4, after fitting data shown in Fig. 4 C. (E) Model of Plk4 autoactivation and dephosphorylation based on data from (Lopes et al., 2015). Plk4 trans-autophosphorylates to become fully active, transitioning from an enzyme with basal activity, B form, to an activated form phosphorylated on its T-loop residue, A* form. Highly phosphorylated Plk4, A** form, is also active but is targeted for degradation (Cunha-Ferreira et al., 2013; Guderian et al., 2010; Holland et al., 2012; Klebba et al., 2013). Dark arrows indicate the forward phosphorylation reaction flux, while red arrows indicate the reverse dephosphorylation flux catalyzed by a putative counteracting phosphatase. The leftmost dark arrow marks the synthesized Plk4 that enters the system, while the dashed lines refer to Plk4 degradation. Green arrows depict the Plk4 forms that catalyze the forward flux. (F) A nonlinear balance between phosphorylation and dephosphorylation activities generates a Plk4 critical threshold, as a function of its concentration. Therefore, total concentration (active and inactive) of Plk4 in cells likely affects the timing at which a critical concentration threshold is overcome and triggers centriole assembly (Lopes et al., 2015). (G) Fitting of Plk4 autoactivation and dephosphorylation model to data measured in explants at different Plk4 concentrations. The gray gradient represents different concentrations of Plk4. The different concentrations were prepared experimentally by mixing the cytoplasm from high overexpression eggs (taken as the unit 1, black) with cytoplasm from WT eggs, in different proportions such that the dilutions are 0.5, 0.33, and 0.16 relative concentrations. The dots are the relative frequency of explants containing at least one de novo formed centriole for the different concentrations of Plk4: 1 (n = 56), 0.5 (n = 62), 0.33 (n = 39), and 0.16 (n = 25). The lines are the solution of the model of Plk4 trans-autophosphorylation. The continuous lines are the solution of the ordinary differential equation model, and the staircase lines are the results of stochastic simulations under the same parameter settings. The Plk4 activity in the higher concentration (denoted K) was adjusted, whereas the activities in the dilutions were set in relative terms (0.16 K, 0.33 K, and 0.5K). The modeling and simulations, as well as the remaining parameters and values, are described in the Materials and methods (Statistics and mathematical modeling). Notice that as Plk4 concentration decreases, so does the number of explants where centriole biogenesis occurs within 40 min of time-lapse recording.
Figure 4.
Figure 4.
Plk4 concentration modulates the onset of centrosome biogenesis. (A) Inter-event distance at low Plk4 concentration. Cumulative distribution of observed (obs) and simulated (sim) inter-event distances measured in 3D for the first four centrosomes formed de novo in the explants, at the lowest Plk4 overexpression (0.16 relative concentration of Plk4). The gray envelope indicates the 95% confidence interval (from quantile 0.025 to 0.975) for the simulated data. (B) Plk4 titrations were performed by mixing WT and Plk4 overexpressing eggs at different ratios. Time of onset of de novo centriole biogenesis is shown as cumulative distribution function for four relative concentrations of Plk4. Lower concentrations delay the initiation of de novo centriole biogenesis, with a large majority of the individual explants not forming centrioles, at lower concentrations, during the observation time. (C) Time to the first de novo event, and inter-event time between the first and second de novo events in mixed explants with different concentrations of Plk4. In all dilutions tested, the time for the first event to occur is longer, while the first to second inter-event time is unaffected. Median with interquartile range is presented for n = 56, n = 62, n = 39, and n = 25 explants at 1, 0.5, 0.33, and 0.16 relative concentration of Plk4, respectively. (D) The duplication time of the first centriole formed de novo is similar at high (1) and low Plk4 concentration (0.16). Centrioles formed de novo duplicate, on average, 3 min after their biogenesis, at both high (1, n = 44 centrioles) and the lowest (0.16 Plk4 dilution, n = 20 centrioles) concentrations of Plk4 investigated. The horizontal lines and error bars represent the respective median and interquartile distance. The duplication time is not statistically different between the two conditions (Mann–Whitney test, P = 0.59).
Figure S5.
Figure S5.
In support of Fig. 5: FCS analysis of Drosophila embryos. (A) Maximum intensity z projections from a time-lapse video of a syncytial D. melanogaster embryo expressing endogenous mNeonGreen-Plk4 (green) and MT reporter RFP–β-tubulin (magenta). Plk4 localizes at the centrosomes (high-intensity tubulin spots) in interphase. Larger green dots result from yolk auto-fluorescence. At time point t = 00:00, the embryo is in metaphase of nuclear cycle 11. The insets show the progression of a single nucleus and its daughters throughout one cell cycle. The cell cycle stage is indicated above each image. Time is reported as minutes:seconds. The asterisk indicates an abnormal mitotic spindle. (B) FCS measurements of purified mNeonGreen fluorophore in a buffer supporting viability of the cytoplasm (Telley et al., 2013). (C) FCS measurements of mNeonGreen after injection into the cytosol of syncytial embryos expressing RFP–β-tubulin. The graphs show the normalized, fitted ACFs (blue dots and light blue curve), with SD (shaded area) and MEMfit (red line). The time lags (diffusion times) determined using the two fitting methods shown next to the MEMfit curves are in agreement. The peak at the fast time scale corresponds to the triplet state of the fluorophore (9.48 × 10⁻⁶ s in solution; 22 × 10−6 s in the cytoplasm), whereas the second peak in the slower time scale corresponds to the 3D diffusion of mNeonGreen, from which a diffusion coefficient D was calculated (1.59 × 10⁻⁴ s, D = 85.21 µm2/s in solution; 6.54 × 10⁻⁴ s, D = 20.72 µm2/s in the cytoplasm). The residuals obtained from the best fit are shown below the ACF graphs. (D) Single-molecule mNeonGreen–Plk4 quantifications in the cytosol of the syncytial fly embryo. i: Intensity traces of mNeonGreen–Plk4 (black) and background noise (gray). Of note, intensity bursts of mNeonGreen–Plk4 are well distinguishable from background noise (inset). ii: Raw ACFs from multiple independent FCS measurements. While the intensity of background acquisitions as measured in RFP–tubulin expressing embryos does not auto-correlate, traces from mNeonGreen–Plk4 expressing embryos exhibit significant autocorrelation.
Figure 5.
Figure 5.
Single-molecule mNeonGreen-Plk4 quantifications in the cytosol of the syncytial fly embryo by FCS. (A) Normalized fitted ACF (Fit, light blue dashed line), with SD (shaded area) and MEMfit distributions (Distribution, red line) for mNeonGreen-Plk4 in the cytoplasm. Based on the two fitting methods, three times scales were determined: the fastest time scale peak corresponds to the triplet state of the fluorophore (7.85 × 10⁻⁶ s); whereas the second and third slower time scales correspond to distinct 3D diffusional mobility of mNeonGreen-Plk4 in the cytoplasm, from which the diffusion coefficients (D) were calculated (fastest fraction: 7.89 × 10⁻⁴ s, D = 17.2 µm2/s; slower fraction: 9.11 × 10⁻³ s, D = 1.49 µm2/s). The residuals from the fitted data (Fit) are shown below the graphs. (B) Plk4 undergoes limited oligomerization in the cytosol of the Drosophila blastoderm embryo. The mNeonGreen distribution was fitted to a Weibull distribution, which has a peak value of 4,100 Hz. Next, the mNeonGreen–Plk4 data were fitted with an additional Weibull distribution (one for monomer-like and another for oligomer-like). The second mNeonGreen-Plk4 distribution peaks at 18,450 Hz. From this analysis, it follows that the overall normalized brightness (intensity per particle, mean ± SD) for mNeonGreen–Plk4 in the cytoplasm is higher than for the single mNeonGreen monomer injected into the cytoplasm at a similar concentration, indicating that Plk4 is present both as a monomer (around 30.1% of its diffusing pool) and as low-order oligomers (69.9% of diffusing mNeonGreen–Plk4 pool).
Figure 6.
Figure 6.
De novo centriole biogenesis is partially impaired in PCM-depleted Drosophila cells. (A) DMEL-cultured cells were treated with RNAi against Plk4 over the course of 12 d to deplete their centrioles. mCherry (mCh) RNAi was used as negative control. Cells treated with RNAi against Plk4 gradually lost centrioles during proliferation. On day 10, samples were obtained for fixation and staining, and centriole-depleted cells were treated with RNAi against individual PCM components. On day 12, Plk4 translation was allowed to recover. On day 16, cells were fixed and stained by immunofluorescence (IF). We targeted for individual PCM components—Cnn, Asl, D-Plp, Spd2, or γ-tubulin 23C—or combinations of these molecules previously shown to be essential for PCM assembly in cycling cells—Cnn + Spd2, Cnn + D-Plp, Spd2 + D-Plp, or Cnn + Spd2 + D-Plp (Gomez-Ferreria et al., 2007; Conduit et al., 2014; Lerit et al., 2015; Feng et al., 2017; Citron et al., 2018). Additionally, we depleted all four PCM components—Cnn + Asl + D-Plp + Spd2 (referred to as All PCM)—required for PCM maintenance (Pimenta-Marques et al., 2016). (B) Maximum-intensity z projections of fluorescence from DMEL cells after 10 d treatment with RNAi against Plk4 (top row) or mCherry (mCh, bottom row). Cells were stained for centriolar markers Sas4 (magenta) and Cp110 (green), in addition to DAPI against DNA (blue). Inset squares in each fluorescence channel are shown at higher magnification on the right (scale bar, 1 µm). Knock-down of Plk4 (bottom row) caused loss of centrioles, as reported by the absence of spot signals in the green and magenta channels. Note that it is common for a small fraction of untreated DMEL cultured cells to have either too many (more than four) or too few (less than two) centrioles (Bettencourt-Dias et al., 2005). This is found in most cell lines from D. melanogaster as they are permissive to those changes. In contrast to vertebrate cells, a p53-dependent cell cycle arrest does not occur in the presence of numerical centrosome abnormalities in these insect cells. (C) Maximum-intensity z projections of fluorescence from centriole-depleted DMEL cells after 6 d treatment with RNAi against mCherry (top row), allowing recovery of normal centriole number, or against γ-tubulin 23C (bottom row) leading to little or no recovery of centrioles. Staining, color code, and insets are as in B. (D) Quantification of cells with centrioles after 10 and 16 d of RNAi treatment. Centriole number was scored in >300 cells per treatment, per experiment. The bars represent the average of proportions obtained in two or four independent experiments (gray squares) for the conditions listed. Superscripts denote statistical significance in treatments. ns (not significant), P ≥ 0.05; *, P < 0.05; ***, P < 0.001 (Pearson’s χ2 test, and two-proportions z test on pooled data). The top dashed arch denotes statistical difference between the mCh (control) and every other condition. γ-tub, γ-tubulin.
Figure 7.
Figure 7.
De novo centriole biogenesis is partially impaired in unfertilized eggs overexpressing Plk4 after depletion of γ-tubulin. (A) Maximum-intensity z projections of fluorescence from unfertilized eggs overexpressing Plk4 alone (control) or together with RNAi against γ-tubulin 23C, γ-tubulin 37C, or a combination of both. Eggs were stained against Bld10 (cyan), Ana1 (yellow) and tyrosinated α-tubulin (magenta). Centrioles were identified by colocalization of spot-like signals from at least two of the three reporters. Inset squares in each fluorescence channel are shown at higher magnification on the right (scale bar, 3 µm). Orange asterisks reveal putative meiotic defects, previously described to occur in oocytes from γ-tubulin 37C mutant females (Tavosanis et al., 1997). In these example images, the control shows signal spots in all channels, while in RNAi conditions, some reporter signals were present (white square) and others absent (orange square) in the fewer centrosome-like dots observed. Note that in the double knock-down condition (γ-tubulin 23C+37C) we did not detect any signal from tyrosinated α-tubulin despite the presence of some centrosome-like dots bearing centriolar reporters (two examples are shown, i and ii). (B) Quantification of eggs with centrioles depleted of γ-tubulin 37C alone, or in combination with depletion of γ-tubulin 23C. The presence of centrioles was scored by the concomitant detection of at least two centrosomal reporters. n = 30 eggs (control); n = 49 eggs (γ-tubulin 23C); n = 47 eggs (γ-tubulin 37C); n = 54 eggs (γ-tubulin 23C + 37C). ns (not significant), P ≥ 0.05; **, P < 0.01; *, P < 0.001 (Pearson’s χ2 test, and two-proportions z test on pooled data). α-Tub, α-tubulin.

Similar articles

Cited by

References

    1. Aldrich, H.C. 1967. The ultrastructure of meiosis in three species of Physarum. Mycologia. 59:127–148. 10.1080/00275514.1967.12018400 - DOI - PubMed
    1. Aydogan, M.G., Steinacker T.L., Mofatteh M., Gartenmann L., Wainman A., Saurya S., Conduit P.T., Zhou F.Y., Boemo M.A., and Raff J.W.. 2019. A free-running oscillator times and executes centriole biogenesis. BioRxiv. doi: (Preprint posted January 3, 2019)10.1101/510875v1 - DOI
    1. Banterle, N., and Gönczy P.. 2017. Centriole Biogenesis: From Identifying the Characters to Understanding the Plot. Annu. Rev. Cell Dev. Biol. 33:23–49. 10.1146/annurev-cellbio-100616-060454 - DOI - PubMed
    1. Bauer, M., Cubizolles F., Schmidt A., and Nigg E.A.. 2016. Quantitative analysis of human centrosome architecture by targeted proteomics and fluorescence imaging. EMBO J. 35:2152–2166. 10.15252/embj.201694462 - DOI - PMC - PubMed
    1. Bettencourt-Dias, M., Sinka R., Frenz L., and Glover D.M.. 2004. RNAi in Drosophila Cell Cultures. In Gene Silencing by RNA Interference: Technology and Application. Sohail M., editor. CRC Press, Inc.. pp. 147–166.

Publication types