. 2021 Jul 6;33(7):1418-1432.e6.
doi: 10.1016/j.cmet.2021.03.001. Epub 2021 Mar 23.

Top-down control of conditioned overconsumption is mediated by insular cortex Nos1 neurons

Affiliations

Top-down control of conditioned overconsumption is mediated by insular cortex Nos1 neurons

Sarah A Stern et al. Cell Metab. .

Abstract

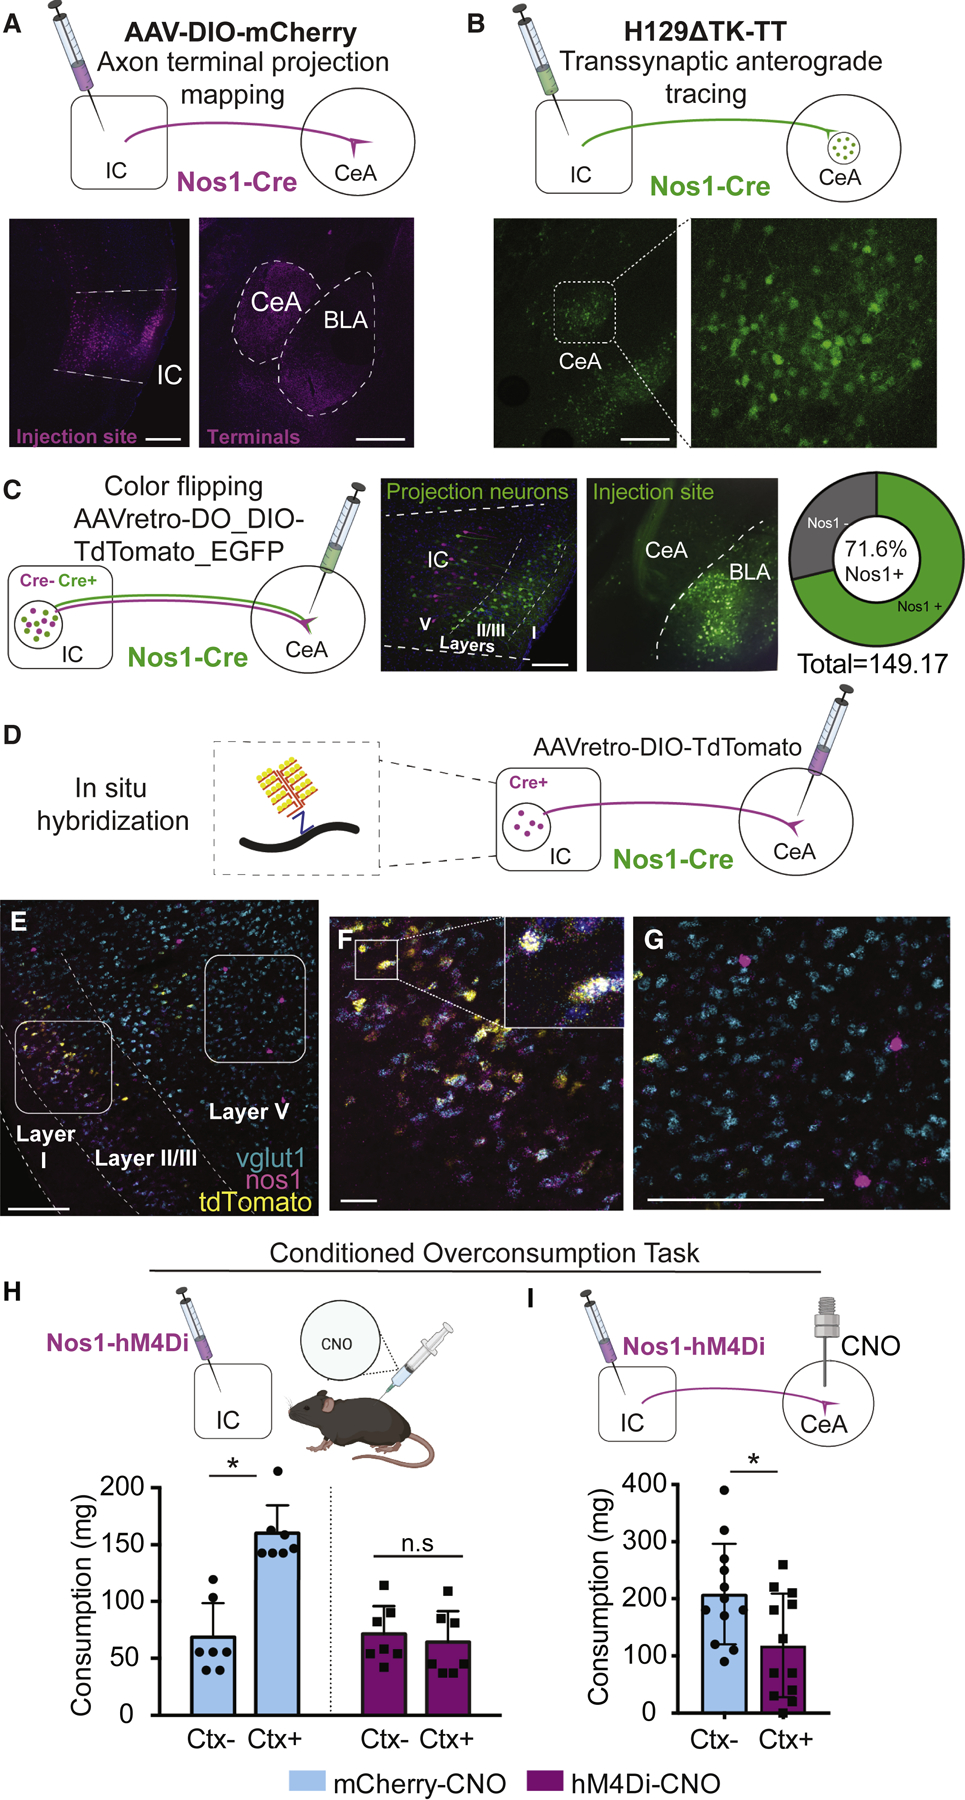
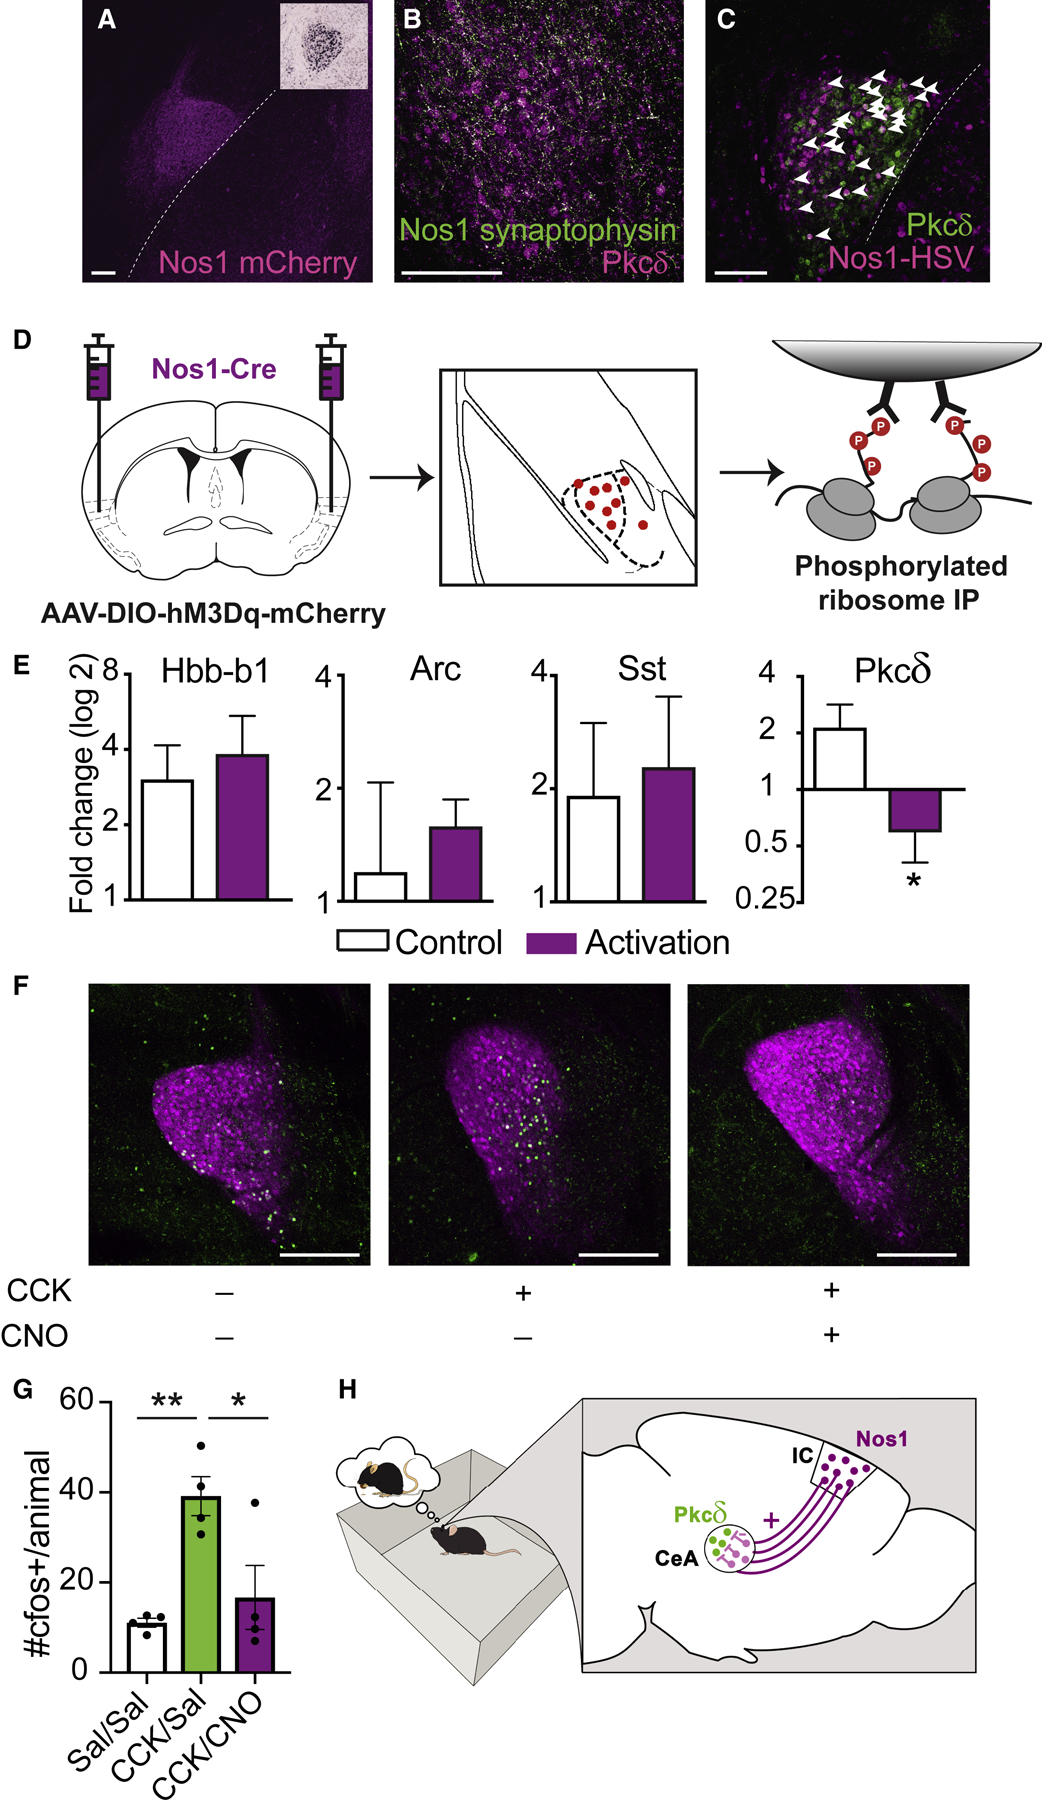
Associative learning allows animals to adapt their behavior in response to environmental cues. For example, sensory cues associated with food availability can trigger overconsumption even in sated animals. However, the neural mechanisms mediating cue-driven non-homeostatic feeding are poorly understood. To study this, we recently developed a behavioral task in which contextual cues increase feeding even in sated mice. Here, we show that an insular cortex to central amygdala circuit is necessary for conditioned overconsumption, but not for homeostatic feeding. This projection is marked by a population of glutamatergic nitric oxide synthase-1 (Nos1)-expressing neurons, which are specifically active during feeding bouts. Finally, we show that activation of insular cortex Nos1 neurons suppresses satiety signals in the central amygdala. The data, thus, indicate that the insular cortex provides top-down control of homeostatic circuits to promote overconsumption in response to learned cues.

Keywords: RNA sequencing; amygdala; associative learning; feeding; insular cortex; nitric oxide synthase-1.


Conflict of interest statement

Declaration of interests The authors declare no competing interests.

Figures

Figure 1.
Figure 1.. The insular cortex is required for conditioned overconsumption, but not homeostatic feeding.
(A) Behavioral schematic of the conditioned overconsumption task, chemogenetic inhibition strategy and representative injection area. (B-C) Food intake, measured in milligrams (mg) and plotted as cumulative intake over 30 minutes during training (B) or 20 minutes during testing in the conditioned overconsumption task (C). Mice were injected with either CNO (mCherry: dark blue bars, n=4; hM4Di: purple bars, n=10) or saline (hM4Di: light blue bars, n=5) before the testing session (two-way RM ANOVA, F(1,16)=14.04, **p=0.0018 followed by Holm’s-Sidak multiple comparisons). (D) Food intake, measured in grams (g) and plotted as cumulative intake over a 24 hour period (Overnight feeding, n=4–8). (E) Food intake, measured in g, and plotted as the cumulative intake in 1 hour following an overnight fast (Post-fast feeding, n=12). (F) Time, measured in seconds (s) spent in the open arms of an elevated plus maze (EPM) (n=10–11). (G) Velocity, measured in centimeters transversed per s (cm/s) (n=7). See also Figure S1.
Figure. 2:
Figure. 2:. Insular Cortex ➜ CeA projection neurons are required for conditioned overconsumption
(A) Representative images of terminal projection mapping (left) from CaMKII-mCherry expression in the insular cortex injection site (middle) and in axon terminals in the central amygdala (right). (B) Representative image of retrograde tracing (left) from AAVretro-GFP expression in the central amygdala injection site (right) and labelled cell bodies in the insular cortex (middle). (C) DREADD-based activity mapping strategy (left). Quantification (middle) of cfos+ cells in the central amygdala in mice injected with saline compared to CNO and representative images (right). (Nested t-test: t=6.98, df =11, ****P<0.0001). Cfos within the CeA is denoted by white arrows. (D) Food intake, measured in mg, of mice expressing hM4Di in the insular cortex and injected with CNO or saline into the CeA prior to the overconsumption test (n=4–5, two-way ANOVA followed by Holm-Sidak’s multiple comparison test, CNO: F(1,14)=5.2, *P=0.04, CS: F(1,14)=11.0, **P=0.005, Interaction: F(1,14)=4.9, *P=0.04,.) (E) Food intake, measured in g, and plotted as cumulative intake of mice expressing hM4Di in the insular cortex and injected with CNO or saline into the CeA prior to refeeding for 1 hour (n=11–12). (F) The percentage of time spent (%) in the stimulated side of an RTPP chamber in mice expressing Arch3.0 in insular cortex ➜ CeA projection neurons (n=6, unpaired t-test, t=2.3, df=10, *P=0.04). (A-F) Scale bars, 400µm. IC: Insular Cortex; BLA: Basolateral Amygdala; CeA: Central Amygdala. Anatomical borders are denoted by dashed white lines. See also Figure S2.
Figure 3:
Figure 3:. Molecular identification of Insular Cortex ➜ CeA projection neurons.
(A) Retro-TRAP experimental strategy. Syn-NBL10 mice were injected with CAV-GFP into the central amygdala and polysomes bound by GFP in the insular cortex were precipitated out, representing the insular cortex CeA projection neurons. Lower left, the fold change of positive (Gfp, green) and negative (Gfap and Mal, black) controls run by qPCR. (B) Plot depicting the average IP value and average Input values (log2) of all genes detected during sequencing. Genes significantly enriched with a q-value <0.05 are represented in green. Genes significantly depleted with a q-value <0.05 are represented in yellow. Selected genes of interest are highlighted in magenta. (C) Representative in situ hybridization images and accompanying average values in FPKM of the Input and IP fractions of genes enriched in the Insular Cortex Layer II/III region (courtesy of Allen Brain Atlas). Individual data points represent individual FPKM values. Significance is noted as differential gene expression q-values (n=3, pooled groups of 4–5 mice each). (D) Enrichment of additional Nitric Oxide – cGMP pathway genes in the IP fraction compared to the Input. Individual data points represent individual FPKM values. Significance is noted as differential gene expression q-values (n=3, pooled groups of 4–5 mice each). See also Table S1 and Figure S3.
Figure 4.
Figure 4.. Glutamatergic Insular Cortex Nos1 neurons project to the CeA and are necessary for conditioned overconsumption
(A) Representative images of terminal projection mapping (top) from DIO-mCherry expression in the insular cortex injection site of Nos1-Cre mice (left) and axon terminals in the CeA (right). Scale bar, 400µm. (B) Representative images of central amygdala neurons (top) of mice injected with the transsynaptic anterograde tracer H129∆TK-TT in the insular cortex of Nos1-Cre mice (left, inset is magnified to the right). Scale bar, 400µm. (C) Representative images of Nos1-Cre mice injected with a color-flipping Cre-dependent retrograde AAV in the CeA (left). Nos1+ cells (green) and Nos1- cells (magenta) are labeled in the insular cortex and the CeA injection side is shown with Nos1+ fibers (middle). Scale bar, 150µm. Quantification of the percentage of Nos1+ neurons in the CeA projecting population (right) averaged from n=4 mice. (D) Viral tracing and in situ hybridization strategy. (E) Representative in situ hybridization in the insular cortex of vGlut1 (cyan), Nos1 (magenta) and tdTomato (yellow) from Nos1-Cre mice injected with AAVretrograde-FLEX-tdTomato into the CeA. Scale bar, 200µm. Left inset of (E) is magnified in (F), depicting layer II/III neurons expressing all three markers. Scale bar, 40µm The right inset of (E) is magnified in (G) depicting putative Nos1 interneurons neurons that do not express vGlut1. Scale bars, 200µm. (H) Nos1-Cre mice injected with AAVs encoding hM4Di or control vector (left) in the insular cortex were tested for their overconsumption response in either the Ctx+ or Ctx- (right). Food intake, measured in mg, of Nos1-Cre mice expressing hM4di (purple bars) or mCherry (blue bars) and injected with CNO prior to the overconsumption test. (Interaction: F(1,12)=4.34, P=0.059; CS: F (1, 12) = 3.173, P=0.1002; DREADD: F(1, 12) = 2.546, P=0.1366, with Sidak’s multiple comparisons post-hoc test, *P<0.05, n=7). (I) Nos1-Cre mice injected with AAVs encoding hM4Di or control vector (left) in the insular cortex and implanted with cannula over the CeA for local CNO infusion. They were tested for their overconsumption response in either the Ctx+. Food intake, measured in mg, of Nos1-Cre mice expressing hM4di (purple bars) or mCherry (blue bars) and injected with CNO prior to the overconsumption test (Unpaired t-test: t=2.47, df =22, *P=0.022, n=11–12). See also Figure S4–S5.
Figure. 5:
Figure. 5:. Insular Cortex Nos1 neurons are activated during consumption bouts
(A) Sample trace of Nos1:GCaMP6s fluorescence of one mouse during the training session of the conditioned overconsumption task. Food consumption bouts are noted by blue bars above the trace. Selected bouts are magnified in the insets below. (B) Heatmap of peri-event time plots (PETP) of Nos1:GCaMP6s fluorescence around investigation of the empty food cup (Habituation), consumption bouts (Training and Testing, Ctx+) and investigation of food Testing, Ctx-). Individual bouts are depicted in each row. Bouts from individual mice are denoted by lefthand brackets (n=4 mice). Blue arrows and white dashed lines represent the onset of consumption or investigation. Corresponding PETP of Nos1:GCaMP6s fluorescence depicted in Zscore is shown below each heatmap. Dark line and lighter shading indicates mean ± SEM of change in fluorescence for that group of mice. Blue arrows represent the onset of consumption or investigation. Quantification of the area under the curve (AUC) before and after the commencement of the relevant behavior is inset into the Z-score graph. (n=4, *p<0.05). See also Figure S6.
Figure 6:
Figure 6:. Insular Cortex Nos1 neurons regulate CeA Pkcδ activity to control food intake
(A) Representative image of Nos1 terminals in the CeA (magenta). Inset depicts Pkcδ in the CeA (Allen Brain Atlas). (B) Representative image of synaptophysin-labeled terminals (green) from the insular cortex of Nos1-Cre mice, localized in the same location as Pkcδ neurons (magenta) in the CeA. (C) Representative image of anterograde tracing (magenta) revealing insular cortex Nos1 neurons that are synaptically connected to Pkcδ neurons (green) in the CeA (white arrows). (A-C) Scale bars, 150µm. (D) Phospho-TRAP experimental scheme. Insular cortex Nos1 neurons were activated with hM3Dq DREADDs and pS6+ neurons in the CeA were immunoprecipitated out one hour later. (E) Fold-change determined by qPCR of quality control (Arc, Hbb-b1) and CeA, (Sst, Pkcδ) markers. (Paired t-test: t=4.822, df=2, *P=0.04) (F) Representative images depicting co-expression of Pkcδ (magenta) and cfos (green) in Nos1-Cre mice injected with AAV-DIO-hM3Dq-mCherry into the insular cortex and injected with saline+saline (left), Cck+Saline (middle) or Cck+CNO (right). Scale bars, 250µm. (G) Quantification of (F) (nested One-Way ANOVA, **p=0.0039 followed by Tukey’s Multiple Comparison Test, **p<0.01, *p,0.05). (H) Model of learned overconsumption in which mice are placed in the food-associated context, leading to Nos1 inhibition of satiety signals in Pkcδ neurons in the CeA. See also Figure S7.

Similar articles

Cited by

References

    1. Baldo BA, Spencer RC, Sadeghian K, and Mena JD (2016). GABA-Mediated Inactivation of Medial Prefrontal and Agranular Insular Cortex in the Rat: Contrasting Effects on Hunger- and Palatability-Driven Feeding. Neuropsychopharmacology 41, 960–970. - PMC - PubMed
    1. Belfort-DeAguiar R, and Seo D (2018). Food Cues and Obesity: Overpowering Hormones and Energy Balance Regulation. Curr. Obes. Rep 7, 122–129. - PMC - PubMed
    1. Berthoud H-R (2007). Interactions between the “cognitive” and “metabolic” brain in the control of food intake. Physiol. Behav 91, 486–498. - PubMed
    1. Berthoud H-R, Münzberg H, and Morrison CD (2017). Blaming the Brain for Obesity: Integration of Hedonic and Homeostatic Mechanisms. Gastroenterology 152, 1728–1738. - PMC - PubMed
    1. Birch LL, McPhee L, Sullivan S, and Johnson S (1989). Conditioned meal initiation in young children. Appetite 13, 105–113. - PubMed

Publication types

MeSH terms