. 2021 Apr 1;108(4):682-695.
doi: 10.1016/j.ajhg.2021.03.010. Epub 2021 Mar 23.

Machine learning-based reclassification of germline variants of unknown significance: The RENOVO algorithm

Affiliations

Machine learning-based reclassification of germline variants of unknown significance: The RENOVO algorithm

Valentina Favalli et al. Am J Hum Genet. .

Abstract

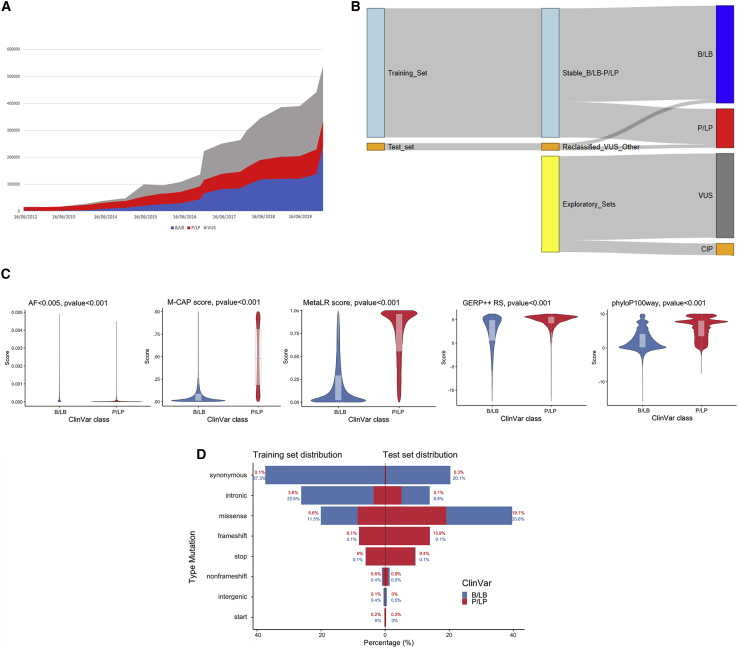
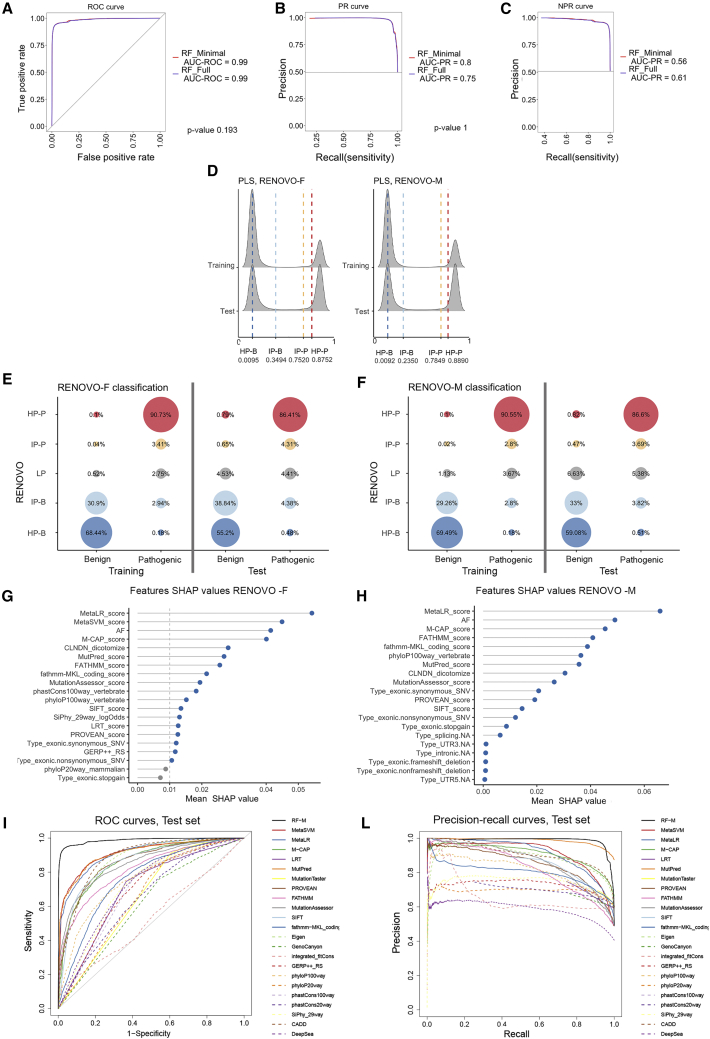
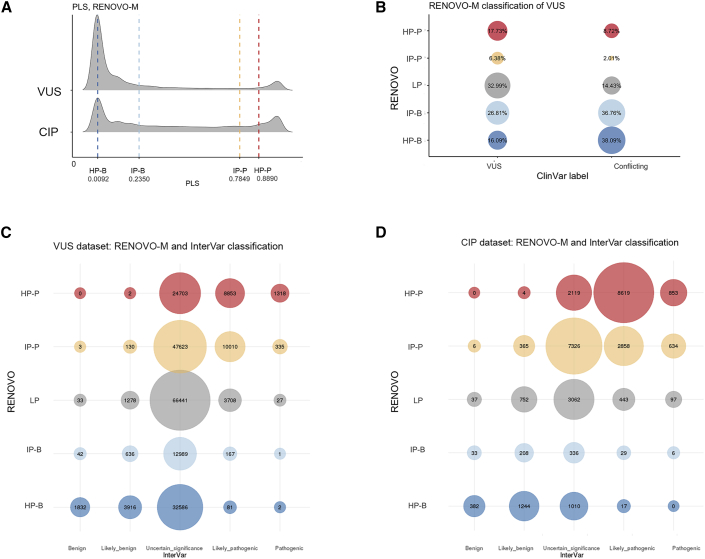
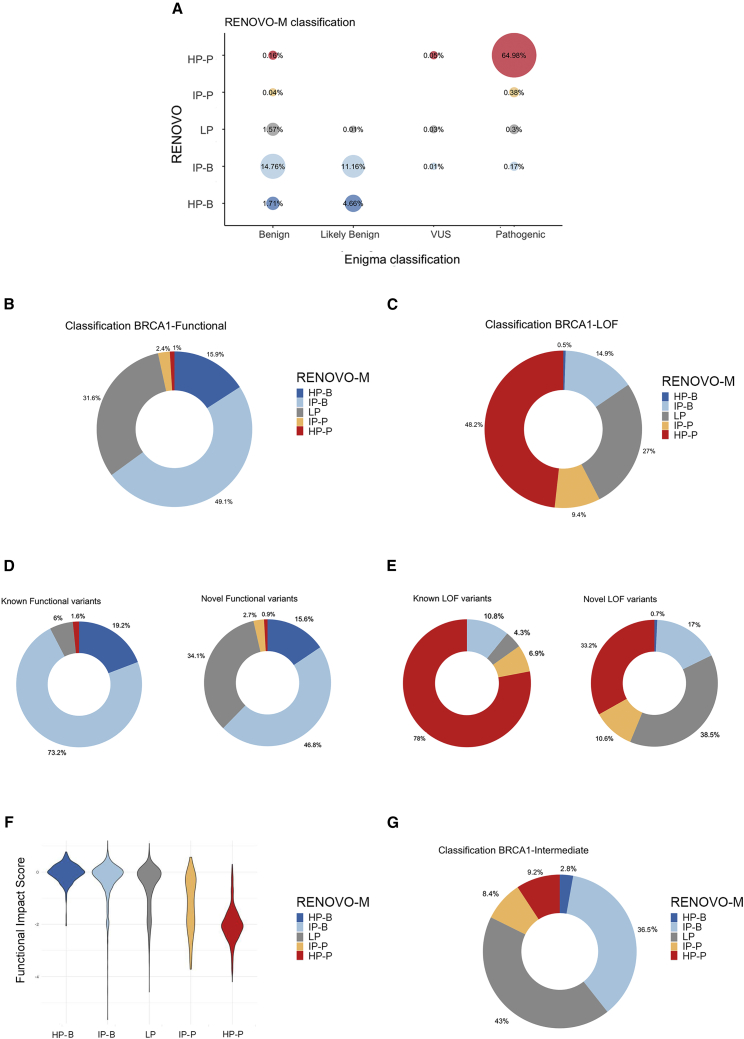
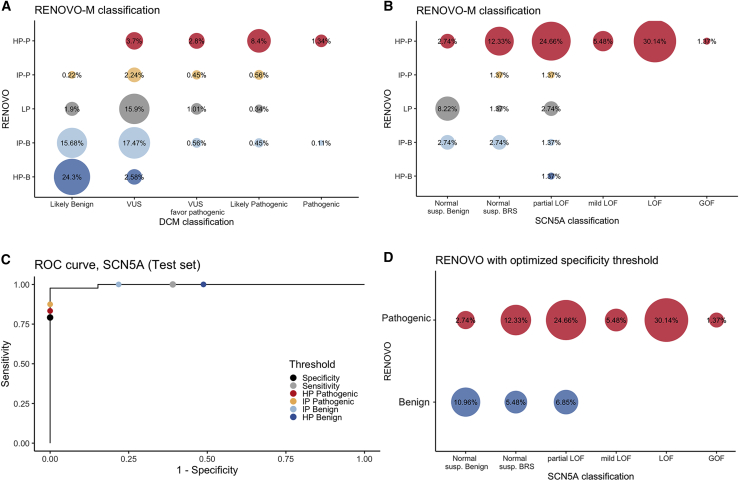
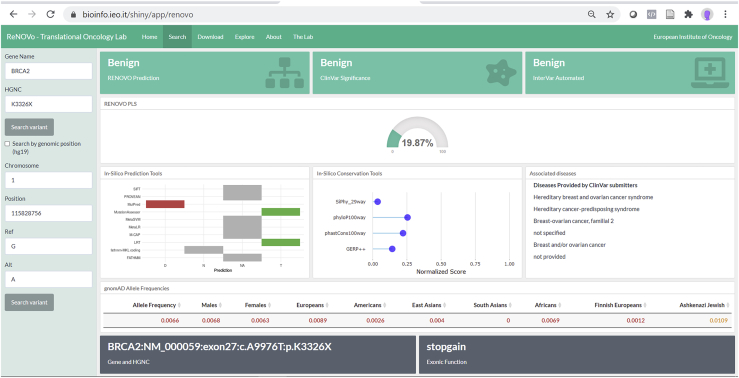
The increasing scope of genetic testing allowed by next-generation sequencing (NGS) dramatically increased the number of genetic variants to be interpreted as pathogenic or benign for adequate patient management. Still, the interpretation process often fails to deliver a clear classification, resulting in either variants of unknown significance (VUSs) or variants with conflicting interpretation of pathogenicity (CIP); these represent a major clinical problem because they do not provide useful information for decision-making, causing a large fraction of genetically determined disease to remain undertreated. We developed a machine learning (random forest)-based tool, RENOVO, that classifies variants as pathogenic or benign on the basis of publicly available information and provides a pathogenicity likelihood score (PLS). Using the same feature classes recommended by guidelines, we trained RENOVO on established pathogenic/benign variants in ClinVar (training set accuracy = 99%) and tested its performance on variants whose interpretation has changed over time (test set accuracy = 95%). We further validated the algorithm on additional datasets including unreported variants validated either through expert consensus (ENIGMA) or laboratory-based functional techniques (on BRCA1/2 and SCN5A). On all datasets, RENOVO outperformed existing automated interpretation tools. On the basis of the above validation metrics, we assigned a defined PLS to all existing ClinVar VUSs, proposing a reclassification for 67% with >90% estimated precision. RENOVO provides a validated tool to reduce the fraction of uninterpreted or misinterpreted variants, tackling an area of unmet need in modern clinical genetics.

Keywords: ClinVar; VUS; machine learning; reclassification; variant interpretation.


Conflict of interest statement

The authors declare no competing interests.

Figures

Figure 1
Figure 1
ClinVar datasets overview (A) Variants over time. Trend of the total number of variants present in ClinVar, divided by the three main categories of clinical significance: blue for benign (B/LB) variants growth, red for pathogenic (P/LP), and gray for VUSs. (B) Sankey diagram showing the construction of the different datasets coming from ClinVar. RENOVO training and test set come both from B/LB and P/LP variants that never changed classification and that were reclassified, respectively. VUSs and conflicting interpretation of pathogenicity (CIP) variants are used as an application of RENOVO. (C) Feature distribution: violin plots for four numerical features of the training set are displayed (AF < 0.005, M-CAP and Meta-LR functional scores, GERP++_RS and phyloP100way_vertebrate conservation scores). Blue is used for distribution in the B/LB class and red for the P/LP class. Boxplots are shown in gray. p values from Wilcoxon rank-sum test are added for each feature. (D) Variant type distributions in training set (left) and test set (right). For each mutation type, the percentage of B/LB and P/LP variants over the total in the corresponding set is displayed. Blue is used for the B/LB class and red for the P/LP class.
Figure 2
Figure 2
RENOVO algorithm: Comparison between full and minimal models (A) ROC analysis: ROC curves to evaluate performances of RENOVO-F (blue line) and RENOVO-M (red line). The curves, together with the values of the AUROCs, are showed to compare the two models. The chi-square test p value of AUROC difference is also displayed. (B) Precision-recall curves for RENOVO-F (blue line) and RENOVO-M (red line) to evaluate the precision of the models with respect to the P/LP class. AUROCs for the two curves are reported. The chi-square test p value of AUROC difference is also displayed. (C) Negative precision-recall curves to evaluate precision on the B/LB class: results are depicted in blue for RENOVO-F and in red for RENOVO-M. AUCs are reported for both models. (D) Distributions of computed PLS for training and test variants for RENOVO-F (left) and RENOVO-M (right). The density plot is clearly showing a bi-modal distribution with a large separation between the two peaks, suggesting a high degree of confidence in the prediction call. Vertical lines denote the thresholds used to define RENOVO classes: blue lines define HP benign and IP benign classes and red lines HP pathogenic and IP pathogenic. (E) RENOVO results on ClinVar datasets: prioritization results on the training (benign and pathogenic) and test (benign and pathogenic) set for RENOVO-F. Colors follow the classification provided by RENOVO: blue shades for HP and IP benign classes, red shades for HP and IP pathogenic, and gray for LP. Bubble sizes are proportional to the fractions of variants represented. (F) RENOVO results on ClinVar datasets: prioritization results on the training (benign and pathogenic) and test (benign and pathogenic) set for RENOVO-M. Bubble colors and sizes follow the code described in (E). (G) Feature importance with mean SHAP values retrieved for RENOVO-F. To reduce noise, only the first 20 features are shown. The vertical gray line at 0.01 represents the threshold used to keep features in the selection step: gray dots are features below this cutoff. (H) Feature importance with mean SHAP values retrieved for RENOVO-M are displayed. To reduce noise, only the first 20 features are shown. (I) ROC curves obtained by RENOVO-M classification (black continuous line) and by other predictive and functional scores. (L) Precision-recall curves obtained by RENOVO-M (black continuous line) classification and by other predictive and functional scores.
Figure 3
Figure 3
RENOVO-M on VUSs and conflicting variants (A) RENOVO-M distribution of PLS for VUSs and conflicting variants. Vertical lines represent the thresholds used to define classes: blue lines define HP benign and IP benign classes and red lines HP pathogenic and IP pathogenic. (B) RENOVO-M classification of VUSs and conflicting variants. Bubble size is proportional to the percentage represented. Blue colors are for HP and IP benign, red for HP and IP pathogenic, and gray for the LP class. (C) Comparison between RENOVO-M and InterVar classes on VUS ClinVar set: bubble size represents the number of common variants for each RENOVO-M class and InterVar. Colors follow the classification provided by RENOVO: blue shades for HP/IP benign classes, red shades for HP/IP pathogenic, and gray for LP. (D) Comparison between RENOVO-M and InterVar classes on CIP ClinVar set: bubble size represents the number of common variants for each RENOVO-M class and InterVar. Colors follow the same code described in (C).
Figure 4
Figure 4
RENOVO-M validation in BRCA1/2-related context (A) Comparison of RENOVO-M and ENIGMA database on the 7,445 variants reviewed by the ENIGMA Consortium. Bubble size represents the percentage of common variants for each RENOVO-M class and ENIGMA class. Colors follow the classification provided by RENOVO: blue shades for HP-B and IP-B classes, red shades for HP-P and IP-P, and gray for LP. (B) RENOVO-M classification of in vitro functional BRCA1 variants. Dark and light blue represent variants classified as HP and IP benign, red and orange are for HP and IP pathogenic variants, and gray slices for mutations classified as LP. (C) RENOVO-M classification of LOF in vitro BRCA1 variants; colors used as in (B). (D) Separate view of RENOVO-M results on functional BRCA1 variants from functional assay: variants that are already present in ClinVar and on novel variants are represented on the left and the right, respectively. Color code is the same used in (B). (E) Separate view of RENOVO-M results on LOF BRCA1 variants from functional assay: classification of variants that are already present in ClinVar is represented on the left and classification of novel variants on the right. Color code is the same used in (B). (F) RENOVO-M pathogenicity likelihood score versus functional score defined by Findlay in the different RENOVO classes. Colors follow RENOVO-M classification. (G) RENOVO-M classification of intermediate BRCA1 variants. Color code is described in (B).
Figure 5
Figure 5
RENOVO-M validation in DCM-related context (A) Comparison of RENOVO-M and clinical-based classification of the 893 DCM variants. Bubble size represents the percentage of common variants for each RENOVO-M class and DCM class. Colors follow the classification provided by RENOVO: blue shades for HP-B and IP-B classes, red shades for HP-P and IP-P, and gray for LP. (B) Comparison of RENOVO-M and functional classification of 73 SCN5A variants in Glazer dataset. Bubble size represents the percentage of common variants for each RENOVO-M class and SCN5A class. Color code is defined as in (A). “Normal susp. Benign” label stays for the 10 normal suspected benign variants, while “Normal susp. BRS” for the normal suspected Brugada syndrome variants. (C) ROC curve on the test set restricted to the SCN5A gene; effects on specificity and sensitivity of diverse PLS thresholds are represented by different colors. RENOVO-M thresholds for HP-B and IP-B are colored in dark and light blue and those for HP-P and IP-P in red and orange. PLS thresholds optimized for specificity and sensitivity are represented by black and gray dots. (D) Comparison of RENOVO-M optimized for specificity and SCN5A database. Bubble size represents the percentage of common variants for each RENOVO-M class and DCM class. Colors follow the classification provided by RENOVO: blue for benign and red for the pathogenic class.
Figure 6
Figure 6
Dashboard RENOVO web interface: example of results provided by our RENOVO web app when a variant is searched. Variants can be searched with HGVSc; HGVSp entire or partial nomenclatures (e.g., c.A9976T or p.Lys3326); or chromosome, position, reference, and alternative (e.g., 13-32972626-A-T). Interpretations taken from ClinVar and Intervar for the same variants are also displayed, as well as the values of the features used by RENOVO to classify the variant. In this figure, the BRCA2 variant p.Lys3326, which was initially associated with risk of breast and ovarian cancer, then considered as a VUS in agreement with ACMG criteria, and finally reclassified as benign in ClinVar, is reported.

References

    1. Li Q., Wang K. InterVar: Clinical Interpretation of Genetic Variants by the 2015 ACMG-AMP Guidelines. Am. J. Hum. Genet. 2017;100:267–280. - PMC - PubMed
    1. Kopanos C., Tsiolkas V., Kouris A., Chapple C.E., Albarca Aguilera M., Meyer R., Massouras A. VarSome: the human genomic variant search engine. Bioinforma Oxf Engl. 2019;35:1978–1980. - PMC - PubMed
    1. Tavtigian S.V., Greenblatt M.S., Harrison S.M., Nussbaum R.L., Prabhu S.A., Boucher K.M., Biesecker L.G., ClinGen Sequence Variant Interpretation Working Group (ClinGen SVI) Modeling the ACMG/AMP variant classification guidelines as a Bayesian classification framework. Genet. Med. 2018;20:1054–1060. - PMC - PubMed
    1. Esterling L., Wijayatunge R., Brown K., Morris B., Hughes E., Pruss D., Manley S., Bowles K.R., Ross T.S. Impact of a Cancer Gene Variant Reclassification Program Over a 20-Year Period. JCO Precis. Oncol. 2020;4:944–954. - PMC - PubMed
    1. Richards S., Aziz N., Bale S., Bick D., Das S., Gastier-Foster J., Grody W.W., Hegde M., Lyon E., Spector E., ACMG Laboratory Quality Assurance Committee Standards and guidelines for the interpretation of sequence variants: a joint consensus recommendation of the American College of Medical Genetics and Genomics and the Association for Molecular Pathology. Genet. Med. 2015;17:405–424. - PMC - PubMed

Publication types