. 2021 Apr 1;184(7):1706-1723.e24.
doi: 10.1016/j.cell.2021.02.040. Epub 2021 Mar 23.

Archaeogenomic distinctiveness of the Isthmo-Colombian area

Affiliations

Archaeogenomic distinctiveness of the Isthmo-Colombian area

Marco Rosario Capodiferro et al. Cell. .

Abstract

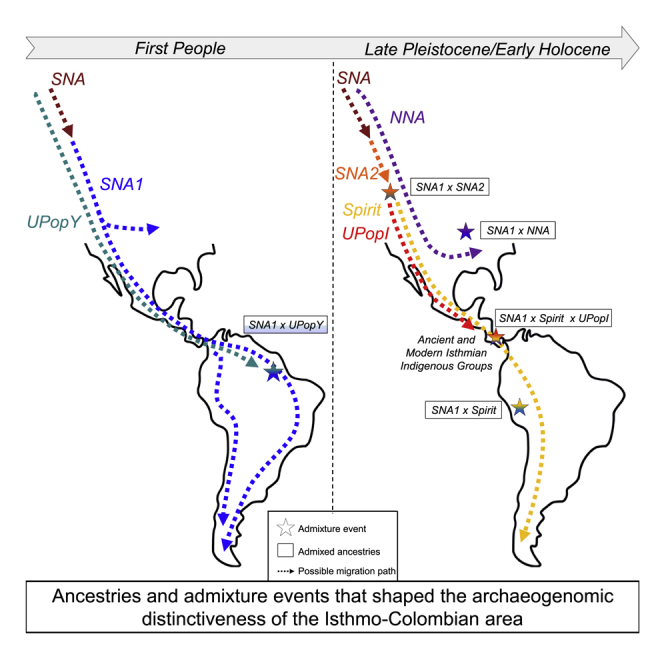
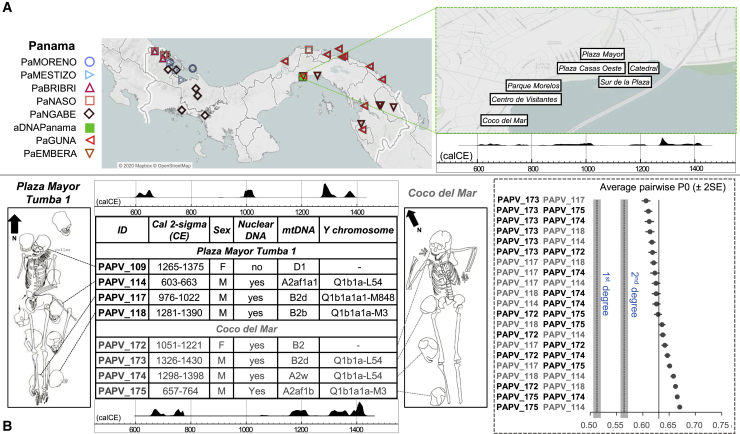
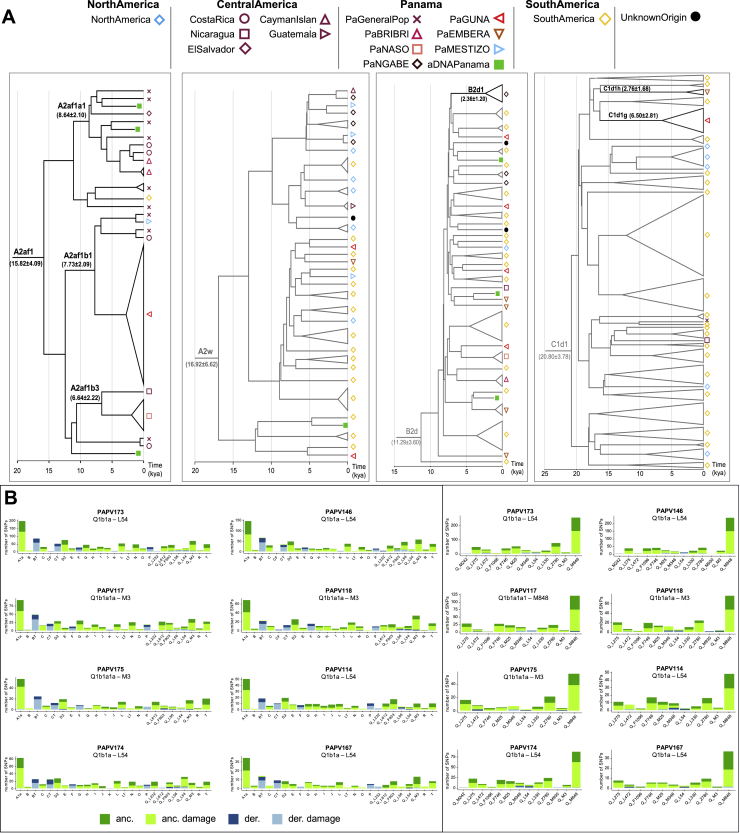
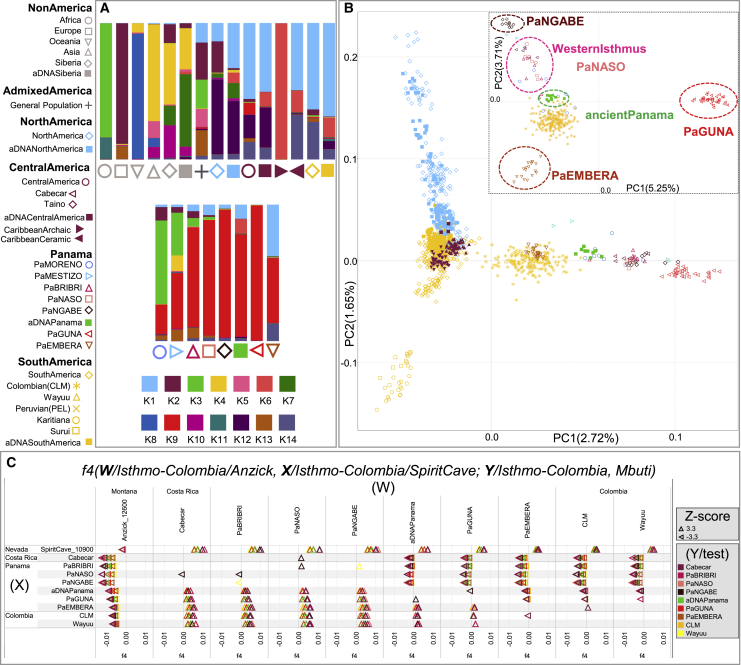
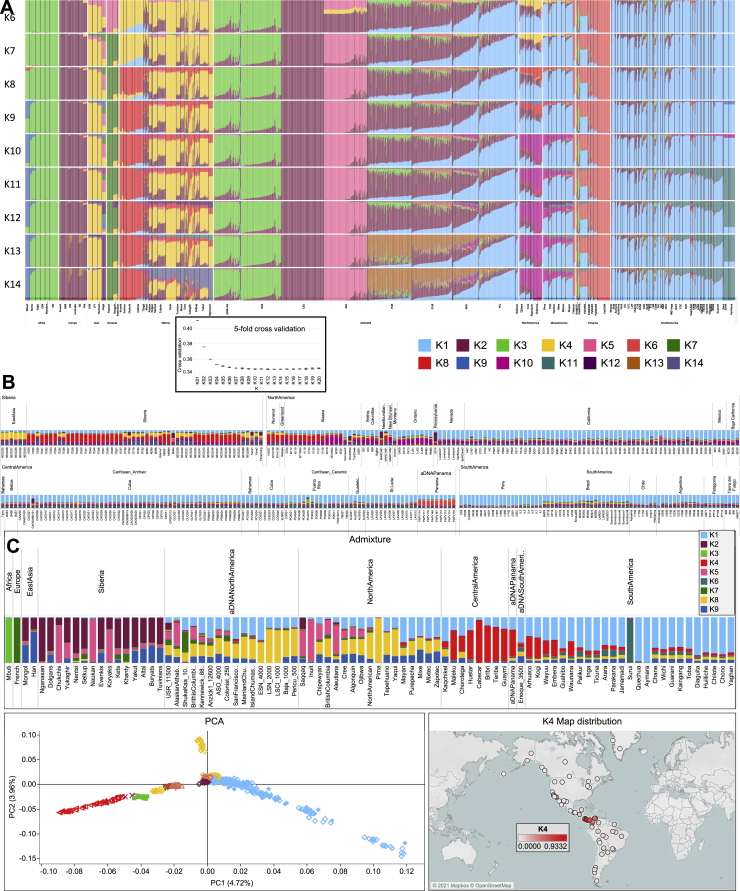
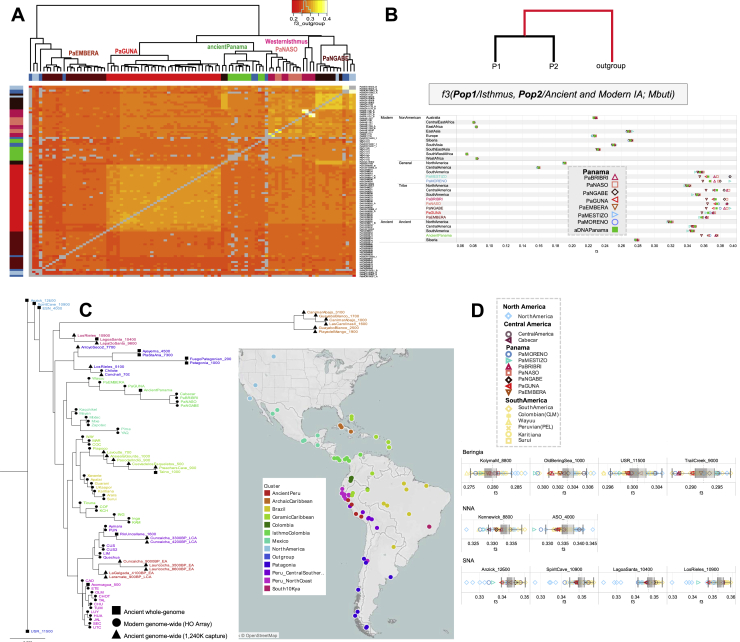
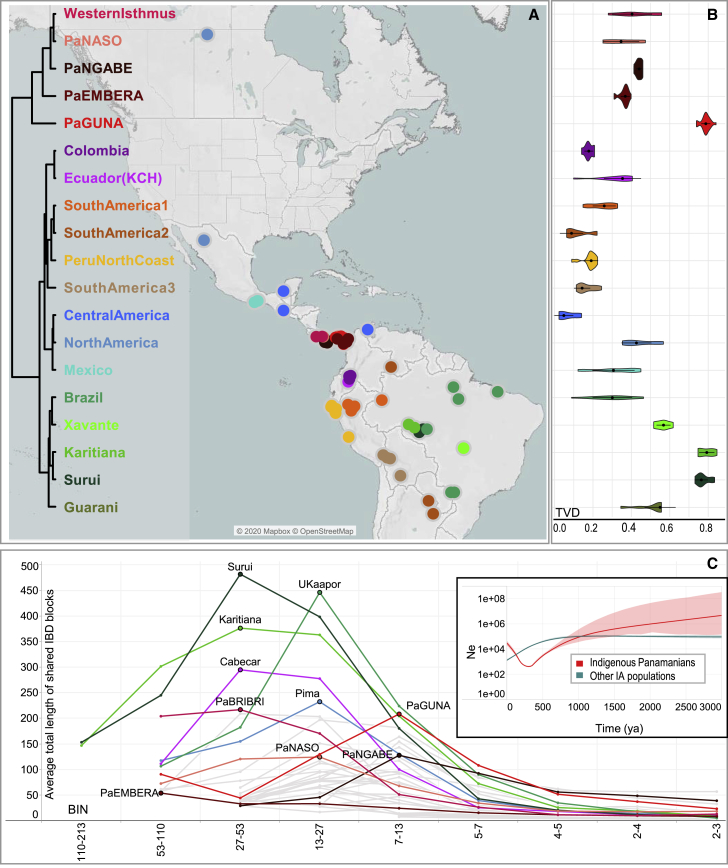
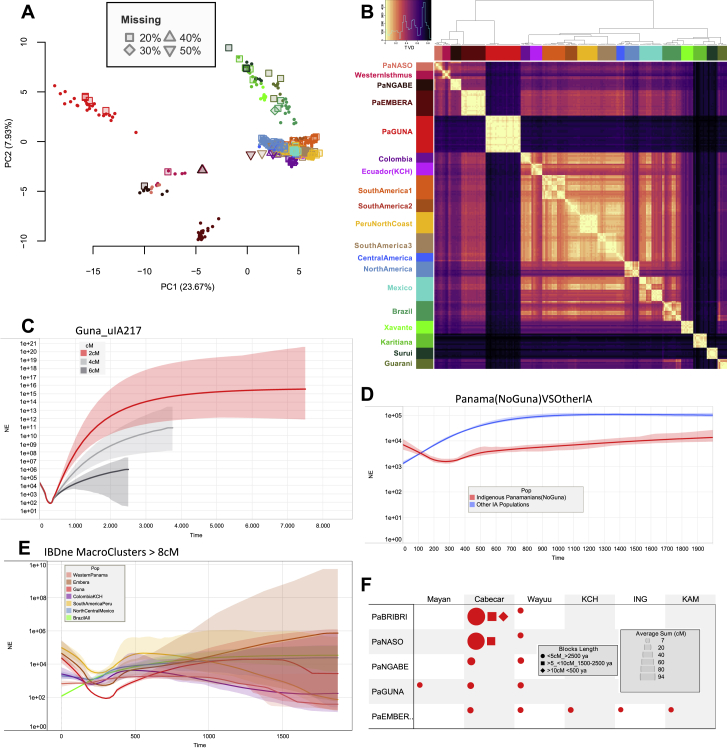
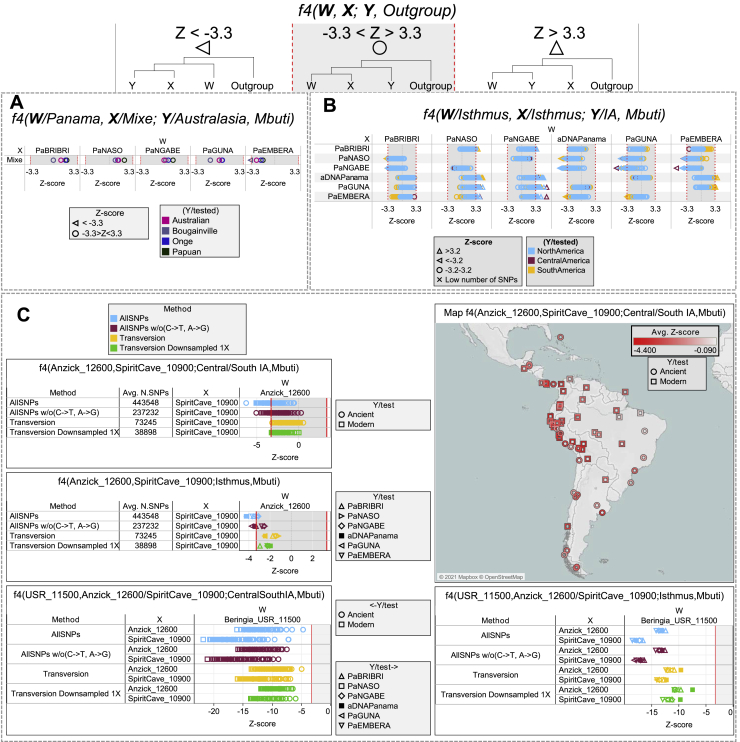
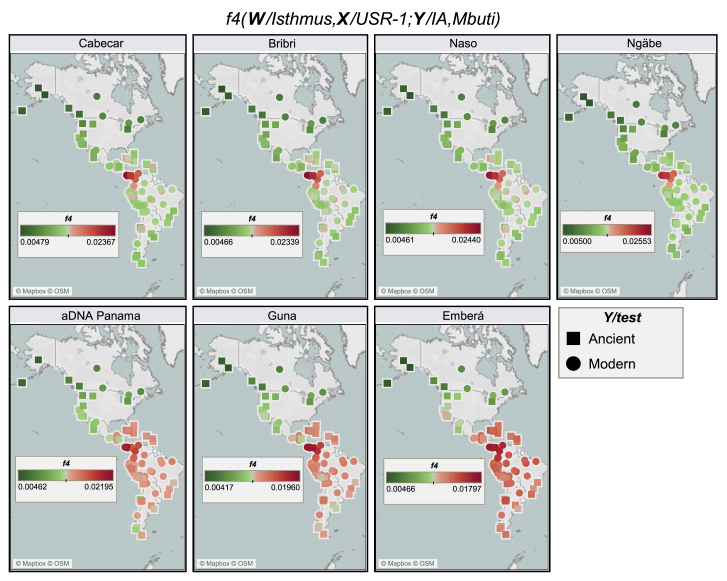
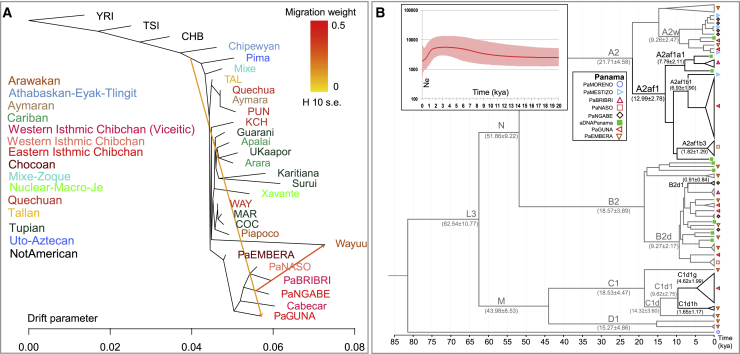
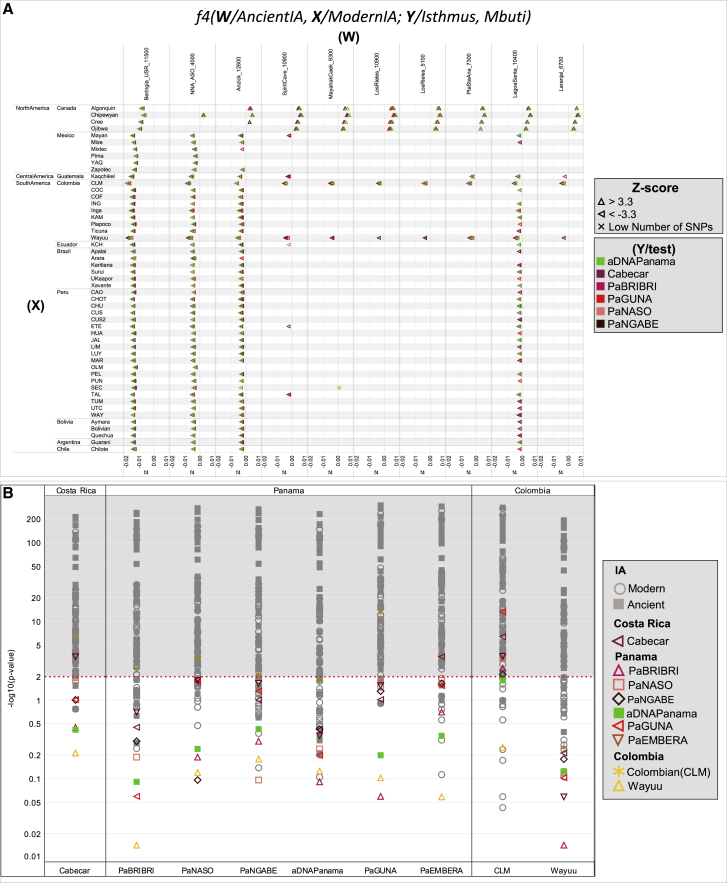
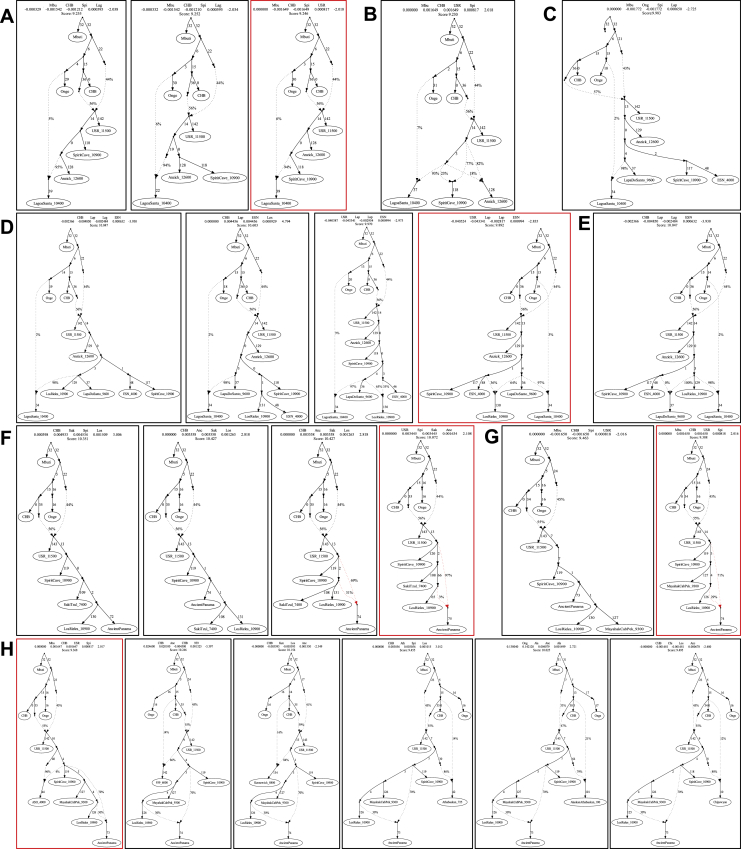
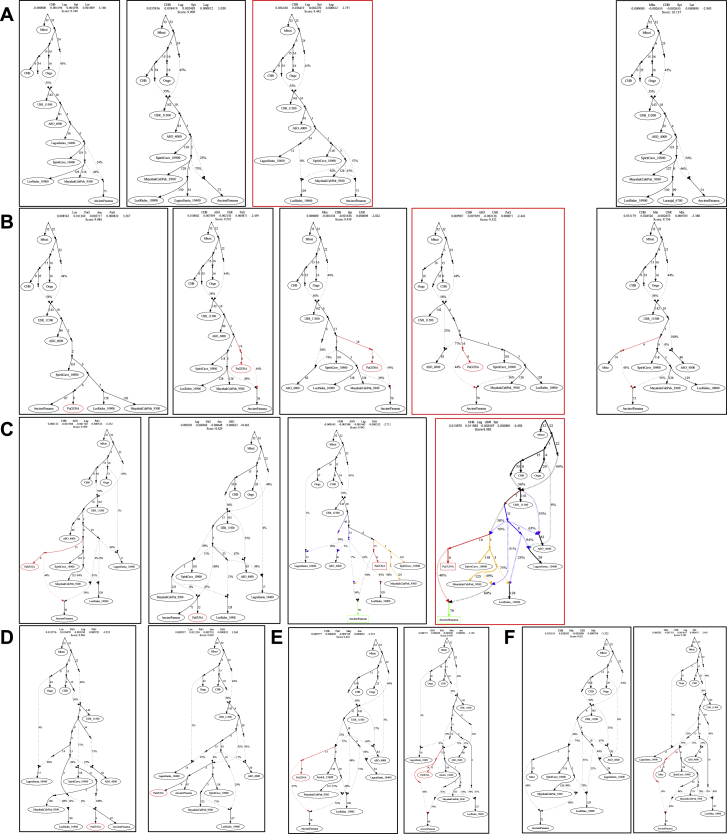
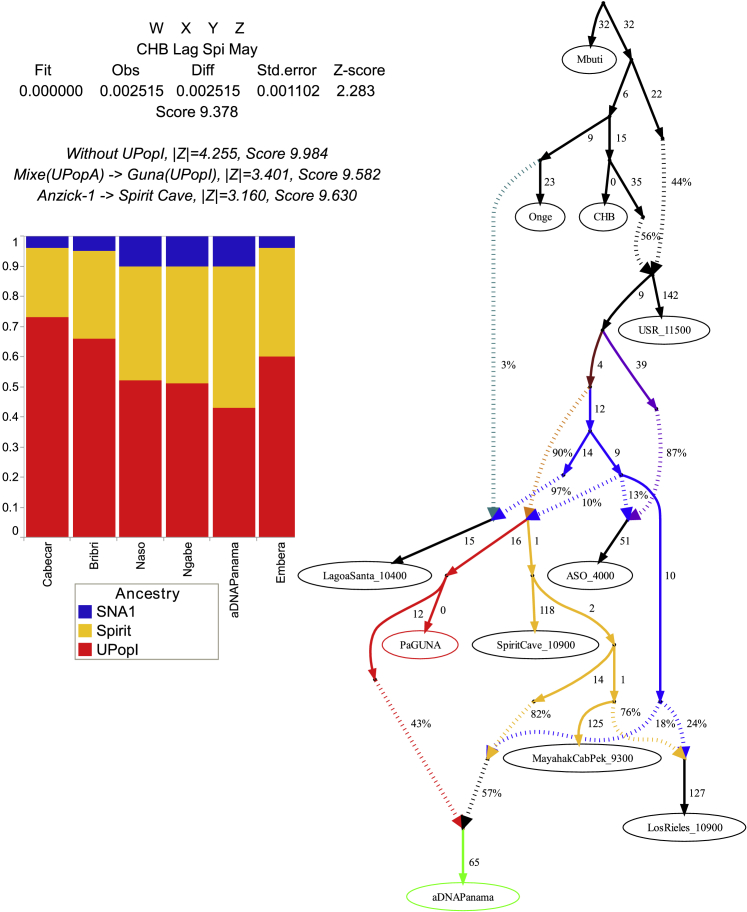
The recently enriched genomic history of Indigenous groups in the Americas is still meager concerning continental Central America. Here, we report ten pre-Hispanic (plus two early colonial) genomes and 84 genome-wide profiles from seven groups presently living in Panama. Our analyses reveal that pre-Hispanic demographic events contributed to the extensive genetic structure currently seen in the area, which is also characterized by a distinctive Isthmo-Colombian Indigenous component. This component drives these populations on a specific variability axis and derives from the local admixture of different ancestries of northern North American origin(s). Two of these ancestries were differentially associated to Pleistocene Indigenous groups that also moved into South America, leaving heterogenous genetic footprints. An additional Pleistocene ancestry was brought by a still unsampled population of the Isthmus (UPopI) that remained restricted to the Isthmian area, expanded locally during the early Holocene, and left genomic traces up to the present day.

Keywords: Central America; Isthmian populations; Panama; ancient and modern DNA; anthropology and history; archaeogenomics; archaeology; genomic variation; indigenous Americans; population genetics.


Conflict of interest statement

Declaration of interests The authors declare no competing interests.

Figures

None
Graphical abstract
Figure 1
Figure 1
Geographic locations and time ranges of modern and ancient individuals sampled (A) Map showing the geographic origin of the Isthmian individuals sampled; the inset represents the locations of the archaeological excavations. (B) Schematic drawings of Tumba 1 in the Plaza Mayor site of Panamá Viejo and the burial at Coco del Mar. The table reports mtDNA and Y chromosome haplogroup affiliations, molecular sex determination, and 14C-calibrated dates (CE). The sum distributions of all ages combined are shown, separately for the two sites, above (Tumba 1) and below (Coco del Mar) the table. Calibration dataset was IntCal20. Calibration software was OxCal 4.4.2. The inset on the right shows no kinship relationships (values extracted from Table S2 with error bars indicating 2-fold Standard Errors, SE) among individuals buried together in Plaza Mayor Tumba 1 and Coco del Mar. IDs (and additional information) are indicated in black and gray, respectively.
Figure S1
Figure S1
Analyses of uniparental markers, related to Figure 5B and Table S1 (A) Schematic phylogenetic trees of the four major mtDNA haplogroups identified in the Isthmian area. The Bayesian phylogenetic trees, rooted on an L2c2 mitogenome from a “Moreno” individual, include all modern mitogenomes belonging to the four major haplogroups of modern and ancient Isthmian individuals (A2af1, A2w, B2d, C1d1). Black lines highlight branches specific to IA from the Isthmo-Colombian area. The Bayesian age (mean value with standard deviation) is shown for relevant branches. (B) Ancient Y chromosome classification. SNPs for each macro-haplogroup present in Poznik et al., 2016. In the right panel, SNPs for each sub-haplogroup Q in Grugni et al., 2019 and Pinotti et al., 2019. Different colors refer to the allele status (green: ancestral; blue: derived), while different shades indicate the aDNA possible damage. Haplogroup nomenclature as in ISOGG 2019.
Figure 2
Figure 2
Overview of the genetic structure of ancient and modern Isthmian groups (A) ADMIXTURE plot for K = 14; each bar shows the average ancestry proportion of individuals within the same group considering the rWD1560 dataset plus the American and Siberian ancient individuals. (B) Indigenous American (IA) PCA analysis including the mIA417 dataset and ancient genomes projected onto uIA217 variability. The inset shows a specific Isthmo-Colombian PCA. (C) f4 statistics in the form f4 (W/Isthmo-Colombia/Anzick, X/Isthmo-Colombia/SpiritCave; Y/Isthmo-Colombia, Mbuti) considering the uIA89 and mIA417 datasets plus ancient Isthmian individuals (all SNPs). The f4 values are reported in abscissa. Each tested population (Y) is shown (with triangles pointing to X or W population) only when the initial conformation of the tree is rejected (p value ∼ 0.001, for Z scores > |3.3|), thus visually pointing to the closer population (X or W) in each comparison. A legend for symbols used in the paper is reported on the top left.
Figure S2
Figure S2
Worldwide ADMIXTURE plot on modern and ancient individuals, related to Figure 2 (A) ADMIXTURE analyses were performed from K1 to K20 on the modern rWD1560 dataset, even if only profiles from K6 to K14 are displayed. The inset shows the boxplot of 5-fold cross validation (CV) values for Ks from 1 to 20 after 10 runs. The median (most typical) values were plotted indicating 25th and 75th percentiles (dark and light gray, respectively) and arms extending 1.5 times the IQR (interquartile range). (B) ADMIXTURE analysis projecting ancient Siberian and American individuals on the modern worldwide variability. (C) ADMIXTURE plot and PCA performed on a comparative dataset (genotyped with Illumina chips) from Scheib et al., 2018 that includes the following Chibchan-speaking populations: Arhuaco and Kogi from Colombia; Guaymi, Cabecar, Teribe, Bribri, Huetar and Maleku from Costa Rica (Table S3). The K4 distribution map is also shown.
Figure S3
Figure S3
f3 statistics involving Isthmian individuals, related to Figures 2, 3, and 6 (A) Heatmap based on outgroup f3-statistics. The shared drift among the Panamanian individuals was analyzed considering those included in uIA217 plus ancient individuals and masked data in mIA417. Color intensity is inversely proportional to the shared ancestry among individuals, which was used to build the dendrogram. (B) Outgroup f3 statistics where ancient and modern Isthmian groups (Pop1) were compared to worldwide populations (Pop2) including non-American groups in the rWD1560 dataset, all populations in the mIA417 and uIA217 datasets and all ancient individuals. All comparisons have a Z score > 32.912. The average f3 value for each population is reported in abscissa. (C) The neighbor-joining tree is built using the inverse values derived from the outgroup f3 statistics on all Central and South American populations pairs plus Anzick-1, Early San Nicolas (ESN), Spirit Cave and USR-1. The latter is considered as an outgroup in the tree. We retained only populations with more than 30K overlapping SNPs and significant Z scores (> 3.3) in all comparisons. The map shows the geographic distribution of the populations, which are colored according to their genetic proximity in the tree. (D) We also analyzed the shared genetic history of modern IA populations (included in mIA417 and uIA89) against ancient reference genomes from Beringia and the Americas (representative of the NNA and SNA ancestries). Boxplots in gray help to visualize the distribution of f3 values in each comparison, indicating the median (most typical) value, 25th and 75th percentiles (dark and light gray, respectively), and arms extending 1.5 times the IQR (interquartile range). The dotted line indicates the f3 average value.
Figure 3
Figure 3
Population genetic structure as revealed by haplotype analysis of modern Panamanian and IA populations (A) fineSTRUCTURE unrooted dendrogram showing the 19 identified Indigenous clusters and the geographic distributions of the individuals in the nearly unadmixed IA (uIA217) dataset. (B) Violin plot showing cluster self-copy lengths (fragments copied from members of their own cluster) in the uIA217 dataset; higher values are for more isolated groups. (C) Density of the intrapopulation average total length of shared IBD blocks, considering nine bins of IBD lengths in the Panamanian and non-Panamanian Indigenous groups of the uIA217 dataset. The inset shows the estimation of changes in effective population size (Ne) over time based on IBD segments with a minimum threshold of 2 cM (even if estimates older than ∼1,000 years should be considered with caution) and considering a generation time of 25 years.
Figure S4
Figure S4
Haplotype-based analyses and estimates of effective population size variation over time, related to Figure 3 (A) The PCA was built using copying vectors inferred using a modified version of ChromoPainter that allows for the presence of missing data. The masked individuals (rmIA311) have been projected on the variability of the nearly unadmixed individuals (uIA217) regardless of the level of missing data. The unadmixed individuals are indicated with full filled dots while the masked ones are represented by different shapes, according to the percentage of missing SNPs. The colors refer to the clusters (donors) of Figure 3A. (B) Heatmap based on individual TVD (Total Variation Distance) values. Dendrogram branches are colored according to 19 clusters (Figure 3A). The TVD was compared both among and within clusters. Lighter colors (lower TVD values) in the matrix mean similarity, while darker colors (higher TVD values) indicate heterogeneity. (C) We used RefinedIBD on inferred IBD length to estimate variations in the effective population size (Ne, on a log scale y axis) over time. The x-axes show the time before the present as years ago (ya) considering a generation time of 25 years and the colored regions show 95% bootstrap confidence intervals (CI). The analyses were limited to the last ~2,000 years, due to the wide variance of exponentially distributed IBD fragments and were performed on different datasets. The Guna group was evaluated considering different IBD thresholds (2 cM, 4 cM and 6 cM). (D) We double-checked the trend presented in the inset of Figure 3C without the Guna. (E) We also compared the IBDne of the Panamanian macro-clusters with the others identified in Figure 3A, Western Panama: Western Isthmus, PaNASO, PaNGABE; Emberà: PaEMBERA; Guna: PaGUNA; Colombia KCH: Colombia, Ecuador (KCH); South America Peru: SouthAmerica1, SouthAmerica2, Peru North Coast, SouthAmerica3; North Central Mexico: Central America, North America, Mexico; Brazil all: Brazil, Xavante, Karitiana, Surui, Guarani. (F) Visualization of the average of summed IBD lengths shared between modern Panamanians and other IA populations in each paired comparison, with identified IBD blocks in the range of 1–5 cM (oldest), 5–10 cM, and over 10 cM (youngest). Shape sizes are proportional to mean values; only those pairs sharing at least two blocks > 5 cM and four < 5 cM are plotted.
Figure S5
Figure S5
f4 statistics involving Isthmian individuals, related to Figures 2 and 4 (A) f4 statistics in which Panamanian populations (W) were compared to Mixe (X), typically used to reveal UPopY among IA, and to four Australasian populations (Y). (B) Isthmian groups (W) were compared to each other (X) testing for other IA populations (Y, colored according to their geographic location) to test through the Z score whether a given Isthmian group carries excess of a specific IA ancestry. (C) To specifically test the differential relationships of Isthmian and other Central/South IA groups with Anzick-1 and Spirit Cave, we ran the f4 -statistics in the form f4 (Anzick1, Spirit Cave; Central and South IA, Mbuti) and reported the average Z score on a map. The Isthmian populations were also tested separately. In the lower part of the panel, we verified the same relationships in the form f4 (USR, Anzick1/Spirit Cave; Central and South IA, Mbuti), using USR as outgroup to the Central and South IA populations (again the Isthmian populations were tested separately, plot on the lower right). The datasets uIA89, mIA417 and ancient individuals were used considering different sets of variants.
Figure 4
Figure 4
Heatmaps based on f4 statistics to compare the differential relationships between the Isthmian groups and other ancient/modern IAs f4 statistics in the form f4 (W/Isthmus, X/USR-1; Y/Ancient and Modern IA, Mbuti). Each tested population (Y) is represented by squares (ancient) and circles (modern) with colors proportional to f4 values; Z score always >3.3.
Figure 5
Figure 5
Schematic phylogenetic trees based on genome-wide and mtDNA data (A) Inferred maximum likelihood tree built with TreeMix on the unadmixed dataset uIA89 allowing two admixture edges (migration events). Population groups are colored according to linguistic/geographic affiliation. Horizontal branch lengths are proportional to the amount of genetic drift that has occurred on the branch. Migration arrows are colored according to their weight. (B) Bayesian phylogenetic tree of ancient and modern mitogenomes from Panama belonging to IA founding haplogroups. It was rooted on an L2c2 mitogenome from a “Moreno” individual. The Bayesian age (mean value with standard deviation) is shown for relevant branches. Black lines highlight Isthmo-Colombian-specific branches. The inset shows the Bayesian skyline plot (BSP), based on complete mitogenomes, displaying changes in the effective Ne through time considering a generation time of 25 years.
Figure 6
Figure 6
f4 statistic tests on Isthmian and other IA groups and minimum number of ancestral sources (A) f4 statistics in the form f4 (W/Ancient IA, X/Modern IA; Y/Isthmus, Mbuti) on uIA89, mIA417, and ancient genomes considering only transversions. Only sub-groups of meaningful ancient genomes were considered (see Table S4 for comparisons with the entire ancient dataset). The Emberá group was excluded due to a significant degree of admixture detected in the individuals. Each tested population (Y) is shown (with triangles pointing to X or W population) only when the initial conformation of the tree is rejected (p ~ 0.001, when the Z score is >|3.3|), thus visually pointing to the closer population (W or X) in each comparison. (B) We used qpWave to compare (in pairs) ancient Panama and present-day Isthmian groups with all IA populations (considering rank 1). Outgroups were kept to the minimum and chosen to represent different IA ancestries identified here (STAR Methods) and in other papers. Rank 1 refers to a model in which all paired populations fit as derived from two ancestral sources, relative to the outgroups. A p value > 0.01 (< 2 in −log10 scale, dotted red line) means pairs that could be explained by a single independent source.
Figure S6
Figure S6
Admixture graphs modeling ancient SNA and NNA genomes and ancient Isthmians, related to Figure 7 (A) Basal tree with three of the most ancient SNA genomes available. The best fitting topology, highlighted in red, was initially tested by (B) considering an early admixture between the northern American SNA genomes, then extended by adding in turn: (C) Lapa do Santos and ESN; (D) Los Rieles, tested as either unadmixed or admixed, and then checking Lapa do Santos as admixed (E); ancient Isthmians together with other ancient Central American genomes, i.e., (F) Saki Tzul and (G) Mayahak Cab Pek; (H) NNA genomes, from the left to right, ASO, 939, Kennewick, Athabaskan_725, Athabaskan_100 and Chipewyan. The best fitting topologies are highlighted in red. See the legend of Figure 7 for further details.
Figure S7
Figure S7
Admixture graph modeling Panama’s genetic history linked to ancient SNA and NNA genomes, related to Figure 7 Possible extensions of the best trees in Figure S6 by linking Ancient Isthmians to (A) Lagoa Santa and then testing Laranjal instead of Lagoa Santa (rightmost graph). Finally, we modeled Guna as representative of UPopI (B-C). The best tree topology is similar to the one in Figure 7, but with multiple splits from the SNA1 node. This tree as well as the final one (Figure 7) were checked multiple times: (D) considering Mixe (UPopA) instead of Guna (UPopI), also in the rightmost tree of the panel B; (E) replacing Spirit Cave with Anzick-1; (F) without UPopI or without admixture between UPopI and other SNA ancestries. The best fitting topologies are highlighted in red. See the legend of Figure 7 for further details.
Figure 7
Figure 7
Admixture graph modeling ancestries and affinities of Isthmian groups in America Best fitting f-statistics-based admixture graph optimized using qpGraph. We modeled the genetic history of ancient Isthmian individuals and the Guna directly linked to ancient IA genomes representative of the SNA ancestries. At the top, we show the f4 statistics with the worst Z score after optimizing the model. Statistics on alternative models are also listed (see Figure S7 for further details). Numbers to the right of solid edges represent optimized drift parameters and percentages to the right of dashed edges represent admixture proportions. Different colors indicate the specific ancestries discussed in the text. The bar chart shows different ancestry proportions in ancient and modern Isthmian groups (except for Guna) estimated with qpGraph on the final tree (Z score always < |2.5|).

References

    1. Achilli A., Rengo C., Magri C., Battaglia V., Olivieri A., Scozzari R., Cruciani F., Zeviani M., Briem E., Carelli V. The molecular dissection of mtDNA haplogroup H confirms that the Franco-Cantabrian glacial refuge was a major source for the European gene pool. Am. J. Hum. Genet. 2004;75:910–918. - PMC - PubMed
    1. Achilli A., Perego U.A., Lancioni H., Olivieri A., Gandini F., Hooshiar Kashani B., Battaglia V., Grugni V., Angerhofer N., Rogers M.P. Reconciling migration models to the Americas with the variation of North American native mitogenomes. Proc. Natl. Acad. Sci. USA. 2013;110:14308–14313. - PMC - PubMed
    1. Achilli A., Olivieri A., Semino O., Torroni A. Ancient human genomes-keys to understanding our past. Science. 2018;360:964–965. - PubMed
    1. Alexander D.H., Novembre J., Lange K. Fast model-based estimation of ancestry in unrelated individuals. Genome Res. 2009;19:1655–1664. - PMC - PubMed
    1. Allentoft M.E., Collins M., Harker D., Haile J., Oskam C.L., Hale M.L., Campos P.F., Samaniego J.A., Gilbert M.T., Willerslev E. The half-life of DNA in bone: measuring decay kinetics in 158 dated fossils. Proc. Biol. Sci. 2012;279:4724–4733. - PMC - PubMed

Publication types

Substances

LinkOut - more resources