. 2021 Mar 23;34(12):108882.
doi: 10.1016/j.celrep.2021.108882.

Microglial identity and inflammatory responses are controlled by the combined effects of neurons and astrocytes

Affiliations

Microglial identity and inflammatory responses are controlled by the combined effects of neurons and astrocytes

Paul S Baxter et al. Cell Rep. .

Abstract

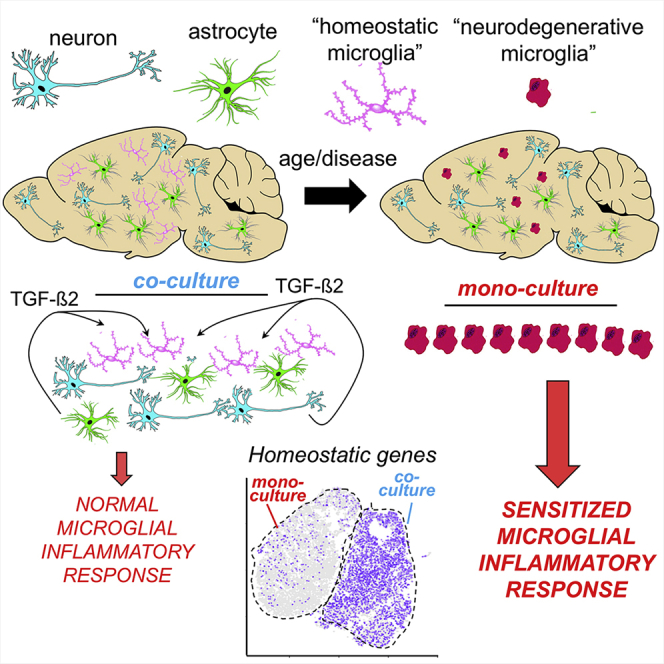
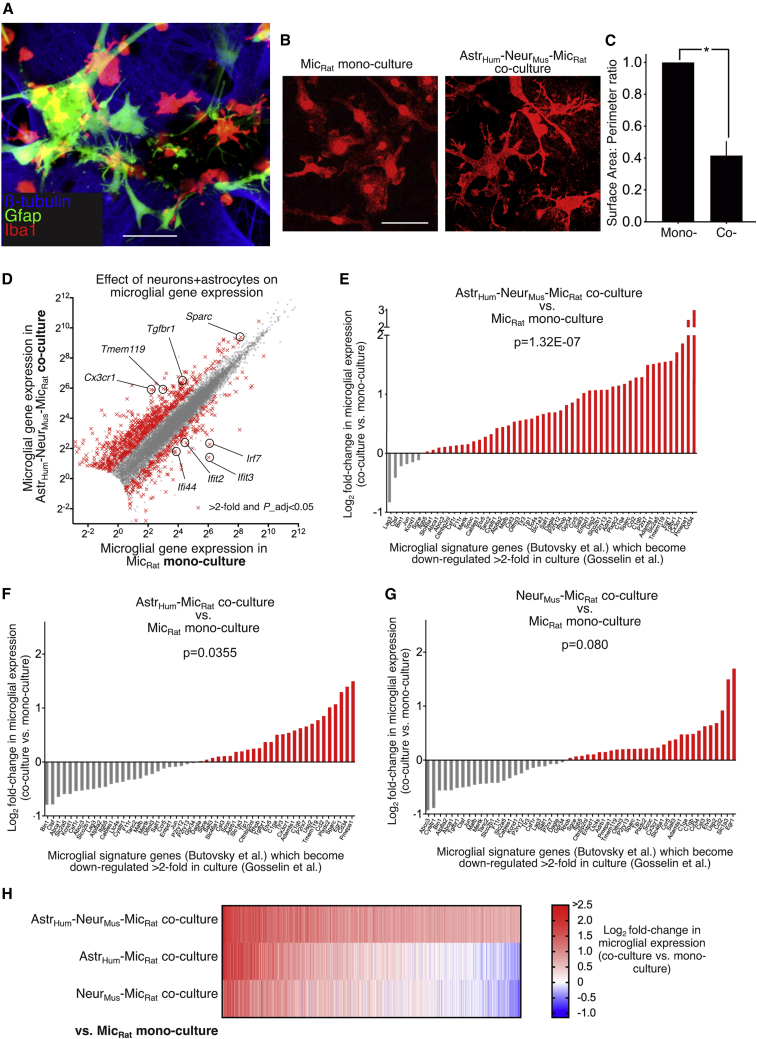
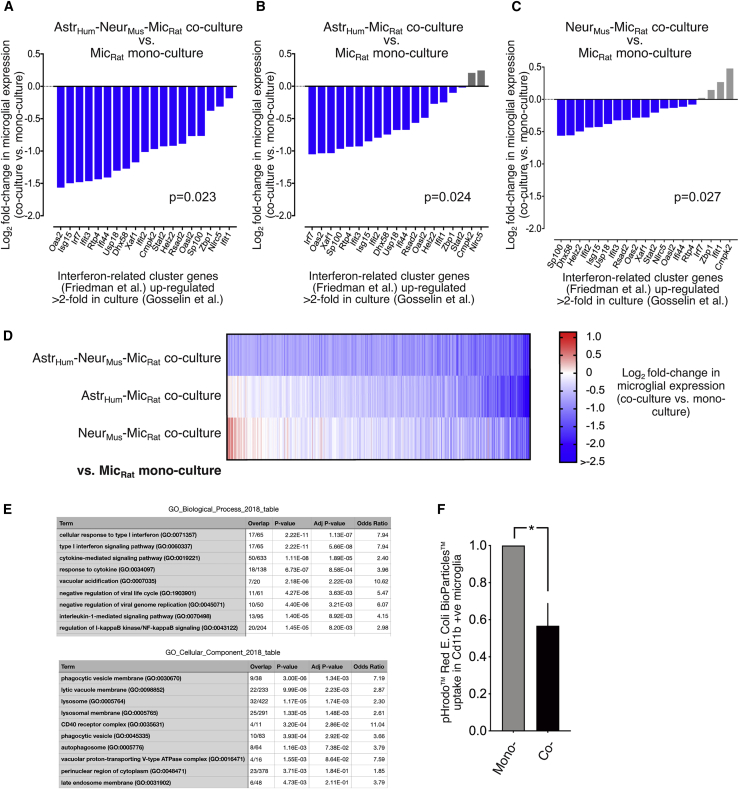
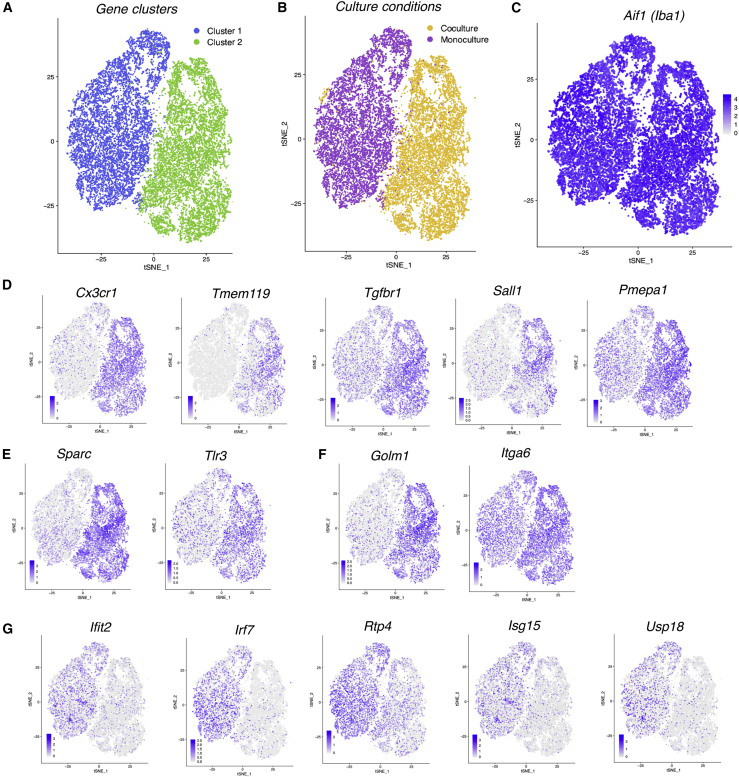
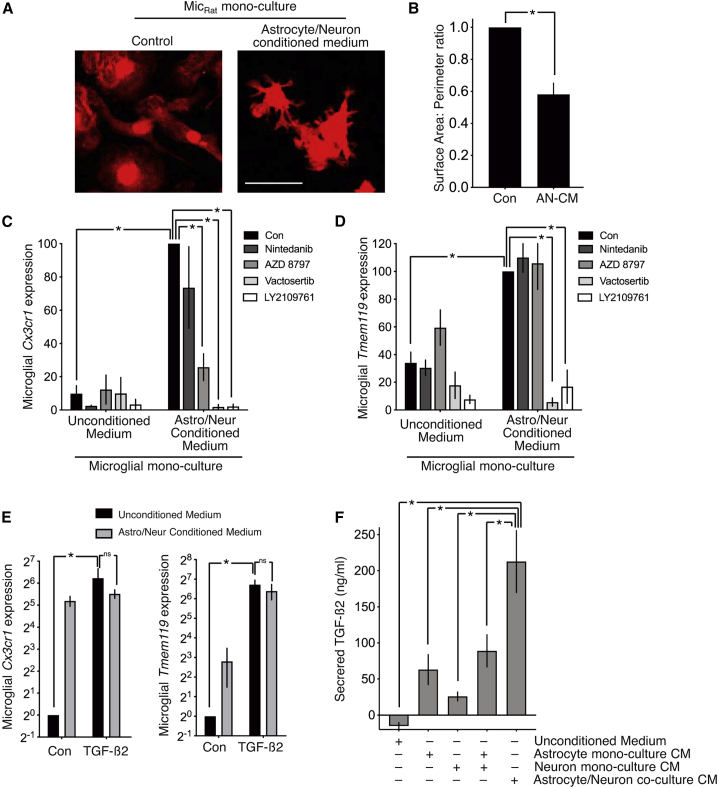
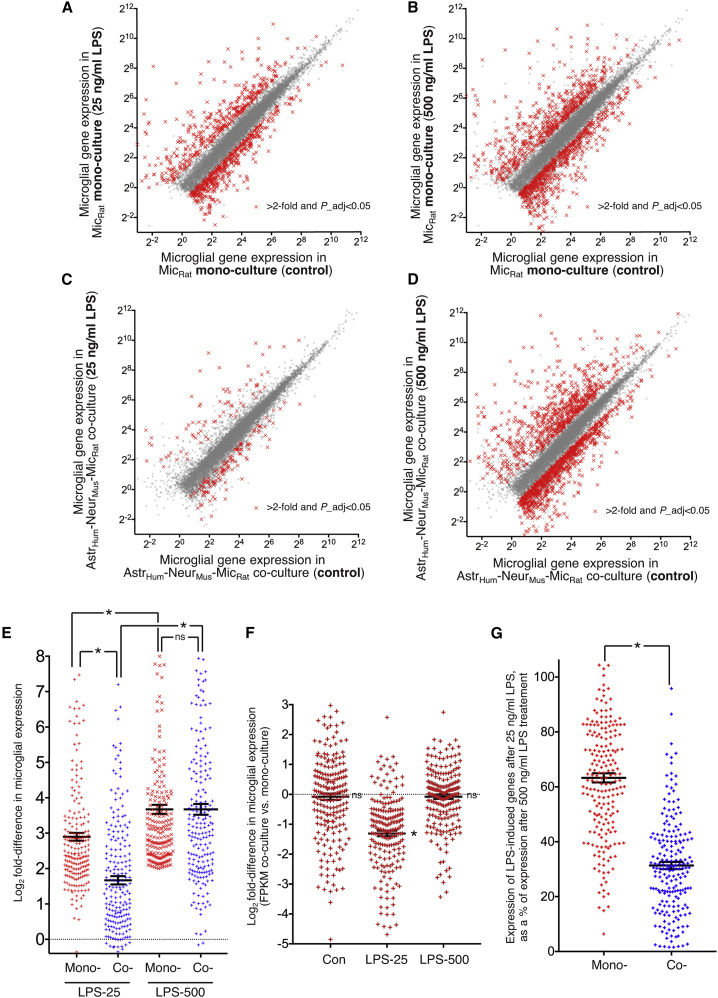
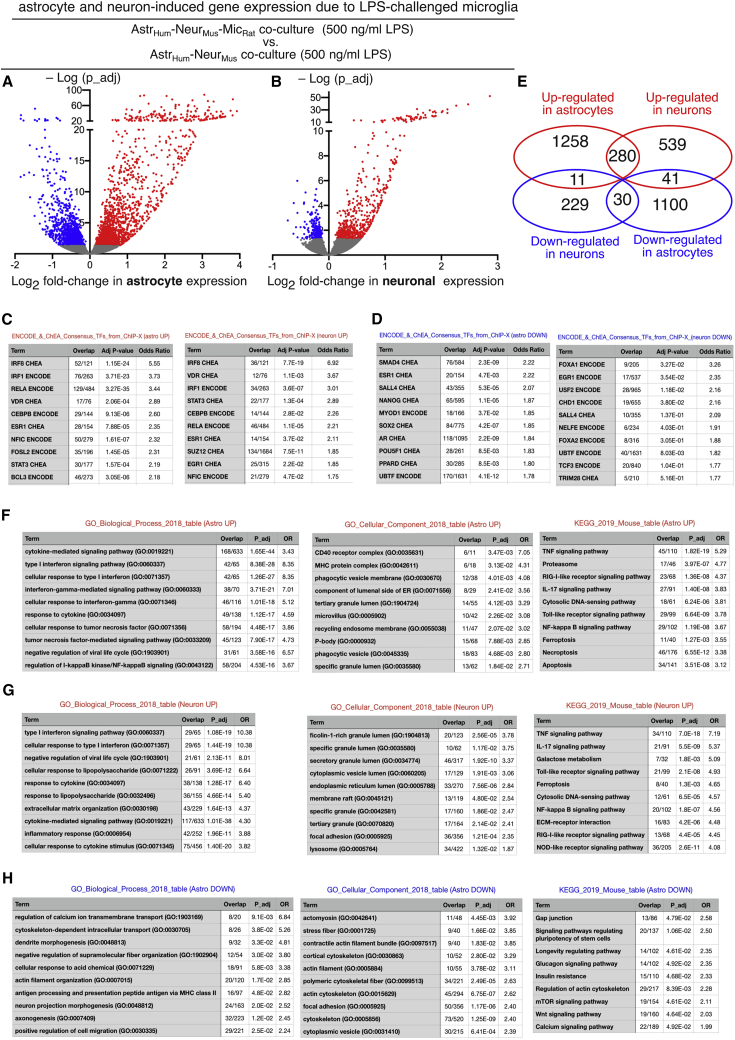
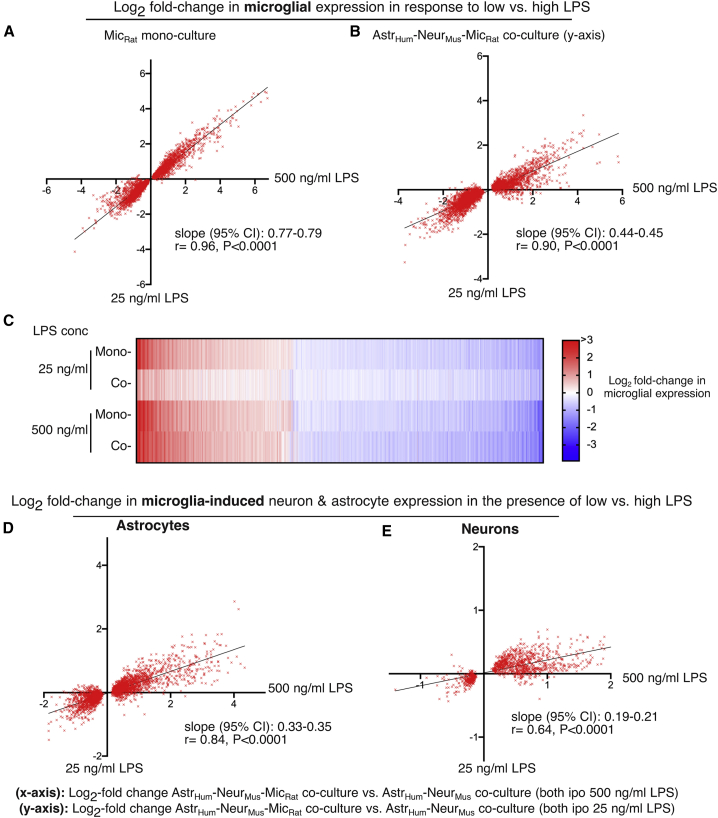
Microglia, brain-resident macrophages, require instruction from the CNS microenvironment to maintain their identity and morphology and regulate inflammatory responses, although what mediates this is unclear. Here, we show that neurons and astrocytes cooperate to promote microglial ramification, induce expression of microglial signature genes ordinarily lost in vitro and in age and disease in vivo, and repress infection- and injury-associated gene sets. The influence of neurons and astrocytes separately on microglia is weak, indicative of synergies between these cell types, which exert their effects via a mechanism involving transforming growth factor β2 (TGF-β2) signaling. Neurons and astrocytes also combine to provide immunomodulatory cues, repressing primed microglial responses to weak inflammatory stimuli (without affecting maximal responses) and consequently limiting the feedback effects of inflammation on the neurons and astrocytes themselves. These findings explain why microglia isolated ex vivo undergo de-differentiation and inflammatory deregulation and point to how disease- and age-associated changes may be counteracted.

Keywords: RNA-seq; ageing; astrocytes; microglia; neurodegeneration; neurons; signal transduction; transcriptomics.


Conflict of interest statement

Declaration of interests The authors declare no competing interests.

Figures

None
Graphical abstract
Figure 1
Figure 1
Neurons and astrocytes combine to drive microglial homeostatic signature gene expression (A) A triple stain of the astrocyte/neuron/microglia co-culture with the indicated antibodies. Scale bar, 50 μm. (B) Example images of Iba1-stained microglia in mono- or co-cultures as indicated. Scale bar, 20 μm. (C) Surface area/perimeter ratio was calculated in mono- and co-culture. p = 0.007 (t = 6.662, degrees of freedom [df] = 3), paired t test (120 cells analyzed per condition across n = 4 independent biological replicates). (D) The influence of neuron-astrocyte co-culture on the microglial transcriptome. RNA-seq was performed on RNA extracted from (rat) microglia mono-cultures and (rat) microglia co-cultured with (human) astrocytes and (mouse) neurons. Both sets of reads were subjected to the same Sargasso workflow to identify unambiguously rat (microglial) reads and FPKM of all 13,406 genes shown that average >1 FPKM across the datasets is plotted for mono-culture (x axis) versus co-culture (y axis). Highlighted with red crosses are the 982 genes whose expression is significantly changed (DESeq2 P_adj < 0.05) by >2-fold (n = 7 mono-culture; n = 4 co-culture). “N” refers here and throughout as independent biological replicates derived from different culture material on different occasions. Upregulated genes highlighted are example MHSGs (Butovsky et al., 2014); downregulated genes highlighted are example interferon-related gene (IRG) cluster members (Friedman et al., 2018). (E) Neurons and astrocytes combined boost microglial signature genes which become suppressed in vitro. Genes considered are those expressed >0.5 FPKM in our data and within the group of microglia signature genes defined by Butovsky et al. (2014), which are downregulated >2-fold after microglia were maintained in culture for 7 days compared to their expression immediately post-isolation from the intact brain, according to the data of Gosselin et al. (2017). For each gene, log2 fold change (log2FC) in microglial gene expression is shown relative to microglial mono-culture in (rat) microglia (mouse) neuron (human) astrocyte co-culture. The data were mined from the complete set shown in (D). p = 1.3E-07, F (1,477) = 28.69 relates to main effect of co- versus monoculture condition on the gene set, two-way ANOVA. (F and G) RNA-seq was performed on RNA extracted from (rat) microglia monocultures and (rat) microglia co-cultured with (human) astrocytes (F) or (mouse) neurons alone (G). log2FC in microglial gene expression is shown relative to microglial monoculture of the same genes as in (E). p = 0.036, F(1,424) = 4.45 (F), p = 0.080, F(1,424) = 3.09 (G), two-way ANOVA. (H) Heatmap of the log2FC in microglial gene expression in the three different types of co-culture. 1,550 genes significantly induced >1.5-fold (DESeq2 P_adj < 0.05) are shown.
Figure 2
Figure 2
Neurons and astrocytes combine to repress an IRG cluster (A–C) Genes considered are those expressed >0.5 FPKM in our data and within the “interferon-related co-regulated genes” defined by Friedman et al. (2018) that are upregulated >2-fold after microglia were maintained in culture for 7 days, compared to their expression immediately post-isolation, according to the data of Gosselin et al. (2017). For each gene, log2FC in microglial gene expression is shown relative to microglial monoculture in microglia cultured with human astrocytes and mouse neurons (A), human astrocyte alone (B), and mouse neurons alone (C). p = 0.023 (A), p = 0.024 (B), p = 0.027 (C), effect of co- versus monoculture conditions, two-way ANOVA. (D) Heatmap of the log2FC in microglial gene expression in the three different types of co-culture. 602 genes significantly repressed >1.5-fold (DESeq2 P_adj < 0.05) are shown. (E) The set of genes repressed in microglia by astrocyte/neuron co-culture were subject to ontological analysis and top-ranked GO Biological Processes (top) and Cellular Components (bottom) shown. (F) A phagocytosis assay was performed on mono- and co-cultured microglia and mean particle uptake calculated. p = 0.007 (n = 5).
Figure 3
Figure 3
Single-cell analysis reveals a strong and uniform influence of neurons and astrocytes on the microglial transcriptome (A–C) Cluster analysis of 25,681 microglial single-cell transcriptomes from monocultures or neuron/astrocyte co-cultures from two independent biological replicates (A) with culture condition (B) and microglial marker Iba1 (C) mapped onto these clusters. (D–G) Genes mapped into the single-cell data, including a selection of genes common to the MHSG set and the set repressed in the MGnD profile (D), genes specific to the MHSG set (E), and the MGnD-profile-repressed set (F). (G) Selection of IRGs.
Figure 4
Figure 4
The effects of neurons and astrocytes on microglia are mediated in part by TGF-β2 release (A) Example images of Iba1-stained monocultures of microglia treated with astrocyte/neuron co-culture conditioned medium (AN-CM) or unconditioned medium. Scale bar, 20 μm. (B) Surface area/perimeter ratio was calculated in microglial monocultures treated as in (A). p = 0.0094, paired t test (120 cells analyzed per condition across n = 4 biological replicates). (C and D) Microglial monocultures were exposed ±AN-CM for 72 h, with the indicated drugs added 1 h earlier (nintedanib, 500 nM; AZD8797, 10 μM; vactosertib, 100 μM; LY2109761, 3 μM). RNA was extracted and Cx3cr1 (C) and Tmem119 (D) analyzed by qPCR, normalized to Rpl13a. (E) Microglial monocultures were treated ±AN-CM ±TGF-β2 (20 ng/mL) and Cx3cr1 and Tmem119 mRNA analyzed as in (C) and (D). p < 0.0001 in all cases, two-way ANOVA plus Dunnett’s post hoc test (n = 3–6). (E) p = 0.010 (Cx3cr1), 0.0006 (Tmem119), two-way ANOVA plus Sidak’s post hoc test (n = 4). (F) TGF-β2 was measured by ELISA in the indicated media, conditioned for 72 h. p = 0.013, 0.031, 0.028, 0.046, one-way ANOVA plus Sidak’s post hoc (n = 5).
Figure 5
Figure 5
Neurons and astrocytes regulate the microglial response to LPS (A–D) LPS-induced microglial gene expression in microglial monoculture (A and B) and co-culture (C and D) in response to 16-h LPS treatment at 25 ng/mL (A and C) or 500 ng/mL (B and D). FPKM of all genes shown that average >1 FPKM across the datasets is plotted for control (x axis) versus LPS (y axis). Highlighted with red crosses are the genes whose expression is significantly changed (DESeq2 P_adj < 0.05) by >2-fold (n = 4). (E) Log2FC in microglial gene expression is shown in the indicated cultures and in response to the indicated concentrations of LPS. The set of genes analyzed is the 206 induced >4-fold by the high does (500 ng/mL) of LPS in microglial monocultures is shown for all conditions. Mono-, microglial monoculture; Co-, (rat) microglia (mouse) neuron (human) astrocyte co-culture. p values (left to right): <0.0001, 0.0001, <0.0001; ns, >0.9999; two-way ANOVA followed by Tukey’s post hoc test (n = 206). (F) For the same set of the LPS-responsive genes in (E), we calculated the Log2 fold-change in microglial gene expression in co-culture versus monoculture, under the three different experimental treatments (con, 25 ng/ml LPS, 500 ng/ml LPS). p values (left to right):0.478 (ns), 3.05E-8 (), 0.141 (ns); 2-tailed paired Student’s t test on FPKM values in monoculture versus co-culture under each treatment condition. (G) For the same set of the LPS-responsive genes in (E) and (F), the expression level (FPKM) of each gene under 25-ng/mL LPS conditions was calculated as a percentage of that gene’s expression level under 500-ng/mL LPS conditions. p = 3.01E-39, unpaired two-tailed Student’s t test (n = 206)
Figure 6
Figure 6
LPS-activated microglia trigger strong responses in astrocytes and neurons (A and B) Volcano plots of the changes in gene expression in astrocytes (A) and neurons (B) due to microglia when in the presence of LPS (500 ng/mL), identified by applying the Sargasso workflow and sorting the human (astrocyte) reads and mouse (neuron) reads. (C and D) Genes induced (C) or repressed (D) in astrocytes (left) and neurons (right) by activated microglia were analyzed for enrichment in ENCODE and ChEA Consensus target genes from ChIP-X on the Enrichr platform (Kuleshov et al., 2016). Significantly enriched transcription factor motifs were ranked by fold-enrichment, and the top 10 are shown. (E) Venn diagram showing the overlap in genes significantly changed in neurons and astrocytes by LPS-activated microglia. (F–H) Genes induced in astrocytes (F) or neurons (G) and repressed in astrocytes (H) were subject to ontological analysis for enrichment in GO Biological Process (left), GO Cellular Component (middle), and KEGG pathways (right). Enriched terms were ranked by fold enrichment, and the top 10 are shown.
Figure 7
Figure 7
The influence of LPS-activated microglia on co-cultured neurons and astrocytes shows a strong LPS dose dependency (A and B) A comparison of the transcriptional response of microglia to low (25 ng/mL) versus high (500 ng/mL) LPS in monoculture (A) and astrocyte/neuron co-culture (B), focusing solely on significantly changed genes. In addition to the linear regression slope, the correlation coefficient (r) is shown, illustrating the degree of linearity of the relationship between responses to low versus high LPS. (C) Heatmap of the log2FC in microglial gene expression in monoculture (A) and astrocyte/neuron co-culture at low and high doses of LPS. Genes significantly changed >1.5-fold (DESeq2 P_adj < 0.05) by 500 ng/mL LPS are shown. (D and E) A comparison of the transcriptional response of astrocytes (D) and neurons (E) to microglia activated by low (25 ng/mL) versus high (500 ng/mL), focusing solely on significantly changed genes. The shallow slopes indicates that the response of astrocytes and neurons to microglia activated by low LPS is smaller than by high LPS, consistent with the dose dependency of the microglia response in co-culture (B).

Similar articles

Cited by

References

    1. Basrai H.S., Christie K.J., Turbic A., Bye N., Turnley A.M. Suppressor of Cytokine Signaling-2 (SOCS2) Regulates the Microglial Response and Improves Functional Outcome after Traumatic Brain Injury in Mice. PLoS ONE. 2016;11:e0153418. - PMC - PubMed
    1. Baxter P.S., Martel M.A., McMahon A., Kind P.C., Hardingham G.E. Pituitary adenylate cyclase-activating peptide induces long-lasting neuroprotection through the induction of activity-dependent signaling via the cyclic AMP response element-binding protein-regulated transcription co-activator 1. J. Neurochem. 2011;118:365–378. - PMC - PubMed
    1. Bell K.F., Hardingham G.E. The influence of synaptic activity on neuronal health. Curr. Opin. Neurobiol. 2011;21:299–305. - PMC - PubMed
    1. Bohlen C.J., Bennett F.C., Tucker A.F., Collins H.Y., Mulinyawe S.B., Barres B.A. Diverse Requirements for Microglial Survival, Specification, and Function Revealed by Defined-Medium Cultures. Neuron. 2017;94:759–773.e8. - PMC - PubMed
    1. Butovsky O., Jedrychowski M.P., Moore C.S., Cialic R., Lanser A.J., Gabriely G., Koeglsperger T., Dake B., Wu P.M., Doykan C.E. Identification of a unique TGF-β-dependent molecular and functional signature in microglia. Nat. Neurosci. 2014;17:131–143. - PMC - PubMed

Publication types

MeSH terms