. 2021 Mar 23;34(12):108893.
doi: 10.1016/j.celrep.2021.108893.

FoxO1 suppresses Fgf21 during hepatic insulin resistance to impair peripheral glucose utilization and acute cold tolerance

Affiliations

FoxO1 suppresses Fgf21 during hepatic insulin resistance to impair peripheral glucose utilization and acute cold tolerance

Oliver Stöhr et al. Cell Rep. .

Abstract

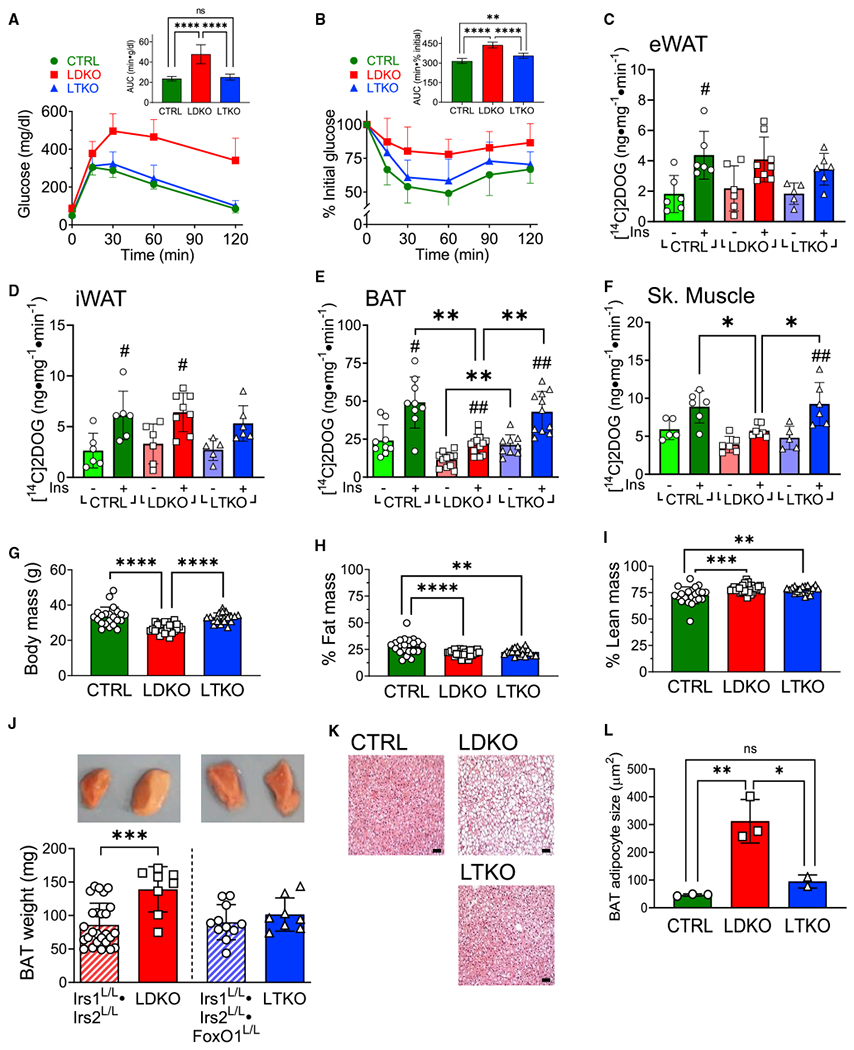
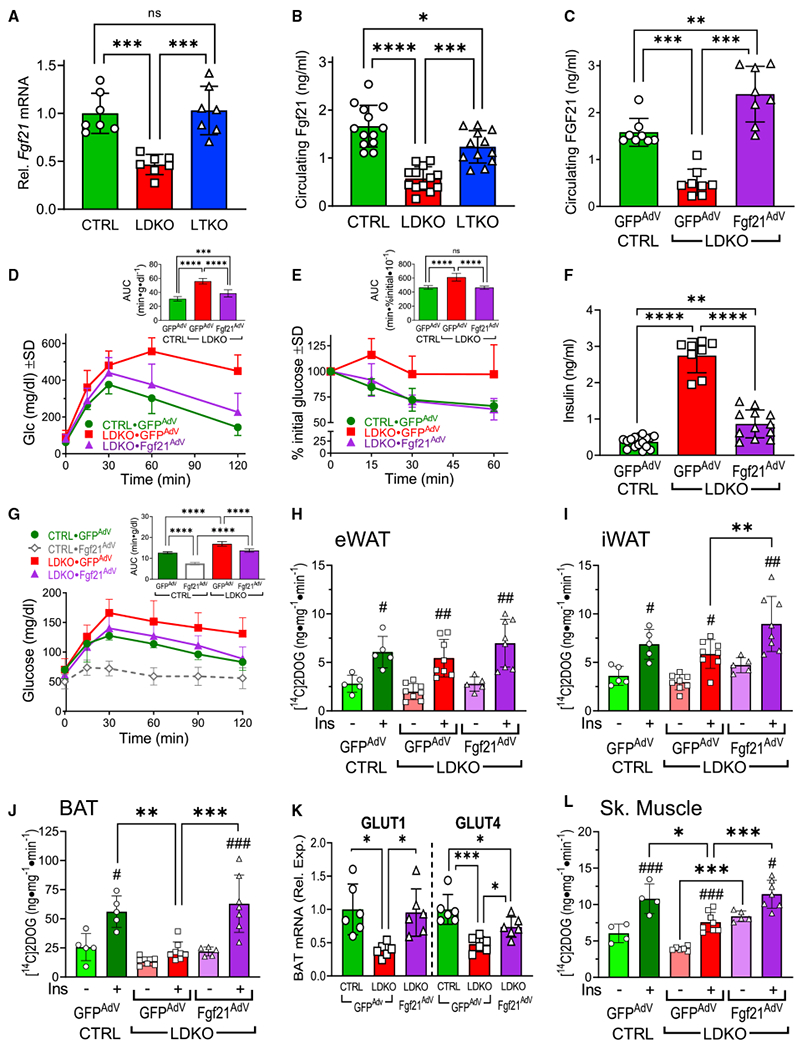
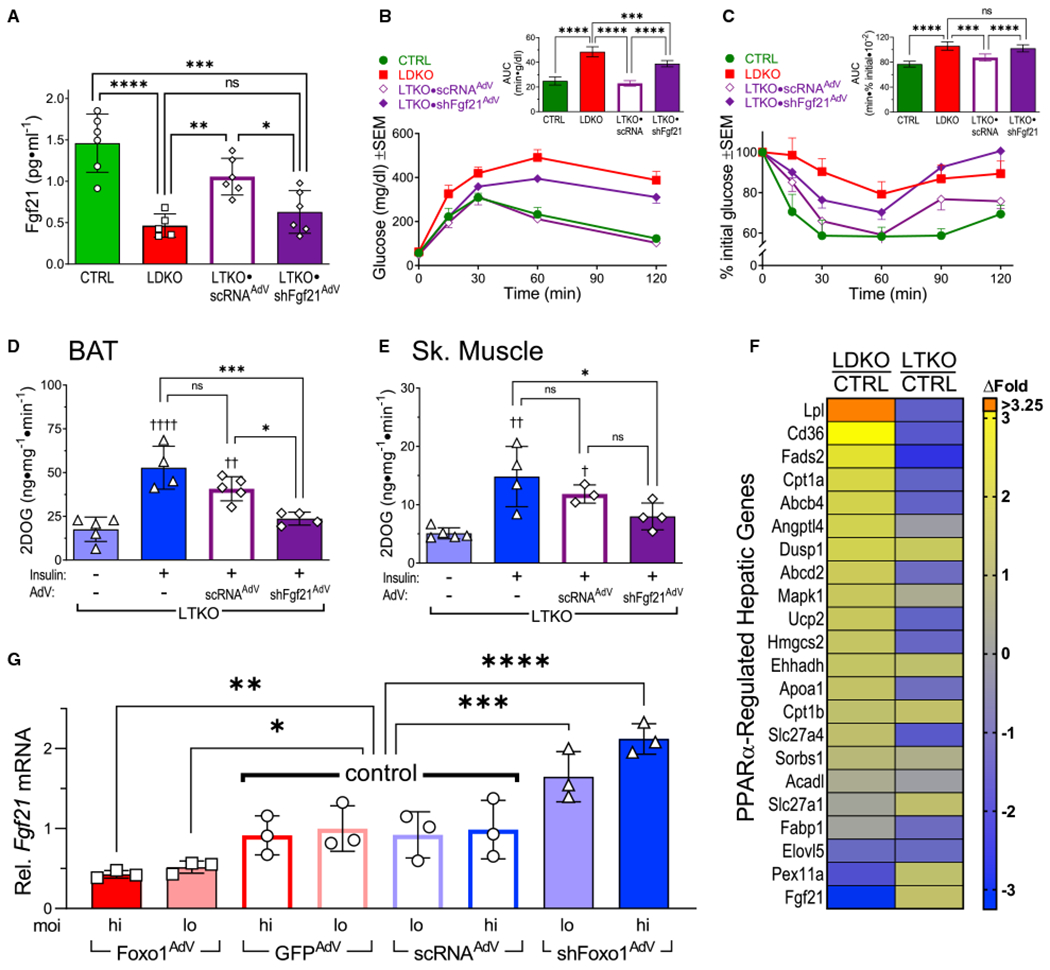
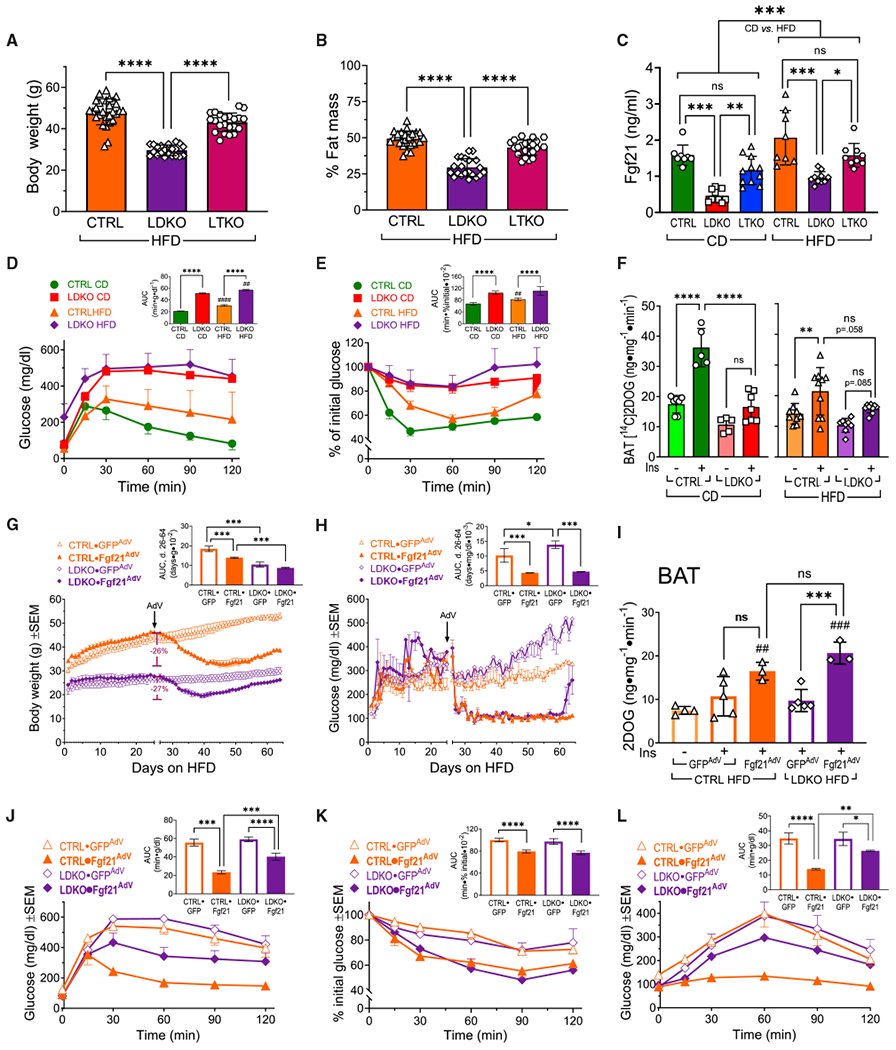
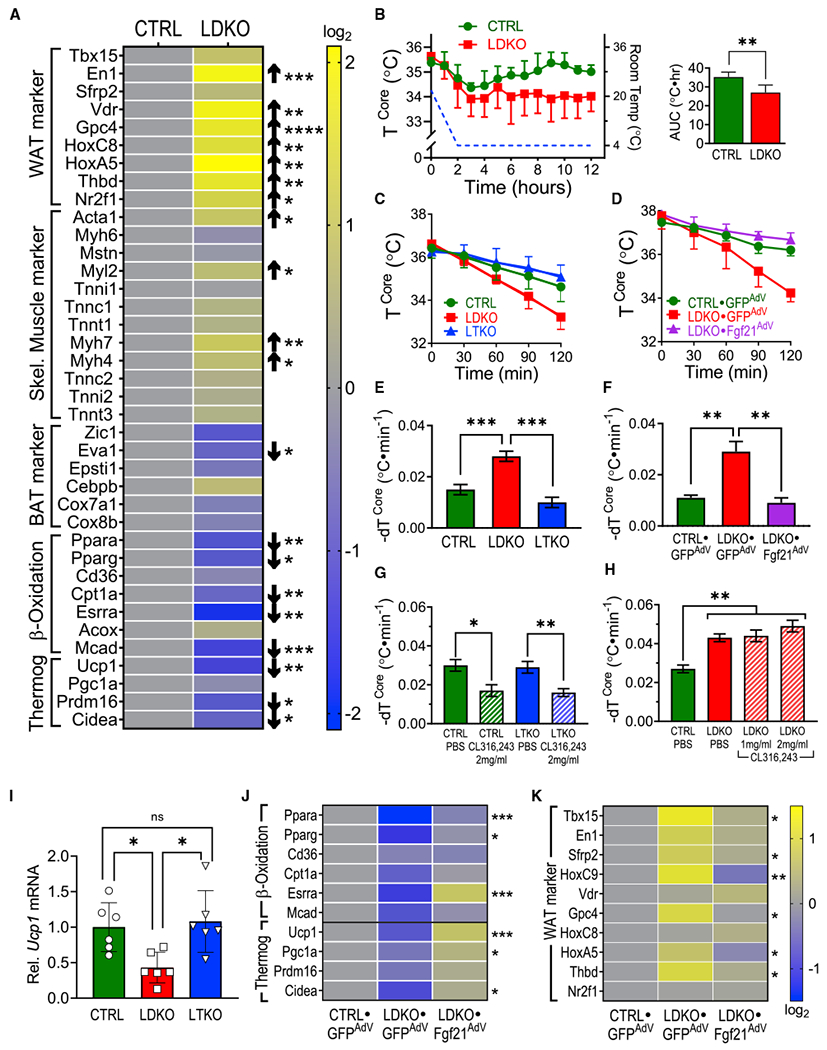
Fgf21 (fibroblast growth factor 21) is a regulatory hepatokine that, in pharmacologic form, powerfully promotes weight loss and glucose homeostasis. Although "Fgf21 resistance" is inferred from higher plasma Fgf21 levels in insulin-resistant mice and humans, diminished Fgf21 function is understood primarily via Fgf21 knockout mice. By contrast, we show that modestly reduced Fgf21-owing to cell-autonomous suppression by hepatic FoxO1-contributes to dysregulated metabolism in LDKO mice (Irs1L/L⋅Irs2L/L⋅CreAlb), a model of severe hepatic insulin resistance caused by deletion of hepatic Irs1 (insulin receptor substrate 1) and Irs2. Knockout of hepatic Foxo1 in LDKO mice or direct restoration of Fgf21 by adenoviral infection restored glucose utilization by BAT (brown adipose tissue) and skeletal muscle, normalized thermogenic gene expression in LDKO BAT, and corrected acute cold intolerance of LDKO mice. These studies highlight the Fgf21-dependent plasticity and importance of BAT function to metabolic health during hepatic insulin resistance.

Keywords: FGF21; FoxO1; brown adipose tissue; cold intolerance; glucose disposal; hepatic insulin resistance; hepatokine; insulin receptor substrate; peripheral insulin resistance.


Conflict of interest statement

Declaration of interests M.F.W. is an advisory board member of Housey Pharma (https://www.housey.com/).

Figures

Figure 1.
Figure 1.. Hepatic FoxO1 in LDKO mice dysregulates BAT and muscle glucose utilization and promotes lipid accumulation in brown adipocytes
(A and B) Glucose homeostasis in 12- to 13-week-old male mice assessed by (A) glucose tolerance test (n = 7, 8, and 12 mice) and (B) insulin tolerance test (n = 8, 6, and 8 mice). Inset graphs show areas under curves (AUCs). (C–F) Basal and insulin-stimulated uptake of [14C]2DOG into (C) epigonadal WAT, (D) inguinal WAT, (E) interscapular BAT, or (F) combined hindlimb skeletal muscles (Sk. muscle) of 14-week-old male mice (n = 5–8 mice for eWAT, iWAT, and Sk. muscle; n = 9–13 mice for BAT). (G–I) Body weights and body composition of 24-week-old CTRL, LDKO, and LTKO male mice (n = 22, 30, and 20 mice). DEXA-determined (H) fat mass and (I) lean masses are expressed as percentages of body weights in (G). (J) Weights of dissected interscapular BAT in 14- to 16-week-old male mice and respective double-floxed (Irs1L/L·Irs2L/L) or triple-floxed (Irs1L/L·Irs2L/L·FoxO1L/L) controls. Pictures show representative BAT depots.(K) Representative H&E-stained BAT sections (“CTRL” = Irs1L/L·Irs2L/L). Scale bar, 50 μm. (L) Quantification of adipocyte sizes in H&E-stained BAT sections. Points represent average area of individual adipocytes (n ≈ 20–30) in BAT samples from unique mice (n = 3, 3, and 2 mice). Lines or bars and error bars represent mean values ± SD. Differences between means were assessed by one-way ANOVA (A, B, G–J, and L) or by 2 × 3 factorial ANOVA (C–F), followed by Tukey’s HSD (honest significant difference)-based comparison of each group to every other: *p < 0.05; **p < 0.01; ***p < 0.001; ****p < 0.0001; ns, not significant. In (C)–(F), #p < 0.05 and ##p < 0.01 versus same genotype not treated with insulin.
Figure 2.
Figure 2.. Correction of hepatic Fgf21 insufficiency in LDKO mice normalizes BAT and muscle glucose uptake and restores peripheral insulin sensitivity
(A) Fgf21 mRNA expression in liver of fasted 16-week-old male mice (n = 7 mice per group). Data are normalized by the CTRL mean. (B) Serum Fgf21 concentration in fasted 12-week-old male mice (n = 13, 13, and 12 mice). (C) Serum Fgf21 concentration in fasted male mice 12 days after infection of the liver with GFPAdV or Fgf21AdV (n = 8 mice per group). (D and E) Glucose homeostasis 12–19 days after infection of mice with GFPAdV or Fgf21AdV, assessed by (D) glucose tolerance (n = 10, 16, and 16 mice) and (E) insulin tolerance tests (n = 13, 6, and 6 mice). Inset shows AUCs. (F) Serum insulin concentration 12 days after infection with GFPAdV or Fgf21AdV (n = 16, 8, and 10 mice). (G) Pyruvate tolerance test of HGP, approximately 24 days after infection with GFPAdV or Fgf21AdV (n = 6, 7, 7, and 7 mice). Inset shows AUCs. (H–J) Basal and insulin-stimulated uptake of [14C]2DOG into (H) epigonadal WAT, (I) inguinal WAT, or (J) interscapular BAT 12 days after infection of mice with GFPAdV or Fgf21AdV (n = 5 and 5 CTRL·GFPAdV, 8 and 7 LDKO·GFPAdV, and 5 and 8 LDKO·Fgf21AdV mice). (K) Expression of GLUT1 (Slc2a1) and GLUT4 (Slc2a4) mRNAs in CTRL and LDKO BAT, 12 days after infection with GFPAdV or Fgf21AdV (n = 6 mice per group). RNA quantities are expressed relative to CTRL means. (L) Basal and insulin-stimulated uptake of [14C]2DOG into combined hindlimb skeletal muscles of CTRL and LDKO male mice 12 days after infection with GFPAdV or Fgf21AdV (n = 4 and 4 CTRL·GFPAdV, 5 and 8 LDKO·GFPAdV, and 5 and 7 LDKO·Fgf21AdV mice). Lines or bars and error bars represent mean values ± SD. Differences between means were assessed by unpaired t test (A), one-way ANOVA (B–G and K), or 2 × 3 factorial ANOVA (H–J and L), followed by Tukey’s HSD-based comparison of each group to every other: *p < 0.05; **p < 0.01; ***p < 0.001; ****p < 0.0001 between indicated groups. In (H)–(J) and (L), #p < 0.05, ##p < 0.01, and ###p < 0.001 versus same genotype, no insulin.
Figure 3.
Figure 3.. Normalized Fgf21 expression maintains glucose homeostasis in LTKO mice
(A) Serum Fgf21 concentration in 12-week-old male non-infected CTRL and LDKO mice or LTKO mice 12 days after infection with scRNAAdV (non-targeting control virus) or shFgf21AdV (n = 6, 5, 6, and 6 mice). (B and C) Glucose homeostasis in control and adenovirus-infected mice, assessed by (B) glucose tolerance (n = 7, 5, 7, and 6 mice) and (C) insulin tolerancetests (n = 5, 7, 6, and 6 mice) performed 10 or 17 days after infection, respectively. Inset graphs show AUCs. (D and E) Basal or insulin-stimulated uptake of [14C]2DOG into (D) BAT or (E) skeletal muscle of non-infected LTKO mice and LTKO mice infected with scRNAAdV or shFgf21AdV (BAT: n = 5, 4, 5, and 4 mice; Sk. muscle: n = 5, 4, 3, and 4 mice). Glucose uptake was assessed approximately 3.5 weeks after infection. (F) Relative mRNA expression of known PPARα target genes in liver of fasted LDKO and LTKO mice. Color scale shows log2 fold change versus floxed CTRL liver. (G) Expression of Fgf21 mRNA in primary hepatocytes infected at high (600) or low (200) MOI with Foxo1AdV to overexpress Foxo1 or with shFoxo1AdV to knock down Foxo1 expression. All data are expressed relative to the Fgf21 mRNA level in hepatocytes infected with control GFPAdV at low MOI. Except for GTT and ITT curves in (B) and (C) (mean ± SEM), lines or bars and error bars represent mean values ± SD. Differences between means were assessed by one-way ANOVA, followed by (A–E) Tukey’s HSD-based comparison of each group to every other or (G) comparison of each group to the average of the four control groups(open bars): *p < 0.05; **p < 0.01; ***p < 0.001; ****p < 0.0001 between indicated groups. In (D) and (E), †p < 0.05, ††p < 0.01, and †††p < 0.001 versus left bar (non-infected LTKO mice in basal condition).
Figure 4.
Figure 4.. Exogenous Fgf21 reduces weight and blood glucose in high-fat-diet-fed LDKO mice without correcting hepatic glucose production
(A and B) Body weights (A) and DEXA-determined adipose mass (B; as a percentage of body weight) in 24-week-old male CTRL, LDKO, and LTKO mice fed a high fat diet (HFD) (n = 28, 21, and 22 mice). (C) Serum Fgf21 concentration in fasted 14-week-old mice fed standard chow diet (CD) or HFD (from left to right: n = 8, 8, 10, 10, 11, or 9 mice).(D and E) Glucose homeostasis in 12- to 13-week-old male mice fed CD or HFD, assessed by (D) glucose tolerance (n = 10, 9, 10, and 10 mice) and (E) insulin tolerance tests (n = 10 mice per group). Inset graphs show areas under curves; ##p < 0.01 and ####p < 0.0001 for HFD- versus CD-fed mice of same genotype. (F) Basal and insulin-stimulated uptake of [14C]2DOG into BAT of 14-week-old male mice fed CD (n = 7, 5, 5, and 7 mice) or HFD (n = 9, 10, 8, and 9 mice). Significance was assessed within each diet. (G) Body weights of male HFD-fed CTRL and LDKO mice before and after infection with GFPAdV or Fgf21AdV (n = 5, 3, 5, and 3 mice). Vertical brackets denote equivalent mean weight loss (−26% or −27%) in CTRL and LDKO mice after infection with Fgf21AdV. Inset graph shows AUCs in the post-infection period. (H) Fed (afternoon) blood glucose concentrations of mice shown in (G). Inset graph shows AUCs in the post-infection period. (I) Basal and/or insulin-stimulated uptake of [14C]2DOG into BAT of HFD-fed CTRL and LDKO male mice 15 days after infection with GFPAdVor Fgf21AdV (n = 4, 5, 3, 5, and 3 mice); ##p < 0.01 and ###p < 0.001 versus CTRL·GFPAdV mice in basal condition. (J and K) Glucose homeostasis in HFD-fed CTRL and LDKO male mice infected with GFPAdV or Fgf21AdV, assessed by (J) GTT and (K) ITT assays performed 20 or 10 days after infection, respectively (n = 5, 3, 5, and 3 mice). Inset graphs show AUCs. (L) Pyruvate tolerance test of HGP in HFD-fed CTRL and LDKO mice30 days after infection with GFPAdV or Fgf21AdV (n = 5, 3, 5, and 3 mice). Inset graph shows areas under glucose excursion curves. Except for line graphs in (G), (H), (J), and (K) (mean ± SEM), lines or bars and error bars represent mean values ± SD. Differences between means were assessed with one-way ANOVA (A, B, and D–L) or 2 × 3 factorial ANOVA (C) followed by Tukey’s HSD-based comparison of each group to every other: *p < 0.05; **p < 0.01; ***p < 0.001; ****p < 0.0001 between indicated groups. Additional significant differences (# symbol) are described in (D), (E) and (I).
Figure 5.
Figure 5.. Cold intolerance and dysregulated BAT gene expression in LDKO mice are alleviated by restoration of hepatic Fgf21 expression
(A) qRT-PCR-based comparison of BAT gene expression in 12-week-old CTRL and LDKO mice (n = 6 and 6). Heatmap shows mean expression of genes characteristic of WAT, skeletal muscle, or BAT and of genes involved in fatty acid β-oxidation or thermogenesis. Color scale shows log2 fold change versus CTRL BAT. Gene-specific p values are indicated. (B) Body core temperature (TCore) versus room temperature (right-hand scale) of 14-week-old male CTRL and LDKO mice (n = 6 and 6) during chronic cold exposure. Mice were housed below thermoneutrality (22°C) for 3 days before the experiment. During the first 2 h, room temperature was reduced from 22°C to 4°C (dash line). Graph at right shows areas under TCore curves. (C) TCore during acute exposure to 4°C cold in 14-week-old male CTRL, LDKO, and LTKO mice (n = 8, 6, and 7 mice). (D) TCore during acute exposure to 4°C cold in 12-week-old male CTRL and LDKO mice 12 days after infection of the liver with GFPAdV or Fgf21AdV (n = 3 mice per group). (E and F) Negative rate of change in mouse core temperature (−dTCore; °C/min) during acute cold exposure, derived from linear regression of TCore data in (C) and (D). (G) Negative rate of change in TCore (−dTCore; °C/min) during acute cold exposure in 14-week-old male CTRL and LTKO mice (n = 5 mice per group). The mice were injected with β3 adrenergic receptor agonist CL316,243 (2 mg/mL) or vehicle (PBS) 1 h before transfer to 4°C (TCore data used to fit dT are in Figure S5C). (H) Negative rate of change in TCore (−dTCore; °C/min) during acute cold exposure in 14-week-old male CTRL and LDKO mice (n = 5 mice per group). The mice were injected with β3 adrenergic receptor agonist CL316,243 (1 or 2 mg/mL) or vehicle (PBS) 1 h before transfer to 4°C (TCore data used to fit dT are in Figure S5D). (I) Relative Ucp1 mRNA expression in BAT of 14-week-old CTRL, LDKO, and LTKO male mice (n = 6 mice per group). Data are normalized by the CTRL mean. (J and K) Relative BAT mRNA expression of (J) fatty acid β-oxidation and thermogenic genes (n = 5–7 mice/group) or (K) WAT marker genes (n = 8 mice/group) in 14-week-old male mice 12 days after infection with GFPAdV or Fgf21AdV. Color scale shows log2 fold change versus CTRL BAT. Significant differences are indicated for LDKO·GFPAdV versus LDKO·Fgf21AdV mice. Except for −dTCore data in (E)–(H) (mean ± SEM), lines or bars and error bars represent mean values ± SD. Differences between means were assessed by unpaired t tests (A, B, J, and K) or by one-way ANOVA (C–I) followed by Tukey’s HSD-based comparison of each group to every other: *p < 0.05; **p < 0.01; ***p < 0.001; ****p < 0.0001 between indicated groups.

Similar articles

Cited by

References

    1. Adams AC, Yang C, Coskun T, Cheng CC, Gimeno RE, Luo Y, and Kharitonenkov A (2012). The breadth of FGF21’s metabolic actions are governed by FGFR1 in adipose tissue. Mol. Metab 2, 31–37. - PMC - PubMed
    1. Ameka M, Markan KR, Morgan DA, BonDurant LD, Idiga SO, Naber MC, Zhu Z, Zingman LV, Grobe JL, Rahmouni K, and Potthoff MJ (2019). Liver derived FGF21 maintains core body temperature during acute cold exposure. Sci. Rep 9, 630. - PMC - PubMed
    1. Assini JM, Mulvihill EE, Burke AC, Sutherland BG, Telford DE, Chhoker SS, Sawyez CG, Drangova M, Adams AC, Kharitonenkov A, et al. (2015). Naringenin prevents obesity, hepatic steatosis, and glucose intolerance in male mice independent of fibroblast growth factor 21. Endocrinology 156, 2087–2102. - PubMed
    1. Badman MK, Pissios P, Kennedy AR, Koukos G, Flier JS, and Maratos-Flier E (2007). Hepatic fibroblast growth factor 21 is regulated by PPARalpha and is a key mediator of hepatic lipid metabolism in ketotic states. Cell Metab. 5, 426–437. - PubMed
    1. Badman MK, Koester A, Flier JS, Kharitonenkov A, and Maratos-Flier E (2009). Fibroblast growth factor 21-deficient mice demonstrate impaired adaptation to ketosis. Endocrinology 150, 4931–4940. - PMC - PubMed

Publication types

MeSH terms