. 2021 Jun;14(6):101046.
doi: 10.1016/j.tranon.2021.101046. Epub 2021 Mar 21.

Diverse and converging roles of ERK1/2 and ERK5 pathways on mesenchymal to epithelial transition in breast cancer

Affiliations

Diverse and converging roles of ERK1/2 and ERK5 pathways on mesenchymal to epithelial transition in breast cancer

Akshita B Bhatt et al. Transl Oncol. 2021 Jun.

Abstract

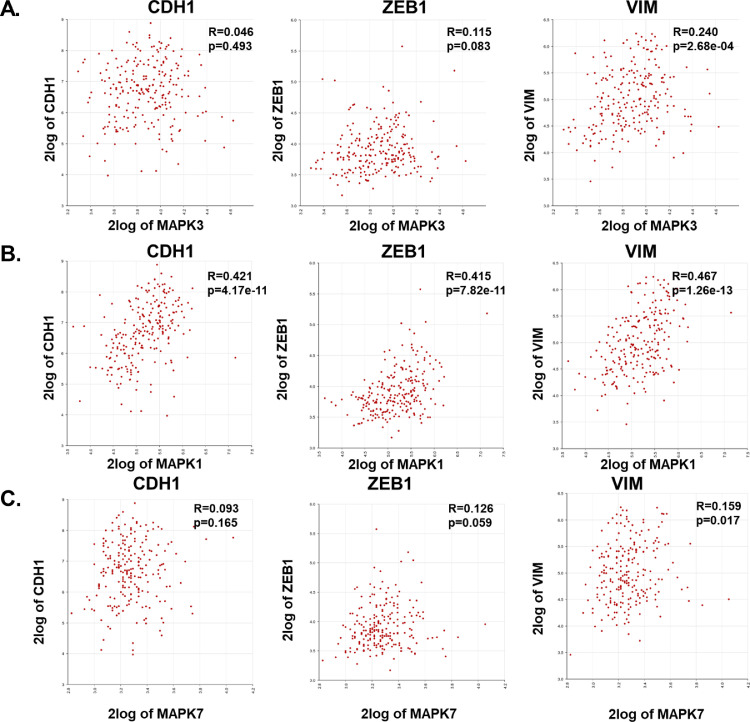
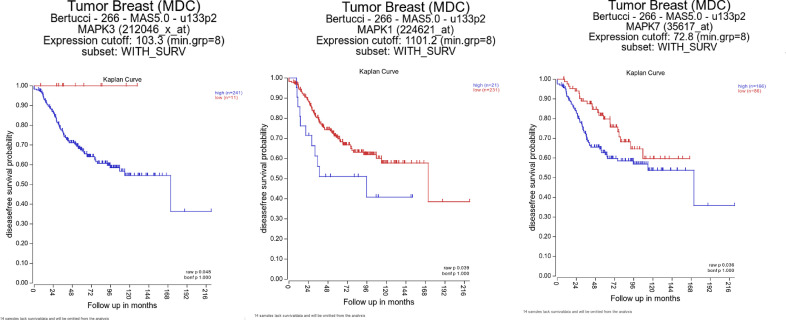
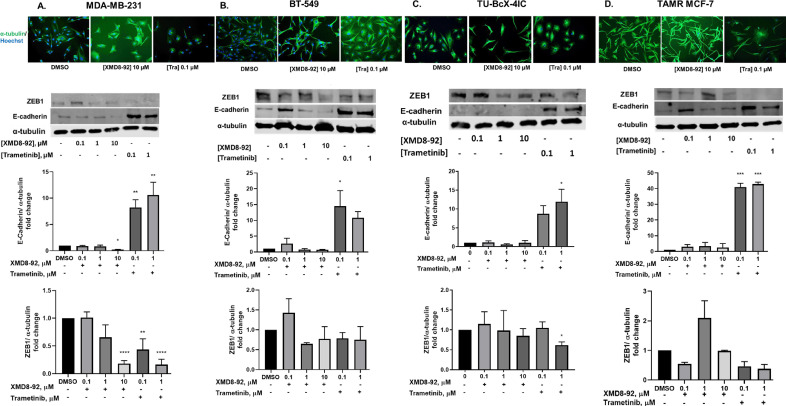
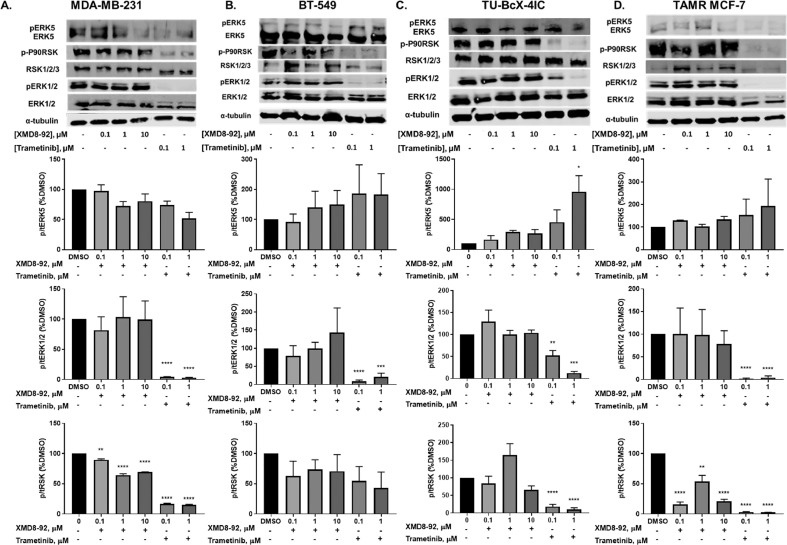
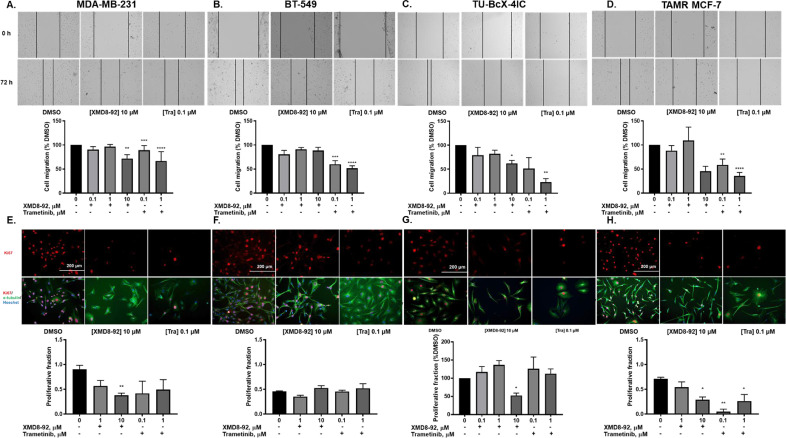
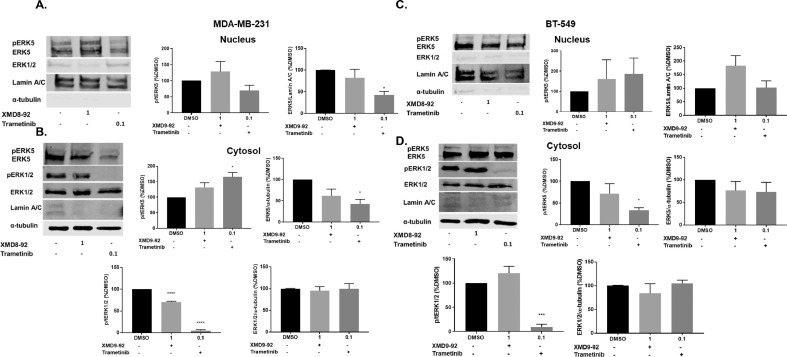
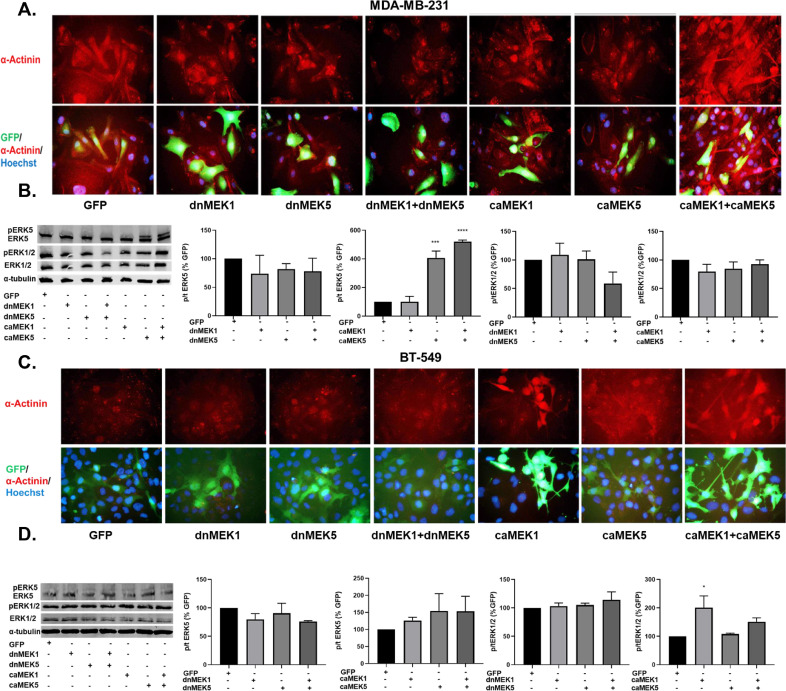
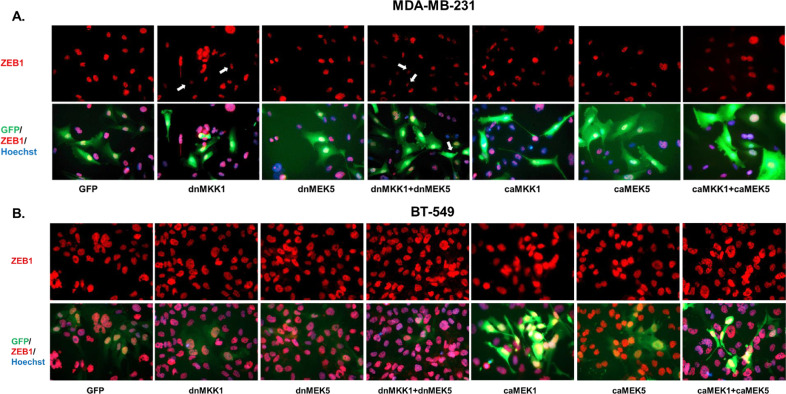
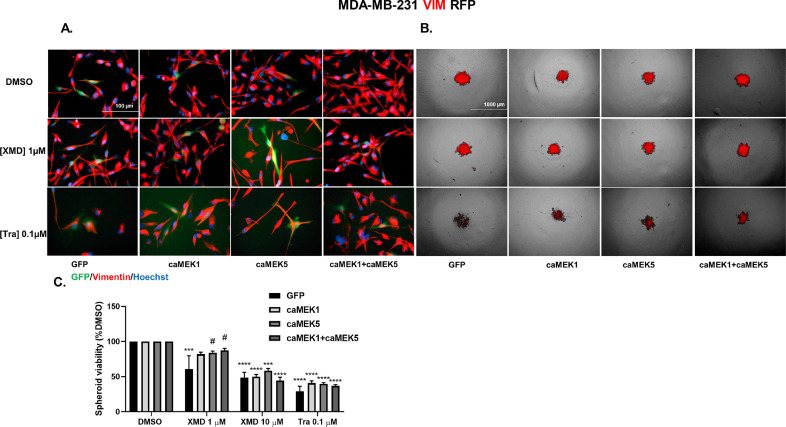
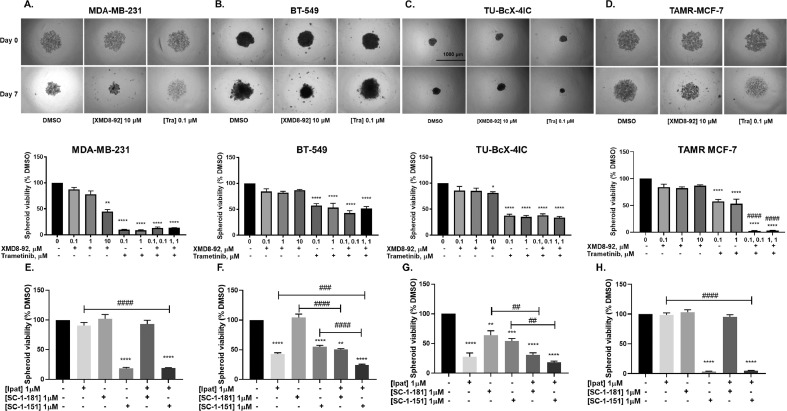
The epithelial to mesenchymal transition (EMT) is characterized by a loss of cell polarity, a decrease in the epithelial cell marker E-cadherin, and an increase in mesenchymal markers including the zinc-finger E-box binding homeobox (ZEB1). The EMT is also associated with an increase in cell migration and anchorage-independent growth. Induction of a reversal of the EMT, a mesenchymal to epithelial transition (MET), is an emerging strategy being explored to attenuate the metastatic potential of aggressive cancer types, such as triple-negative breast cancers (TNBCs) and tamoxifen-resistant (TAMR) ER-positive breast cancers, which have a mesenchymal phenotype. Patients with these aggressive cancers have poor prognoses, quick relapse, and resistance to most chemotherapeutic drugs. Overexpression of extracellular signal-regulated kinase (ERK) 1/2 and ERK5 is associated with poor patient survival in breast cancer. Moreover, TNBC and tamoxifen resistant cancers are unresponsive to most targeted clinical therapies and there is a dire need for alternative therapies. In the current study, we found that MAPK3, MAPK1, and MAPK7 gene expression correlated with EMT markers and poor overall survival in breast cancer patients using publicly available datasets. The effect of ERK1/2 and ERK5 pathway inhibition on MET was evaluated in MDA-MB-231, BT-549 TNBC cells, and tamoxifen-resistant MCF-7 breast cancer cells. Moreover, TU-BcX-4IC patient-derived primary TNBC cells were included to enhance the translational relevance of our study. We evaluated the effect of pharmacological inhibitors and lentivirus-induced activation or inhibition of the MEK1/2-ERK1/2 and MEK5-ERK5 pathways on cell morphology, E-cadherin, vimentin and ZEB1 expression. Additionally, the effects of pharmacological inhibition of trametinib and XMD8-92 on nuclear localization of ERK1/2 and ERK5, cell migration, proliferation, and spheroid formation were evaluated. Novel compounds that target the MEK1/2 and MEK5 pathways were used in combination with the AKT inhibitor ipatasertib to understand cell-specific responses to kinase inhibition. The results from this study will aid in the design of innovative therapeutic strategies that target cancer metastases.

Keywords: Breast cancer; ERK1/2; ERK5; Mesenchymal to epithelial transition (MET); Signaling.


Conflict of interest statement

Declaration of Competing Interest The authors have no conflicts of interests.

Figures

Fig. 1
Fig. 1
Correlation of ERK1, ERK2, or ERK5 with EMT markers in tumors derived from TNBC patients. Gene correlation between (A) MAPK3(ERK1), (B) MAPK1(ERK2), or (C) MAPK7 (ERK5) and EMT markers CDH1, ZEB1, or VIM was plotted using R2: Genomics analysis and visualization platform (https://hgserver1.amc.nl/cgi-bin/r2/main.cgi). Datasets were exported from Tumor Breast (triple negative) - Purrington - 226 - rma_sketch - hugene21t.
Fig. 2
Fig. 2
MAPK3, MAPK1, and MAPK7 expression correlates with poor patient survival in breast cancer. Disease free survival was analyzed using R2: Genomics analysis and visualization platform (https://hgserver1.amc.nl/cgi-bin/r2/main.cgi). Datasets were exported from Tumor Breast (MDC) Bertucci - 266 - MAS5.0 - u133p2.
Fig. 3
Fig. 3
ERK1/2 and ERK5 pathway inhibition induces MET in TNBC and TAMR MCF-7 cells. Cells were treated with XMD8-92 and trametinib at increasing concentrations for 72 hours. Cell morphology (20X magnification) and western blot analysis of EMT markers E-cadherin and ZEB1 in (A) MDA-MB-231 cells. (B) BT-549 cells (C) TU-BcX-4IC and (D) TAMR MCF-7 cells. Data represent the ± SEM of three different experiments for each inhibitor compared to DMSO control. *p<0.05; **p<0.01; ***p<0.001; ****p<0.0001 vs DMSO control group determined by one-way ANOVA with the Bonferroni post hoc test.
Fig. 4
Fig. 4
Western blot analysis of ERK5, ERK1/2, and RSK activation in TNBC cells. (A) MDA-MB-231, (B) BT-549, (C) TU-BcX-4IC, and (D) TAMR MCF-7 cells. Data represent the ± SEM of three different experiments for each inhibitor compared to DMSO control. *p<0.05; **p<0.01; ***p<0.001; ****p<0.0001 vs DMSO control group determined by one-way ANOVA with the Bonferroni post hoc test.
Fig. 5
Fig. 5
XMD8-92 and trametinib differentially decrease cell migration and proliferation in diverse breast cancer subtypes. (A) MDA-MB-231, (B) BT-549 cells, (C)TU-BcX-4IC, and (D) TAMR MCF-7 cells were treated with the kinase inhibitors and scratches were made after 48 hours of treatment. Cells were imaged at the time of scratch (0 h) and after 24 hours from the time of scratch (72 h) (20X magnification). Cell migration was measured as a percentage of DMSO control group. (E) MDA-MB-231, (F) BT-549, (G) TU-BcX-4IC and (H) TAMR MCF-7 cells were treated with XMD8-92 or trametinib for 72 hours (20X magnification). Proliferative fraction was evaluated as the number of Ki67 positive cells divided by the number of Hoechst positive cells. Data represent the ± SEM of three different experiments. *p<0.05; **p<0.01; ***p<0.001; ****p<0.0001 vs. DMSO control group determined by one-way ANOVA with the Bonferroni post hoc test.
Fig. 6
Fig. 6
Effect of XMD8-92 and trametinib on ERK5 and ERK1/2 activation in the nucleus and cytoplasm. (A) MDA-MB-231 nuclear fraction (B) MDA-MB-231 cytosolic fraction (C) BT-549 nuclear fraction (D) BT-549 cytosolic fraction (72 h). *p<0.05; ***p<0.001 vs control group determined by one-way ANOVA with the Bonferroni post hoc test.
Fig. 7
Fig. 7
MEK1 and MEK5 activation mediates EMT in TNBC cells. (A, B) MDA-MB-231 and (C, D) BT-549 cells were treated with dnMEK5, dnMEK1, caMEK5, and caMEK1 alone and in combination as represented in the figure. The cells were incubated for 96 hours. Immunofluorescence staining for α-actinin was performed to assess the morphology (40X magnification). The effect on ERK1/2 and ERK5 activation was evaluated. *p<0.05; **p<0.01 vs GFP control group determined by one-way ANOVA with the Bonferroni post hoc test.
Fig. 8
Fig. 8
MEK1 and MEK5 activation mediates ZEB1 expression in TNBC cells. (A) MDA-MB-231 and (B) BT-549 cells were treated with dnMEK5, dnMEK1, caMEK5, and caMEK1 alone and in combination as represented in the figure. The cells were incubated for 96 hours. Immunofluorescence staining for ZEB1 was performed (40X magnification).
Fig. 9
Fig. 9
MEK1 and/or MEK5 activation reduces the ability of XMD8-92 or trametinib to decrease spheroid viability or vimentin expression in MDA-MB-231 VIM RFP model. (A) MDA-MB-231 VIM RFP cells were treated with constitutively active MEK1, MEK5, and MEK1+MEK5 in the presence of DMSO, XMD8-92, or trametinib for 72 hours. The cells were fixed and stained with Hoechst. Images of Vimentin-, GFP-, and Hoechst-expressing cells were captured under 40X magnification using EVOS microscope (n=3, most representative image shown). (B) MDA-MB-231 VIM RFP cells were treated with constitutively active MEK1, MEK5, and MEK1+MEK5 in the presence of DMSO, XMD8-92, or trametinib for 96 hours. Images of spheroids under transmitted light and RFP channel were captured under 4X magnification using EVOS microscope (n=3, most representative image shown). (C) Spheroid viability was assessed after 7 days of treatment with the same groups. Data indicate ± SEM of experiments run in triplicate. ***p<0.001; ****p<0.0001 vs DMSO control group, #p<0.05; vs individual drug+GFP determined by two-way ANOVA with the Bonferroni post hoc test.
Fig. 10
Fig. 10
Effect of ERK1/2 and ERK5 inhibition alone and together on spheroid viability and ipatasertib sensitivity in diverse breast cancer subtypes. The spheroids were treated with increasing concentrations of XMD8-92 and/or trametinib for 7 days. Pictures of spheroids were obtained before treatment and 7 days after treatment (4X magnification) (A) MDA-MB-231, (B) BT-549, and (C) TU-BcX-4IC, and (D) TAMR MCF-7 cells. Effect of SC-1-151 and SC-1-181 alone and in combination with ipatasertib on spheroid viability in (E) MDA-MB-231, (F) BT-549, (G) TU-BcX-4IC and (H) TAMR MCF-7 cells. Spheroid viability was assessed on day 7 after treatment. Data indicate ± SEM of experiments run in triplicate *p<0.05; **p<0.01; ***p<0.001; ****p<0.0001 vs DMSO control group, ##p<0.01; ###p<0.001; ####p<0.0001 vs individual drug determined by one-way ANOVA with the Bonferroni post hoc test.

Similar articles

Cited by

References

    1. Chaffer C.L., Weinberg R.A. A perspective on cancer cell metastasis. Science (New York, N.Y.) 2011;331(6024):1559–1564. - PubMed
    1. Thiery J.P., Sleeman J.P. Complex networks orchestrate epithelial-mesenchymal transitions. Nat. Rev. Mol. Cell Biol. 2006;7(2):131–142. - PubMed
    1. Kalluri R., Weinberg R.A. The basics of epithelial-mesenchymal transition. J. Clin. Invest. 2009;119(6):1420–1428. - PMC - PubMed
    1. Oka H., Shiozaki H., Kobayashi K., Inoue M., Tahara H., Kobayashi T., Takatsuka Y., Matsuyoshi N., Hirano S., Takeichi M. Expression of E-cadherin cell adhesion molecules in human breast cancer tissues and its relationship to metastasis. Cancer Res. 1993;53(7):1696–1701. - PubMed
    1. Moll R., Mitze M., Frixen U.H., Birchmeier W. Differential loss of E-cadherin expression in infiltrating ductal and lobular breast carcinomas. Am. J. Pathol. 1993;143(6):1731–1742. - PMC - PubMed