Meta-Analysis
. 2021 Mar 26;100(12):e24971.
doi: 10.1097/MD.0000000000024971.

Comorbidities' potential impacts on severe and non-severe patients with COVID-19: A systematic review and meta-analysis

Affiliations
Meta-Analysis

Comorbidities' potential impacts on severe and non-severe patients with COVID-19: A systematic review and meta-analysis

Sixiang Cheng et al. Medicine (Baltimore). .

Abstract

Background: An ongoing outbreak of pneumonia associated with the severe acute respiratory coronavirus (SARS-CoV-2) emerged in December 2019 in Wuhan, China. Epidemiologic evidence suggests that patients with comorbidities and novel coronavirus disease 2019 (COVID-19) infection may have poor survival outcomes. However, the risk of these coexisting medical conditions in severe and non-severe cases has not been systematically reported.

Purpose: The present study aimed to estimate the association of chronic comorbidities in severe and non-severe cases.

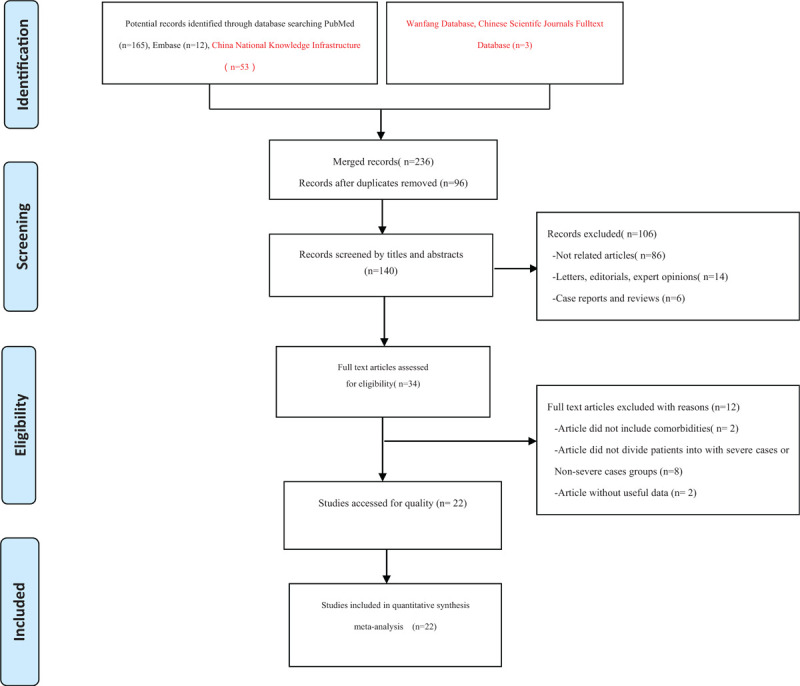
Methods: A literature search was conducted using the databases PubMed, Embase, China National Knowledge Infrastructure (CNKI), and Wanfang Database, Chinese Scientific Journals Full-text Database (CQVIP) from the inception dates to April 1, 2020, to identify cohort studies assessing comorbidity and risk of adverse outcome. Either a fixed- or random-effects model was used to calculate the overall combined risk estimates.

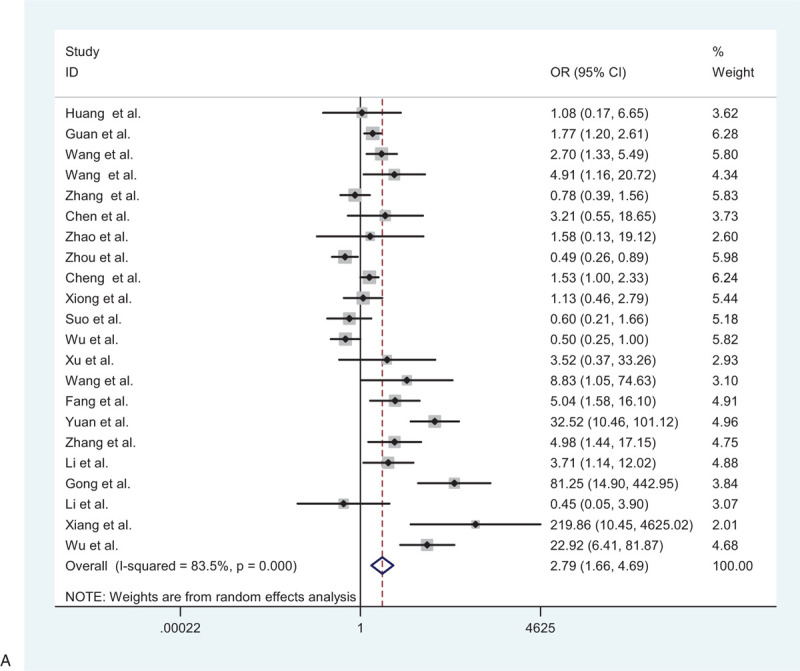
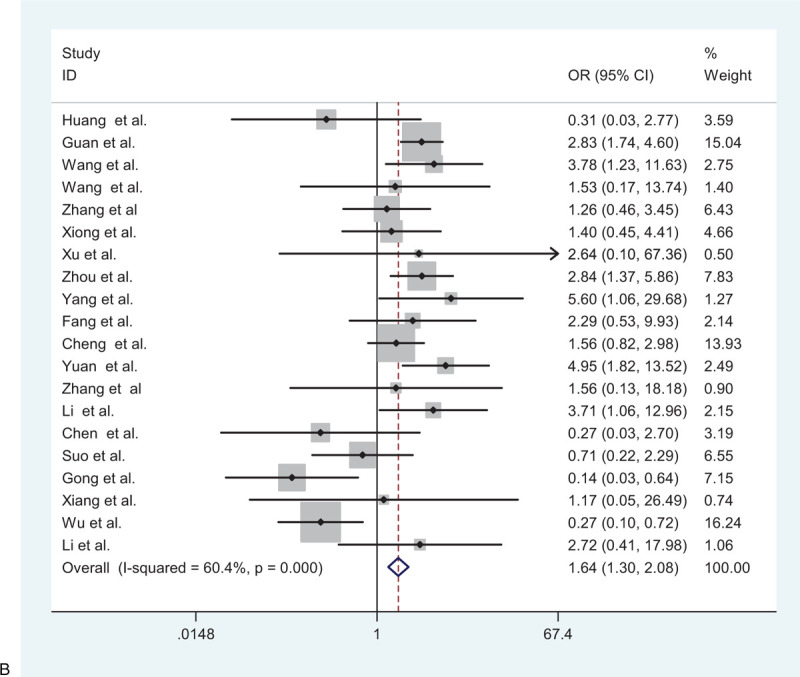
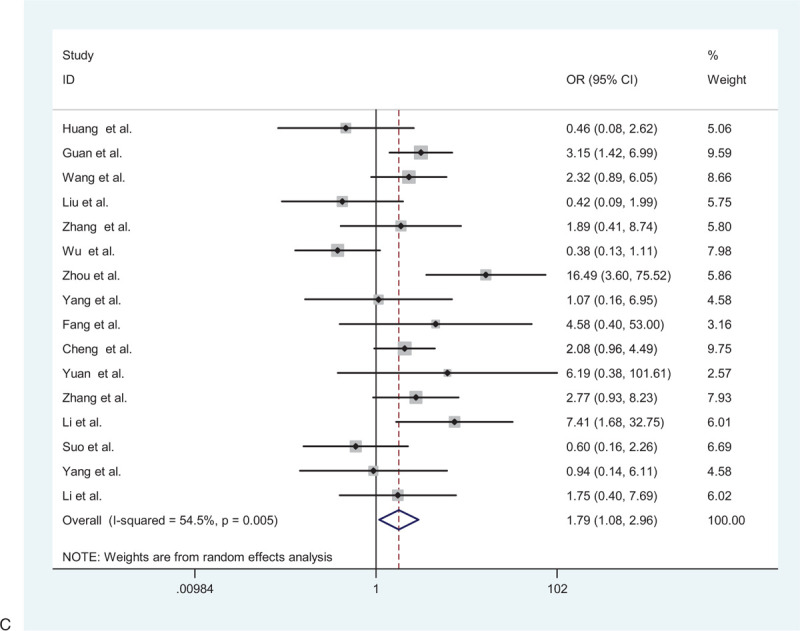
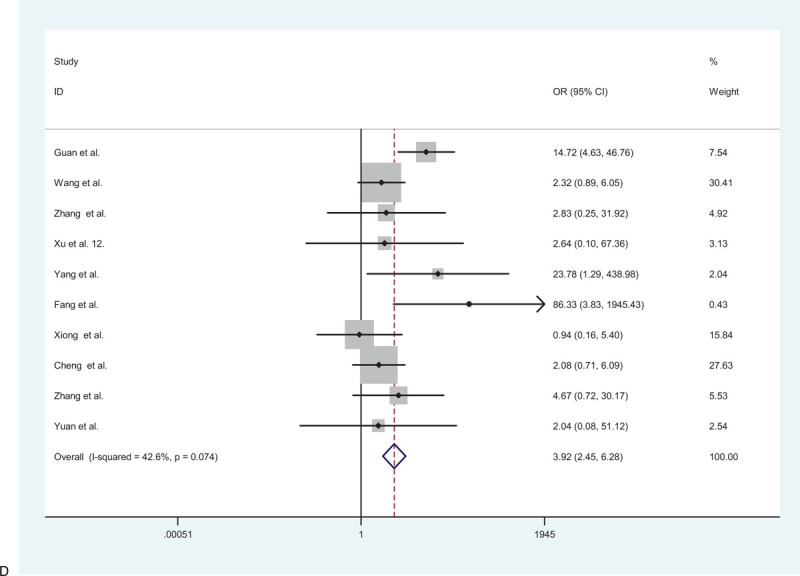
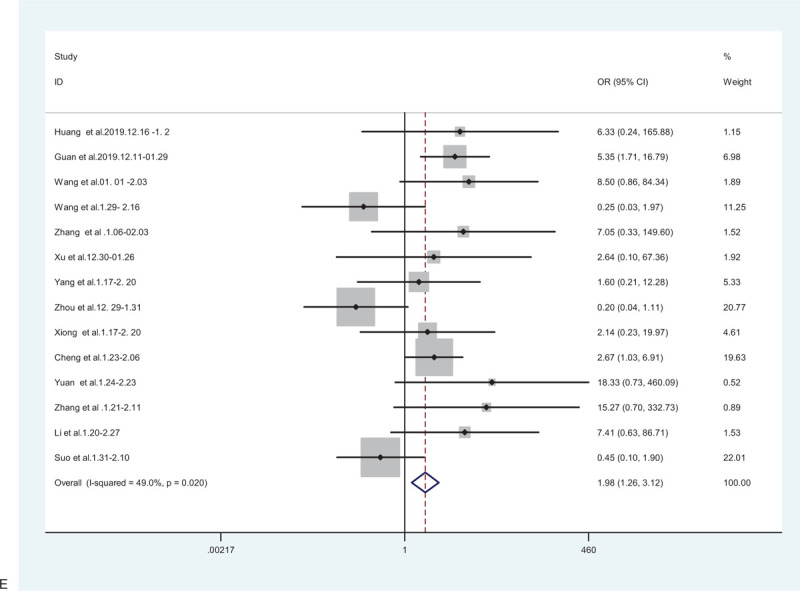
Results: A total of 22 studies involving 3286 patients with laboratory-confirmed COVID-19 were included in the analysis. Overall, compared with the patients with non-severe cases, the pooled odds ratios (ORs) of hypertension, diabetes mellitus, and cardiovascular, cerebrovascular, and respiratory diseases in patients with severe cases were 2.79 (95% confidence intervals [95% CI]: 1.66-4.69), 1.64 (95% CI: 2.30-1.08), 1.79 (95% CI: 1.08-2.96), 3.92 (95% CI: 2.45-6.28), and 1.98 (95% CI: 1.26-3.12), respectively.

Conclusions: This meta-analysis supports the finding that chronic comorbidities may contribute to severe outcome in patients with COVID-19. According to the findings of the present study, old age and 2 or more comorbidities are significantly impactful to COVID-19 outcomes in hospitalized patients in China.


Conflict of interest statement

The authors have no conflicts of interest to disclose.

Figures

Figure 1
Figure 1
Flow diagram of included/excluded studies. A total of 236 documents were found in the initial search. After removing duplicates, reading titles, abstracts and full texts, and evaluating the quality of the articles, 22 eligible studies were included and analyzed.
Figure 2
Figure 2
(A) Forest plot for the association between hypertension and severe patients and non-severe patients. (B) Forest plot for the association between diabetes and severe patients and non-severe patients. (C) Forest plot for the association between cardiovascular disease and severe patients and non-severe patients. (D) Forest plot for the association between cerebrovascular disease and severe patients and non-severe patients. (E) Forest plot for the association between respiratory system disease and severe patients and non-severe patients.
Figure 2 (Continued)
(A) Forest plot for the association between hypertension and severe patients and non-severe patients. (B) Forest plot for the association between diabetes and severe patients and non-severe patients. (C) Forest plot for the association between cardiovascular disease and severe patients and non-severe patients. (D) Forest plot for the association between cerebrovascular disease and severe patients and non-severe patients. (E) Forest plot for the association between respiratory system disease and severe patients and non-severe patients.
Figure 3
Figure 3
Funnel plots of the 22 studies included in the meta-analysis.
Figure 4
Figure 4
Sensitivity analysis of comorbidities and risk in patients of COVID-19 between severe patients and non-severe patients.

References

    1. WHO. Novel Coronavirus – China. Jan 12, 2020. http://www.who.int/csr/don/12-january-2020-novel-coronavirus-china/en/. Accessed January 19, 2020.
    1. WHO. Novel Coronavirus – China. Jan 12, 2020. http://www.who.int/csr/don/12-january-2020-novel-coronavirus-china/en/. Accessed January 30, 2020.
    1. Chen L, Liu W, Zhang Q, et al. RNA based mNGS approach identifies a novel human coronavirus from two individual pneumonia cases in 2019 Wuhan outbreak. Emerg Microbes Infect 2020;9:313–9. - PMC - PubMed
    1. Novel Coronavirus-infected Pneumonia is Managed as Class A Infectious Disease. [EB/OL]. (20200120). http://www.nhc.gov.cn/jkj/s3578/202001/3a13637e1a9249a2b6047f34b772b5e6..... Accessed February 20, 2020.
    1. WHO. Report of the WHO-China Joint Mission on coronavirus disease 2019 (COVID-19). Beijing, Feb 28, 2020. https://www.who.int/docs/coronaviruse/who-china-joint-mission-on-covid-1.... Accessed March 20, 2020.