. 2021 Mar 24;13(1):45.
doi: 10.1186/s13073-021-00842-w.

CACTUS: integrating clonal architecture with genomic clustering and transcriptome profiling of single tumor cells

Affiliations

CACTUS: integrating clonal architecture with genomic clustering and transcriptome profiling of single tumor cells

Shadi Darvish Shafighi et al. Genome Med. .

Abstract

Background: Drawing genotype-to-phenotype maps in tumors is of paramount importance for understanding tumor heterogeneity. Assignment of single cells to their tumor clones of origin can be approached by matching the genotypes of the clones to the mutations found in RNA sequencing of the cells. The confidence of the cell-to-clone mapping can be increased by accounting for additional measurements. Follicular lymphoma, a malignancy of mature B cells that continuously acquire mutations in parallel in the exome and in B cell receptor loci, presents a unique opportunity to join exome-derived mutations with B cell receptor sequences as independent sources of evidence for clonal evolution.

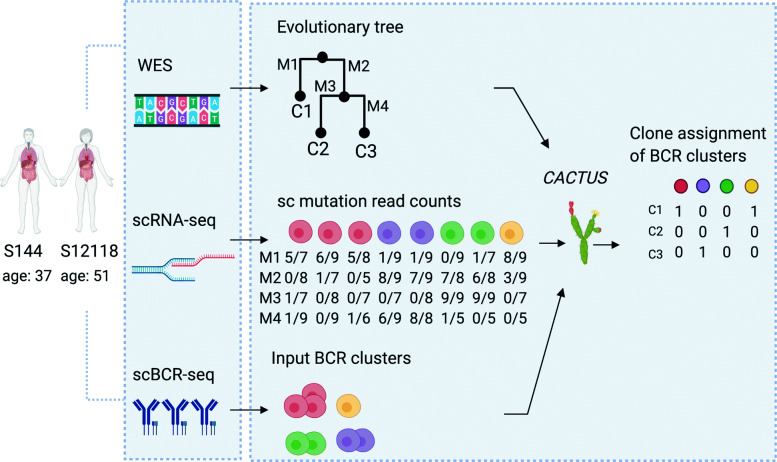
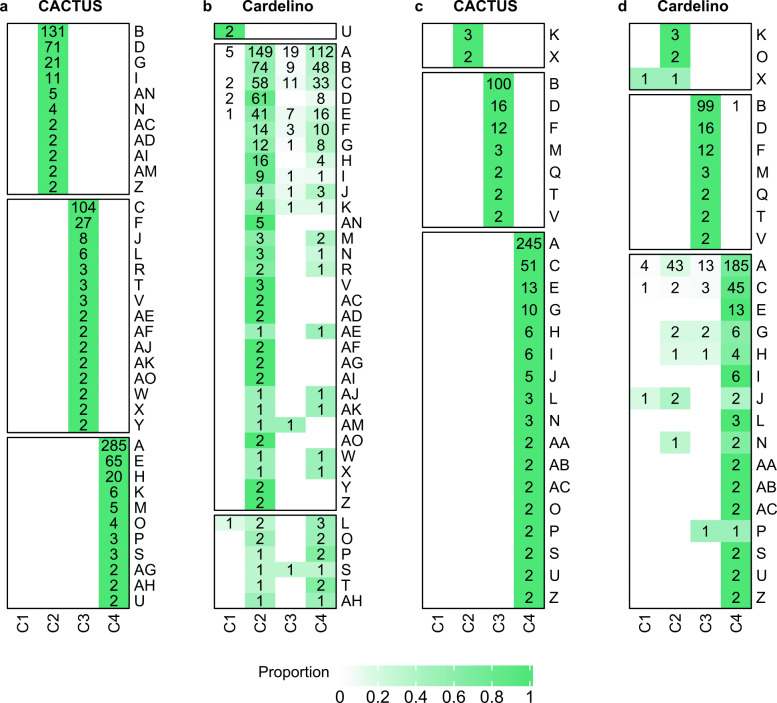
Methods: Here, we propose CACTUS, a probabilistic model that leverages the information from an independent genomic clustering of cells and exploits the scarce single cell RNA sequencing data to map single cells to given imperfect genotypes of tumor clones.

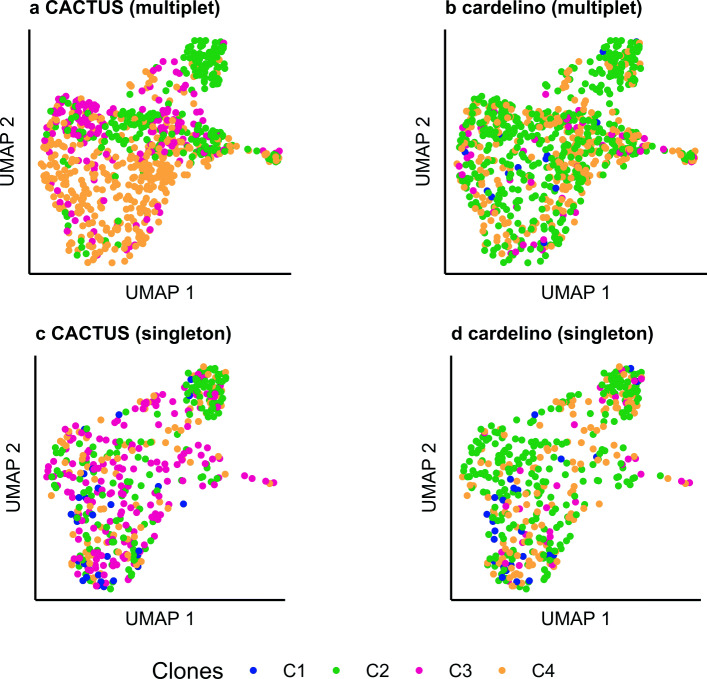
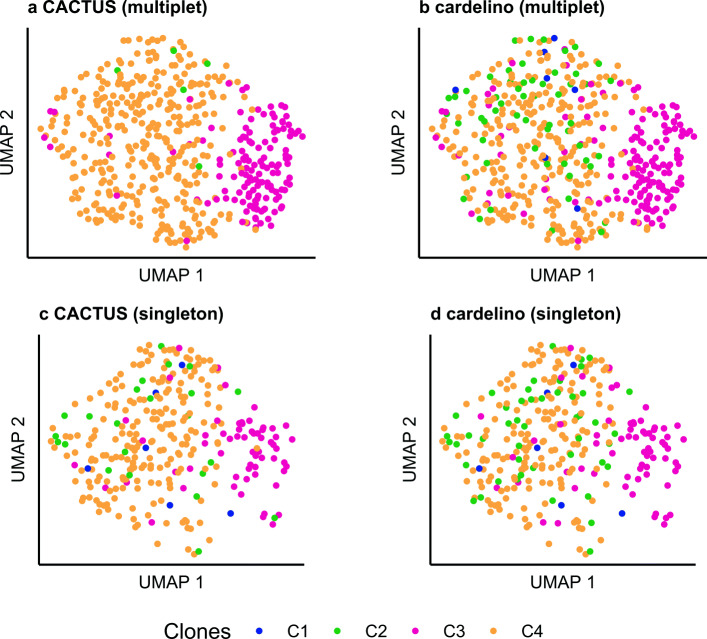
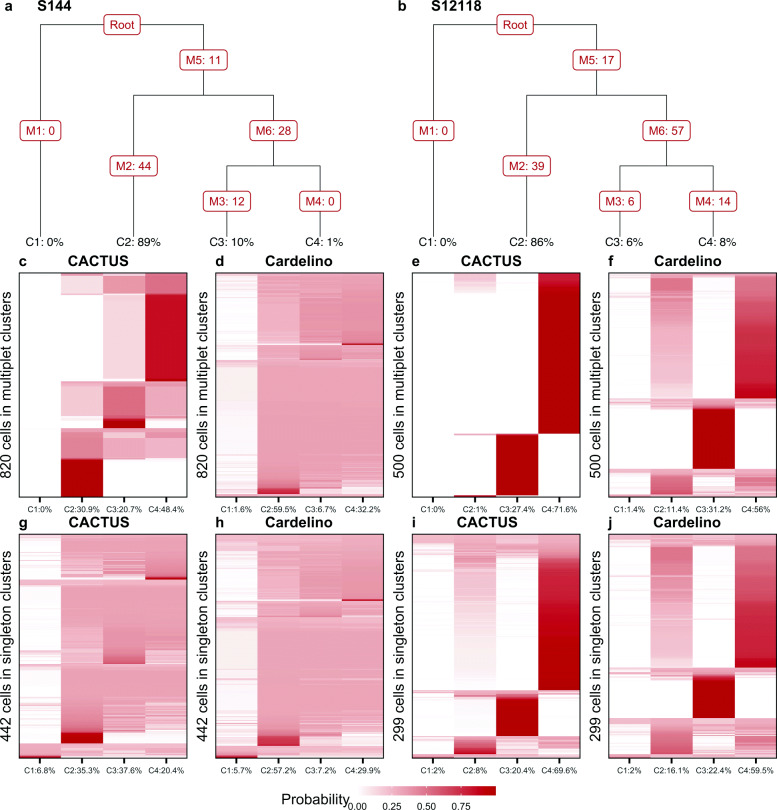
Results: We apply CACTUS to two follicular lymphoma patient samples, integrating three measurements: whole exome, single-cell RNA, and B cell receptor sequencing. CACTUS outperforms a predecessor model by confidently assigning cells and B cell receptor-based clusters to the tumor clones.

Conclusions: The integration of independent measurements increases model certainty and is the key to improving model performance in the challenging task of charting the genotype-to-phenotype maps in tumors. CACTUS opens the avenue to study the functional implications of tumor heterogeneity, and origins of resistance to targeted therapies. CACTUS is written in R and source code, along with all supporting files, are available on GitHub ( https://github.com/LUMC/CACTUS ).

Keywords: B cell receptor; Clonal evolution; Follicular lymphoma; Probabilistic graphical model; Single-cell sequencing; Somatic mutations.


Conflict of interest statement

The authors declare that they have no competing interests.

Figures

Fig. 1
Fig. 1
Overview of the patient data analysis and the CACTUS model. Whole-exome sequencing and single-cell sequencing of all transcripts, as well as single-cell sequencing of BCR, were performed on samples from two FL patients. Using WES, imperfect clonal evolution could be inferred and given as a prior to the model (C1, C2, …). From scRNA-seq, allele-specific transcript counts (mutated/total) were extracted at mutated positions (M1,M2, …). Input BCR clusters were defined as clusters of cells with identical BCR heavy chain sequences. The data of input tumor clones, mutation transcript counts, and given single-cell clusters (here, the BCR clusters) are combined in the CACTUS model for inference of the clonal assignment of the clusters. Both the input clone genotypes and clustering are considered potentially imperfect and are corrected during the inference using all available data. Image created with Biorender.com
Fig. 2
Fig. 2
The graphical model representation of CACTUS. Circle nodes are labeled with random variables in the model. Arrows correspond to local conditional probability distributions of the child variables given the parent variables. Observed variables are shown as grayed nodes. Double-circled nodes are deterministically obtained from their parent variables. Small filled circles correspond to hyperparameters. Ci,k denotes the true (corrected) genotype of clone k at variant position i. Ωi,k denotes the input clone genotypes, with Ωi,k=1 if the mutation i is present in clone k and 0 otherwise. Gj,q denotes the distance of the cell j to cluster q, computed based on the input clustering of cells. Tj=q indicates that cell j is in cluster q. pj,q is interpreted as the success probability for cell j to switch to cluster q. Ai,j denotes the observed count of unique transcripts with alternative (mutated) nucleotide mapped to position i in cell j. Di,j denotes the total unique transcripts count mapped to that position in that cell. Iq=k represents the assignment of cluster q to clone k. θi denotes the success probability of observing a transcript with the alternative nucleotide at a position i in a cell that carries this mutation, and θ0 the success probability of observing a transcript with the alternative nucleotide in a position that is not present in the cell. ξ is the error rate for the genotypes. {ν0,ν1,κ} constitutes the set of hyperparameters in the model
Fig. 3
Fig. 3
Validation of cell-to-clone assignment with gene expression for subject S144. a, b, c, d Transcript expression of the cells reduced to two dimensions using UMAP, shown separately for the cells in multiplet BCR clusters (a, b) and for cells belonging to singleton BCR clusters (c,d). Each point corresponding to a cell is colored by its clone assigned by CACTUS (a, c) and by cardelino [21] (b, d). The advantage of CACTUS in terms of agreement with gene expression is more pronounced for cells in multiplet BCR clusters
Fig. 4
Fig. 4
Validation of cell-to-clone assignment with gene expression for subject S12118. Figure panels as for subject S144 in Fig. 3. Also for subject S12118, assignment to clones for cells in multiplet BCR clusters using CACTUS (a) improves agreement with gene expression data compared to assignment of cells in singleton BCR clusters (d) and assignment using cardelino [21] (b), as quantified using connectivity measure (c). For singleton BCR clusters, CACTUS performs comparably well as cardelino
Fig. 5
Fig. 5
Confidence of cell assignment to the tumor clones. a, b Evolutionary trees inferred by Canopy [9] for subject S144 (a) and S12118 (b). Leaf labels: clone prevalences. Branch labels: numbers of acquired mutations. Canopy considers also CNVs, but they are not used for cell-to-clone mapping and hence not visualized here. Thus, the branch labels can be zero when the alterations acquired along that branch are copy number changes. Clone 1 corresponds to the base, normal clone. In tree a, clone 4 (C4) differs from clone 3 (C3) by the 12 SNVs acquired on the branch leading to the leaf C3. c–j Shades of brown indicate the probability of assignment of cells (y axis) to the clones (x axis; labeled with corrected prevalences, computed as the fraction of single cells assigned to the clones) by CACTUS (c, g, e, i) and cardelino [21] (d, h, f, j). For cells in multiplet BCR clusters (second row), CACTUS yields higher confidence of cell-to-clone assignment (c, e) than cardelino (d, f). For cells in singleton BCR clusters (third row) for subject S144, the confidence of cell-to-clone assignment by CACTUS (g) is similarly weak as by cardelino (h), while for S12118 and for CACTUS (i), the confidence is higher than for cardelino (j)
Fig. 6
Fig. 6
BCR cluster assignment to tumor clones, for both subjects. S144 (a, b) and S12118 (c, d), using CACTUS (a, c) and cardelino [21] (b, d). Heatmaps with shades of green indicate the proportion of cells in multiplet cluster (y axis) assigned to clones (x axis). Each number in a green entry indicates the non-zero number of cells of the corresponding BCR clusters assigned to the corresponding clone. Only BCR clusters of at least two cells are featured. As expected, for both subjects, CACTUS assigns entire BCR clusters to single clones (a, c). For cardelino, the proportions of BCR clusters are more distributed across the clones (b, d)

References

    1. Fittall MW, Van Loo P. Translating insights into tumor evolution to clinical practice: promises and challenges. Genome Med. 2019;11(1):20. doi: 10.1186/s13073-019-0632-z. - DOI - PMC - PubMed
    1. Yi S, Lin S, Li Y, Zhao W, Mills GB, Sahni N. Functional variomics and network perturbation: connecting genotype to phenotype in cancer. Nat Rev Genet. 2017;18(7):395. doi: 10.1038/nrg.2017.8. - DOI - PMC - PubMed
    1. Turajlic S, Sottoriva A, Graham T, Swanton C. Resolving genetic heterogeneity in cancer. Nat Rev Genet. 2019;20(7):404–16. doi: 10.1038/s41576-019-0114-6. - DOI - PubMed
    1. Kridel R, Sehn LH, Gascoyne RD. Pathogenesis of follicular lymphoma. J Clin Investig. 2012;122(10):3424–31. doi: 10.1172/JCI63186. - DOI - PMC - PubMed
    1. Pasqualucci L. Molecular pathogenesis of germinal center-derived b cell lymphomas. Immunol Rev. 2019;288(1):240–61. doi: 10.1111/imr.12745. - DOI - PubMed

Publication types