. 2021 Mar 24;9(1):51.
doi: 10.1186/s40478-021-01149-y.

Early alterations of neurovascular unit in the retina in mouse models of tauopathy

Affiliations

Early alterations of neurovascular unit in the retina in mouse models of tauopathy

Fan Xia et al. Acta Neuropathol Commun. .

Abstract

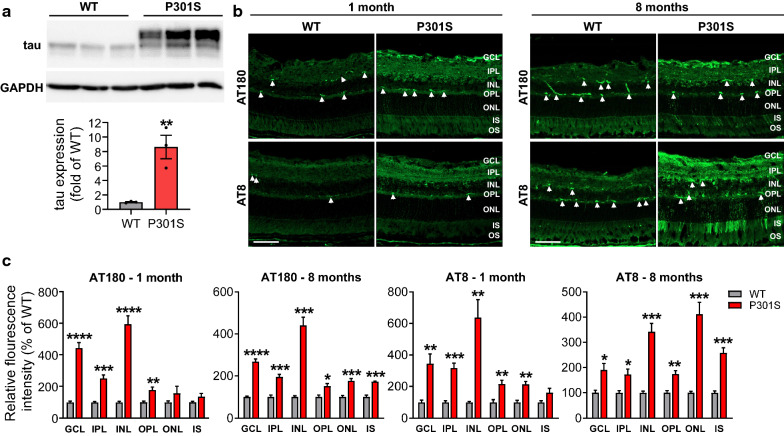
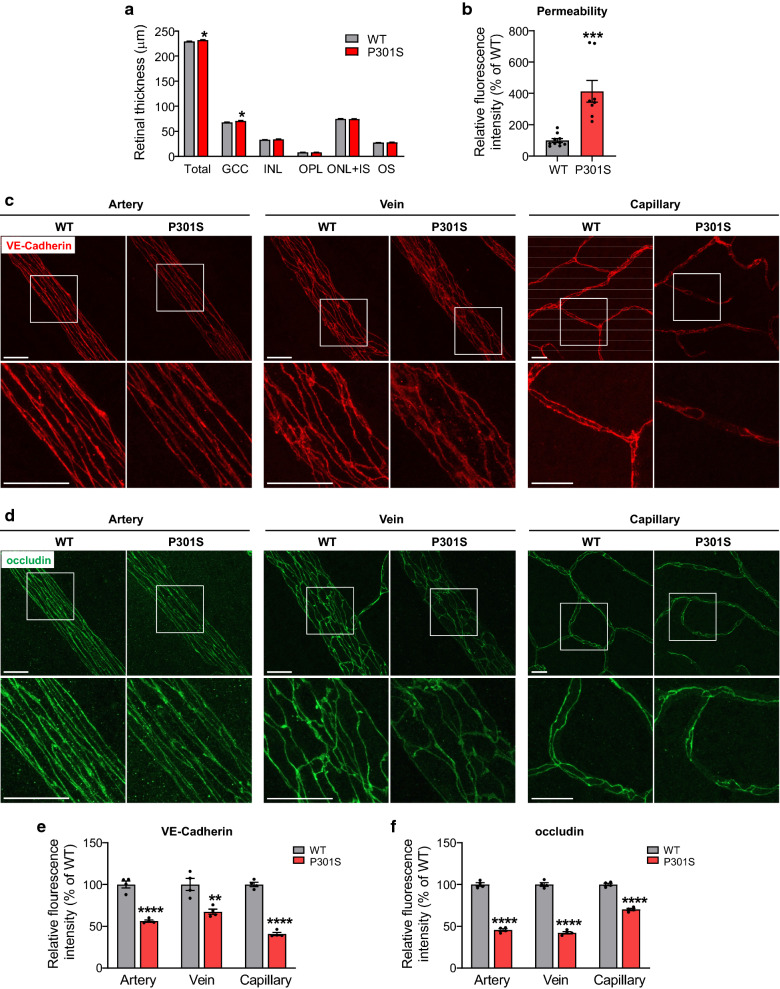
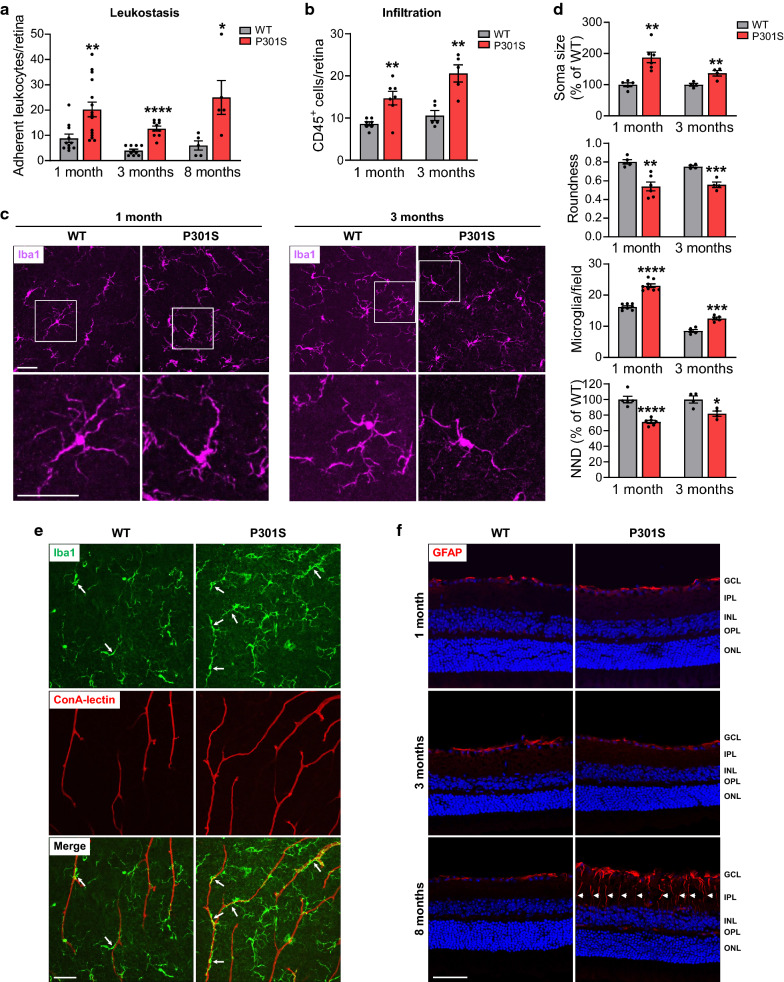
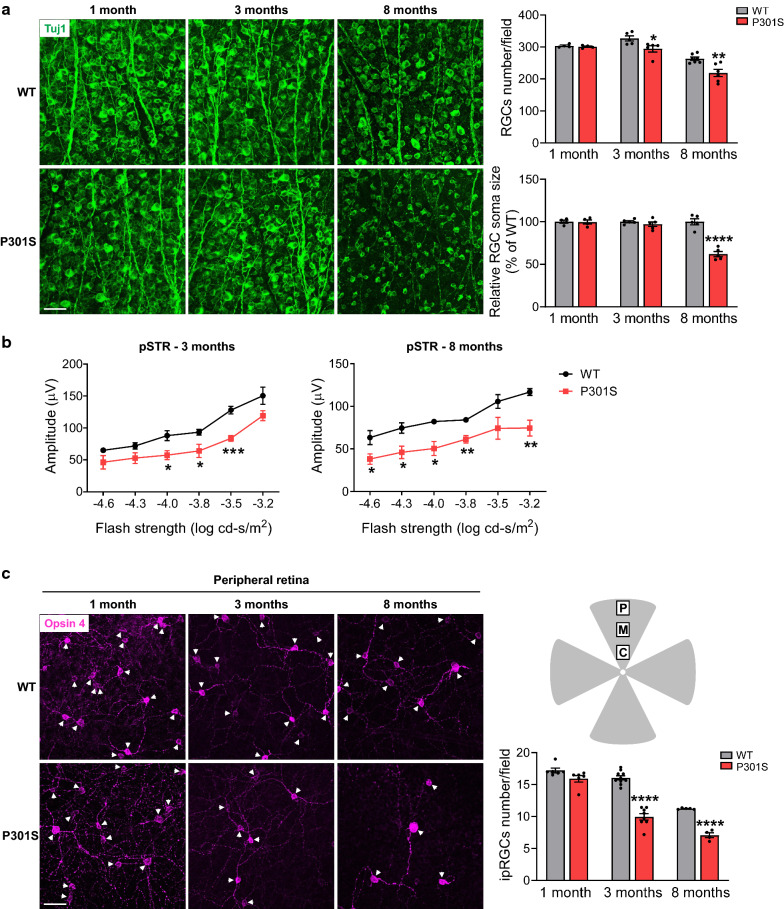
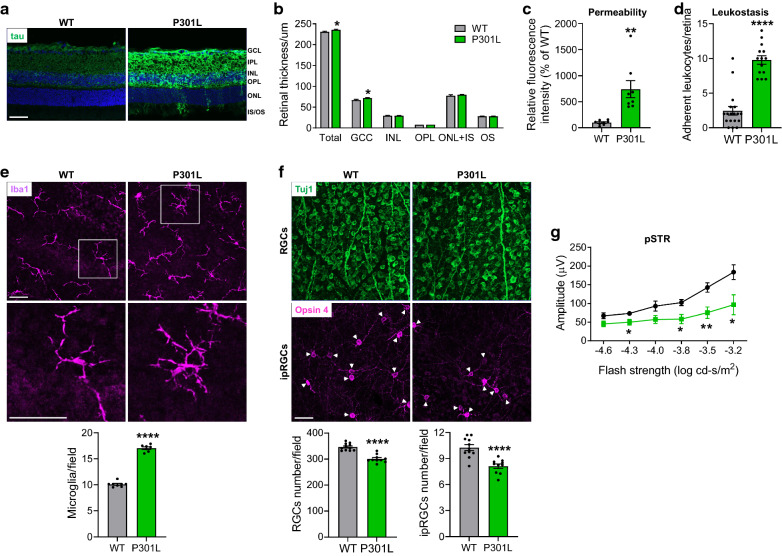
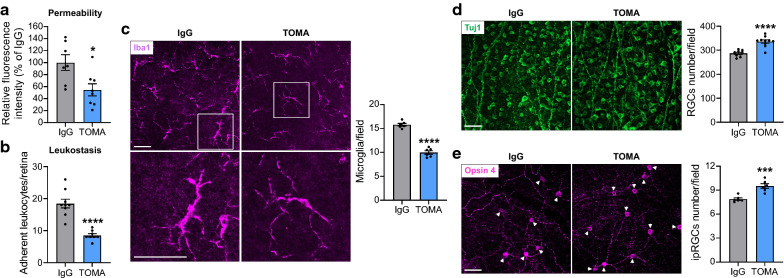
The retina, as the only visually accessible tissue in the central nervous system, has attracted significant attention for evaluating it as a biomarker for neurodegenerative diseases. Yet, most of studies focus on characterizing the loss of retinal ganglion cells (RGCs) and degeneration of their axons. There is no integrated analysis addressing temporal alterations of different retinal cells in the neurovascular unit (NVU) in particular retinal vessels. Here we assessed NVU changes in two mouse models of tauopathy, P301S and P301L transgenic mice overexpressing the human tau mutated gene, and evaluated the therapeutic effects of a tau oligomer monoclonal antibody (TOMA). We found that retinal edema and breakdown of blood-retina barrier were observed at the very early stage of tauopathy. Leukocyte adhesion/infiltration, and microglial recruitment/activation were constantly increased in the retinal ganglion cell layer of tau transgenic mice at different ages, while Müller cell gliosis was only detected in relatively older tau mice. Concomitantly, the number and function of RGCs progressively decreased during aging although they were not considerably altered in the very early stage of tauopathy. Moreover, intrinsically photosensitive RGCs appeared more sensitive to tauopathy. Remarkably, TOMA treatment in young tau transgenic mice significantly attenuated vascular leakage, inflammation and RGC loss. Our data provide compelling evidence that abnormal tau accumulation can lead to pathology in the retinal NVU, and vascular alterations occur more manifest and earlier than neurodegeneration in the retina. Oligomeric tau-targeted immunotherapy has the potential to treat tau-induced retinopathies. These data suggest that retinal NVU may serve as a potential biomarker for diagnosis and staging of tauopathy as well as a platform to study the molecular mechanisms of neurodegeneration.

Keywords: Leukocyte adhesion/infiltration; Microglial recruitment/activation; Neurodegeneration; Neurovascular unit; Retina; Tau oligomer monoclonal antibody; Tauopathy; Vascular leakage.


Conflict of interest statement

The authors declare that they have no competing interests.

Figures

Fig. 1
Fig. 1
Total and phosphorylated tau are increased in the retina of P301S mice. a Retinal lysates from 3-month-old WT and P301S mice were blotted with anti-tau (Tau-5) for total tau. GAPDH was used as internal control. Graph represents densitometric analysis of tau protein normalized to GAPDH. n = 3/group. b Retinal sections from 1 and 8-month-old WT and P301S mice were stained with AT180 and AT8 antibodies for phosphorylated tau (green). Arrowheads indicate non-specific staining. c Quantification of fluorescence intensity of AT180 and AT8 in individual retinal layers. Non-specific staining was removed when performing quantification. Scale bar: 50 µm. n = 4/group. *p < 0.05; **p < 0.01; ***p < 0.001; ****p < 0.0001 versus WT. GCL ganglion cell layer, IPL inner plexiform layer, INL inner nuclear layer, OPL outer plexiform layer, ONL outer nuclear layer, IS inner segment, OS outer segment
Fig. 2
Fig. 2
Blood–retina barrier integrity is impaired in the retina of P301S mice. a Bar graph represents the OCT analysis of thickness of total retina and individual retinal layers. n = 22/group. b Permeability assay. FITC-BSA was intravenously injected into 1-month-old WT and P301S mice. 1 h after injection, blood from circulation was removed by PBS perfusion, and albumin leakage from vessels to neuronal retina was measured by quantifying the fluorescence intensity in retinal homogenates and normalized to that of in the plasma. The normalized fluorescence intensity in WT mice was used as the reference. n = 8–10/group. c, d Representative images of the adherens junction protein VE-Cadherin and tight junction protein occludin in retinal flatmounts from WT and P301S mice at 1 month of age. Squares in the upper panel of images are zoomed in to show vascular integrity. Scale bar: 20 μm. n = 4/group. e, f Quantification of fluorescence intensity of VE-Cadherin and occludin. *p < 0.05; **p < 0.01; ***p < 0.001; ****p < 0.0001 versus WT. GCC ganglion cell complex, including all three innermost layers: nerve fiber layer, ganglion cell layer and inner plexiform layer, INL inner nuclear layer, OPL outer plexiform layer, ONL outer nuclear layer, IS inner segment, OS outer segment
Fig. 3
Fig. 3
Leukocyte adhesion/infiltration, microglial recruitment/activation and gliosis are increased in the retina of P301S mice. a WT and P301S mice were subjected to leukostasis assay at various ages. Bar graph represents the number of leukocytes adherent to the retinal vasculature per retina. n = 5–15/group. b Leukocytes were stained with anti-CD45 antibody in retinal flatmounts of WT and P301S mice, and infiltrated leukocytes in the retina were quantified. n = 5–7/group. c Microglia were stained with anti-Iba1 antibody (purple) at 1 and 3 months of age. Images were taken at the NFL-GCL by confocal microscopy. Squares in the upper panel of images are zoomed in to more clearly show microglial activation. d Bar graphs represent the quantification of morphological parameters of microglia at the NFL-GCL, including soma size and roundness, number and nearest neighbor distance (NND). n = 4–8/group. e Microglia were stained with anti-Iba1 antibody (green) and vasculature was co-labeled with ConA-lectin at 1 month of age. Images were taken at the NFL-GCL by confocal microscopy to show the relationship of microglia and vasculature. Arrows indicate those microglia close to vessels. n = 3/group. f The activation of Müller cells was assessed by immunostaining with antibody against GFAP (red) in retinal sections. Arrowheads indicate activated Müller cells. Blue staining indicates nuclei. n = 3–5/group. Scale bar: 50 µm. *p < 0.05; **p < 0.01; ***p < 0.001; ****p < 0.0001 versus WT. GCL ganglion cell layer, IPL inner plexiform layer, INL inner nuclear layer, OPL outer plexiform layer, ONL outer nuclear layer
Fig. 4
Fig. 4
RGCs and ipRGCs are impaired in the retina of P301S. a RGCs were stained with anti-Tuj1 antibody (green) in retinal flatmounts from WT and P301S mice at 1, 3 and 8 months of age. Bar graphs represent the number and soma size of RGCs per field. n = 4–7/group, eight images were taken at the peripheral retina for each sample and calculated as average value. b ERG analysis (pSTR) over a range of stimulus strengths in WT and P301S mice at 3 and 8 months of age. n = 4–5/group. c ipRGCs were stained with Opsin 4 antibody (purple) and the number of ipRGC at the peripheral retina was quantified. Arrowheads indicate the soma of ipRGCs. Schema depicts retinal area selected to take images. P peripheral area, M middle area; C central area. n = 4–10/group; eight images were taken at the peripheral retina for each sample and calculated as average value. Scale bar: 50 µm. *p < 0.05; **p < 0.01; ***p < 0.001; ****p < 0.0001 versus WT
Fig. 5
Fig. 5
Characterization of retinal pathogenesis in P301L mice at 3 months of age. a Total tau (green) was stained with tau antibody in retinal sections from 3-month-old WT and P301L mice. n = 4/group. b OCT analysis of retinal thickness. n = 20–26/group. c Retinal permeability. n = 8/group. d Leukostasis. Bar graph represents the number of stationary leukocytes adherent to the retinal vasculature per retina. n = 14–18/group. e Microglia were stained with anti-Iba1 antibody (purple) and images were taken at the NFL-GCL by confocal microscopy. Squares in the upper panel of images are zoomed in to show microglial activation. Bar graph represents the number of microglia at the NFL-GCL. n = 7–8/group. f Representative images of retinal flatmounts labeled with Tuj1 antibody (green) for RGCs and Opsin 4 antibody (purple) for ipRGCs at the peripheral retina. Arrowheads indicate the soma of ipRGCs. Bar graphs represent the numbers of RGCs and ipRGCs per field. n = 10–11/group; eight images were taken at the peripheral retina for each sample and calculated as average value. g ERG analysis (pSTR) over a range of stimulus strengths. n = 6/group. Scale bar: 50 µm. *p < 0.05; **p < 0.01; ****p < 0.0001 versus WT
Fig. 6
Fig. 6
TOMA treatment alleviates retinopathies. TOMA or control IgG was intravenously injected to P301L mice at 1 month of age and 1 week before sample collection at 3 months of age. a Retinal permeability. n = 7–8/group. b Leukostasis. Bar graph represents the number of stationary leukocytes adherent to the retinal vasculature per retina. n = 8–9/group. c Microglia were stained with anti-Iba1 antibody (purple) and images were taken at the NFL-GCL by confocal microscopy. Squares in the upper panel of images are zoomed in to show microglial activation. Bar graph represents the number of microglia at the NFL-GCL. n = 6/group. d, e Representative images of retinal flatmounts labeled with Tuj1 antibody (green) for RGCs and Opsin 4 antibody (purple) for ipRGCs at the peripheral retina. Arrowheads indicate the soma of ipRGCs. Bar graphs represent the numbers of RGCs (n = 9–10/group) and ipRGCs (n = 6/group) per field; eight images were taken at the peripheral retina for each sample and calculated as average value. Scale bar: 50 µm. * p < 0.05; ***p < 0.001; ****p < 0.0001 versus IgG

Similar articles

Cited by

References

    1. Al-Shabrawey M, Rojas M, Sanders T, Behzadian A, El-Remessy A, Bartoli M, et al. Role of NADPH oxidase in retinal vascular inflammation. Invest Ophthalmol Vis Sci. 2008;49:3239–3244. doi: 10.1167/iovs.08-1755. - DOI - PMC - PubMed
    1. Albert M, Mairet-Coello G, Danis C, Lieger S, Caillierez R, Carrier S, et al. Prevention of tau seeding and propagation by immunotherapy with a central tau epitope antibody. Brain. 2019;142:1736–1750. doi: 10.1093/brain/awz100. - DOI - PMC - PubMed
    1. Andreone BJ, Lacoste B, Gu C. Neuronal and vascular interactions. Annu Rev Neurosci. 2015;38:25–46. doi: 10.1146/annurev-neuro-071714-033835. - DOI - PMC - PubMed
    1. Apicco DJ, Ash PEA, Maziuk B, LeBlang C, Medalla M, Al Abdullatif A, et al. Reducing the RNA binding protein TIA1 protects against tau-mediated neurodegeneration in vivo. Nat Neurosci. 2018;21:72–80. doi: 10.1038/s41593-017-0022-z. - DOI - PMC - PubMed
    1. Ballatore C, Lee VM, Trojanowski JQ. Tau-mediated neurodegeneration in Alzheimer's disease and related disorders. Nat Rev Neurosci. 2007;8:663–672. doi: 10.1038/nrn2194. - DOI - PubMed

Publication types

LinkOut - more resources