. 2021 Jun:233:117975.
doi: 10.1016/j.neuroimage.2021.117975. Epub 2021 Mar 21.

Hybrid hyperalignment: A single high-dimensional model of shared information embedded in cortical patterns of response and functional connectivity

Affiliations

Hybrid hyperalignment: A single high-dimensional model of shared information embedded in cortical patterns of response and functional connectivity

Erica L Busch et al. Neuroimage. 2021 Jun.

Abstract

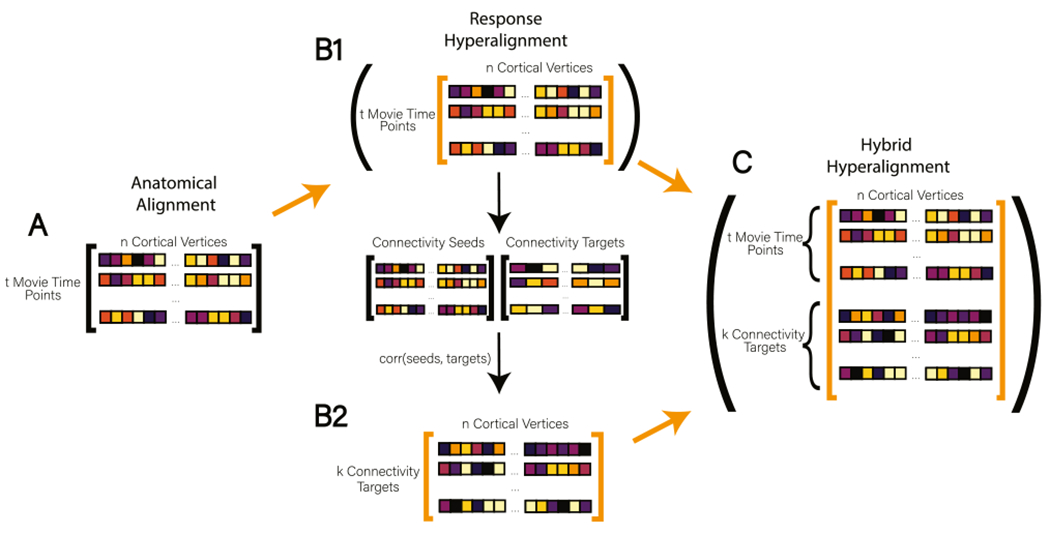
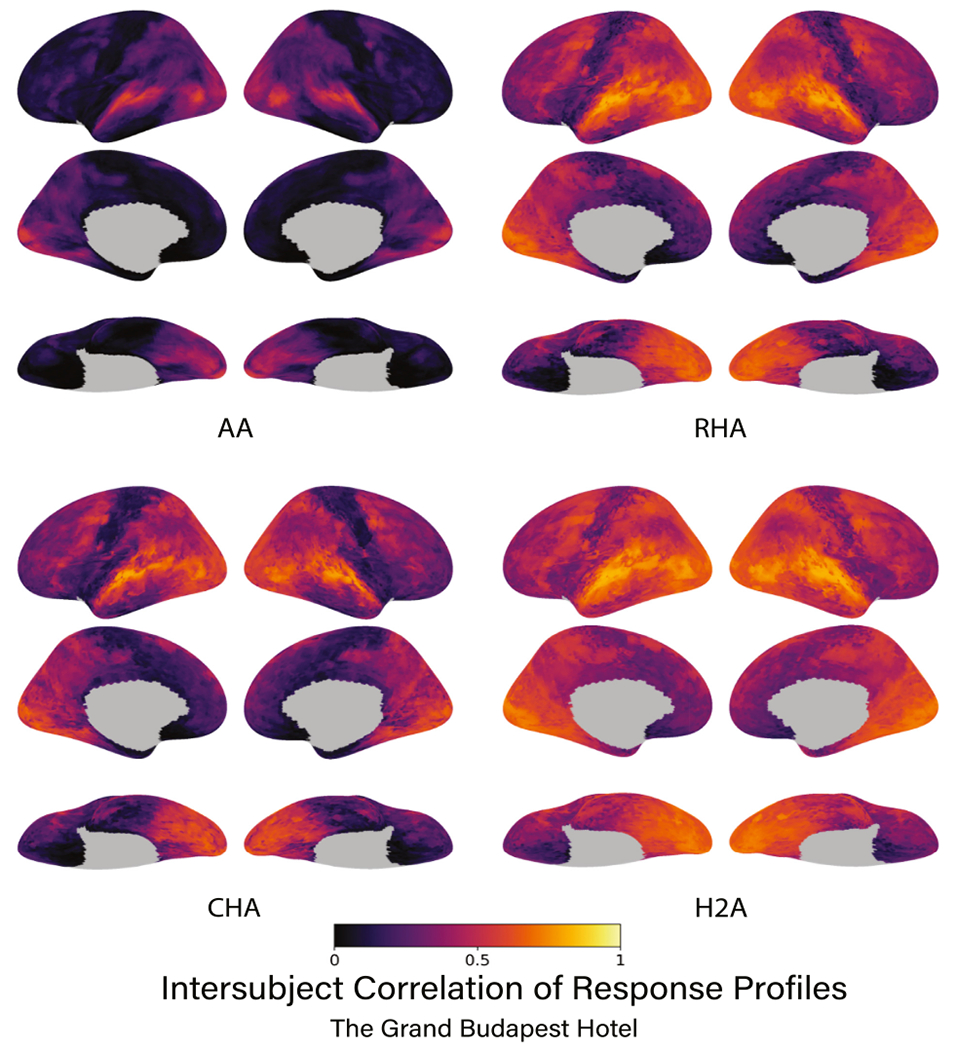
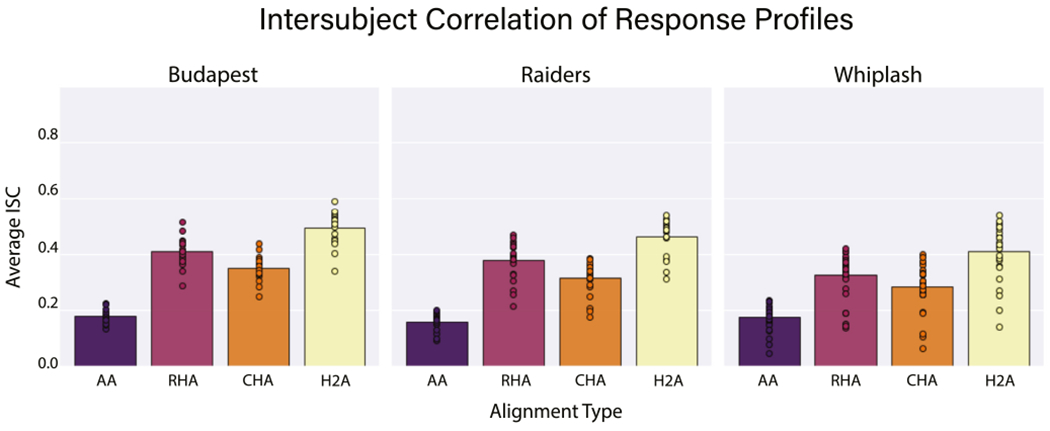
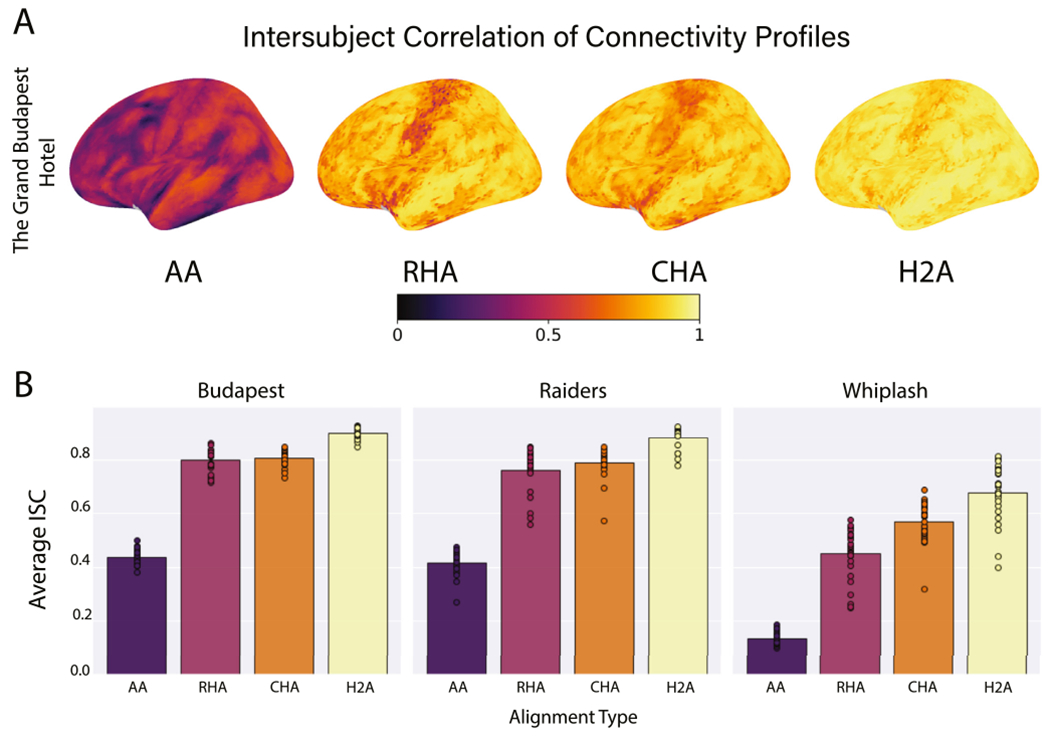
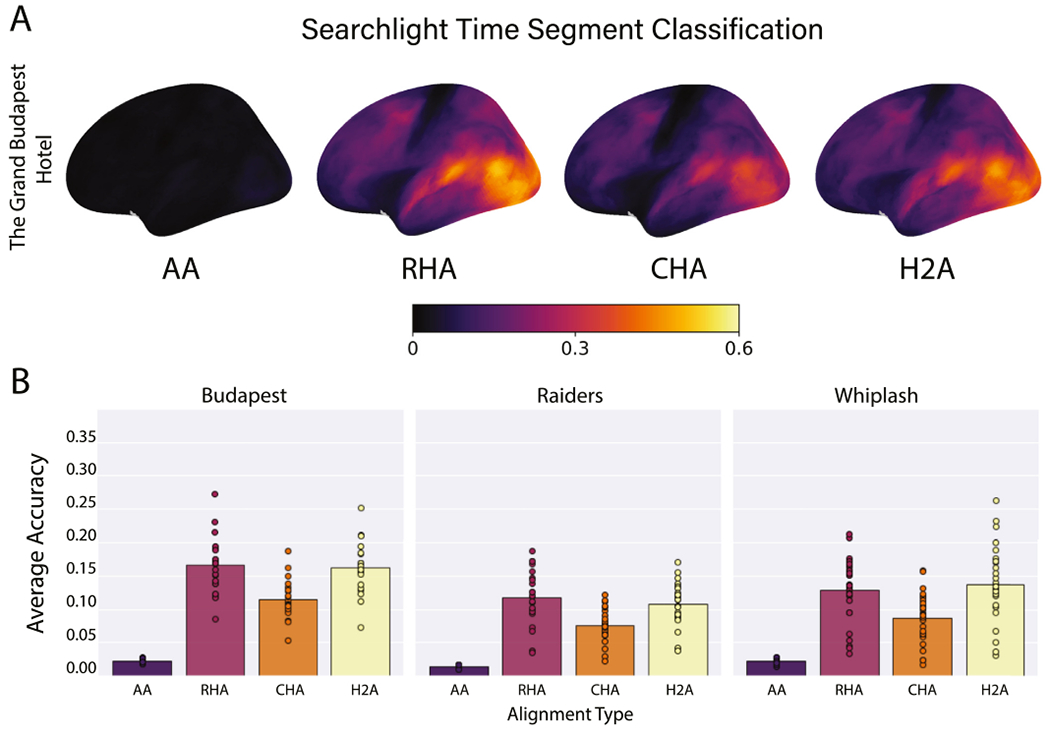
Shared information content is represented across brains in idiosyncratic functional topographies. Hyperalignment addresses these idiosyncrasies by using neural responses to project individuals' brain data into a common model space while maintaining the geometric relationships between distinct patterns of activity or connectivity. The dimensions of this common model capture functional profiles that are shared across individuals such as cortical response profiles collected during a common time-locked stimulus presentation (e.g. movie viewing) or functional connectivity profiles. Hyperalignment can use either response-based or connectivity-based input data to derive transformations that project individuals' neural data from anatomical space into the common model space. Previously, only response or connectivity profiles were used in the derivation of these transformations. In this study, we developed a new hyperalignment algorithm, hybrid hyperalignment, that derives transformations based on both response-based and connectivity-based information. We used three different movie-viewing fMRI datasets to test the performance of our new algorithm. Hybrid hyperalignment derives a single common model space that aligns response-based information as well as or better than response hyperalignment while simultaneously aligning connectivity-based information better than connectivity hyperalignment. These results suggest that a single common information space can encode both shared cortical response and functional connectivity profiles across individuals.

Keywords: Functional alignment; Functional connectivity; Hyperalignment; Naturalistic stimuli; fMRI.


Figures

Fig. 1.
Fig. 1.
The Hybrid Hyperalignment Algorithm. Orange arrows indicate a data matrix being passed to searchlight hyperalignment. (A) In Anatomical Alignment (AA) response profiles are aligned to a common anatomical template with t movie time points as rows and n cortical vertices as columns. (B1) To perform Response Hyperalignment (RHA), AA data are passed directly to the searchlight hyperalignment algorithm to derive transformation matrices based on local response patterns. Dimensions in the RHA common space are associated with the cortical vertices in a reference brain (Guntupalli et al. 2016). (B2) After mapping AA data into the newly derived RHA common space, the time series of each cortical vertex is correlated with the average time series of vertices aggregated into coarse connectivity targets across the brain (here, 1076 searchlights). The resulting connectome has k connectivity targets as rows and n cortical vertices as columns. (C) In our new method, Hybrid Hyperalignment, the response-hyperaligned time series from B1 and the corresponding functional connectome from B2 are combined, resulting in (t movie time points + k connectivity targets) rows and n cortical vertices as columns. This combined data matrix is then passed to the searchlight hyperalignment algorithm to derive transformations based on both local response and brain-wide connectivity profiles (For interpretation of the references to color in this figure legend, the reader is referred to the web version of this article.).
Fig. 2.
Fig. 2.
The intersubject correlation of response profiles using the Budapest data for each type of alignment algorithm. Correlations are presented for each vertex on the cortical surface averaged over data folds and participants. Subsequent figures show only left lateral hemisphere views of results. Brain image figures of results for all three datasets with lateral, medial, and ventral views are shown in Supplemental Figs. S1,S2.
Fig. 3.
Fig. 3.
The average intersubject correlation of response profiles is shown for each alignment algorithm for each data set. Bars represent the average intersubject correlation over all vertices, data folds, and participants. Circles represent the average intersubject correlation for an individual participant over all vertices and data folds.
Fig. 4.
Fig. 4.
The average intersubject correlation of connectivity profiles. (A) Correlations are presented for each vertex on the left lateral cortical surface averaged over data folds and participants. Brain image figures of results with lateral, medial, and ventral views of both hemispheres are shown in Supplemental Figs. S4–S6. (B) Correlations are shown for each alignment algorithm for each data set. Bars represent the average intersubject correlation over all vertices, data folds, and participants. Circles represent the average intersubject correlation for an individual participant over all vertices and data folds.
Fig. 5.
Fig. 5.
Average time segment classification accuracies. (A) Accuracies are presented for all searchlights on the left lateral cortical surface averaged over data folds and participants. Brain image figures of results with lateral, medial, and ventral views of both hemispheres are shown in Supplemental Figs. S8–S10. (B) Correlations are shown for each alignment algorithm for each data set. Bars represent the average classification accuracies over all searchlights, data folds, and participants. Circles represent the average classification accuracy for an individual participant over all vertices and data folds.

References

    1. Esteban O, Markiewicz CJ, Blair RW, Moodie CA, Isik AI, Erramuzpe A, Kent JD, Goncalves M, DuPre E, Snyder M, Oya H, Ghosh SS, Wright J, Durnez J, Poldrack RA, Gorgolewski KJ, 2018. FMRIPrep: a robust preprocessing pipeline for functional MRI [Preprint]. Bioinformatics doi: 10.1101/306951. - DOI - PMC - PubMed
    1. Feilong M, Nastase SA, Guntupalli JS, Haxby JV, 2018. Reliable individual differences in fine-grained cortical functional architecture. Neuroimage 183, 375–386. doi: 10.1016/j.neuroimage.2018.08.029. - DOI - PMC - PubMed
    1. Fischl B, 2012. FreeSurfer. Neuroimage 62 (2), 774–781. doi: 10.1016/j.neuroimage.2012.01.021. - DOI - PMC - PubMed
    1. Gorgolewski K, Auer T, Calhoun V, Craddock C, Das S, Duff E, Flandin G, Ghosh S, Glatard T, Halchenko Y, Handwerker D, Hanke M, Keator D, Li X, Michael Z, Maumet C, Nichols B, Nichols T, Pellman J, Poldrack R, 2016. The brain imaging data structure, a format for organizing and describing outputs of neuroimaging experiments. Sci. Data 3, 160044. doi: 10.1038/sdata.2016.44. - DOI - PMC - PubMed
    1. Guntupalli JS, Feilong M, Haxby JV, 2018. A computational model of shared fine-scale structure in the human connectome. PLOS Comput. Biol. 14 (4), e1006120. doi: 10.1371/journal.pcbi.1006120. - DOI - PMC - PubMed

Publication types