. 2021 Mar 24;7(13):eabe5396.
doi: 10.1126/sciadv.abe5396. Print 2021 Mar.

Ca2+ signals critical for egress and gametogenesis in malaria parasites depend on a multipass membrane protein that interacts with PKG

Affiliations

Ca2+ signals critical for egress and gametogenesis in malaria parasites depend on a multipass membrane protein that interacts with PKG

Aurélia C Balestra et al. Sci Adv. .

Abstract

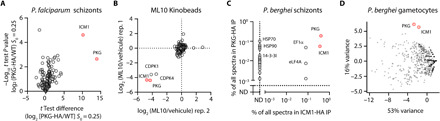
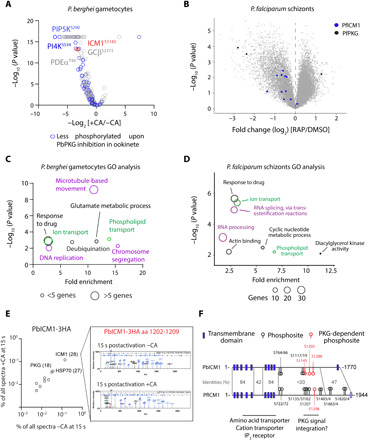
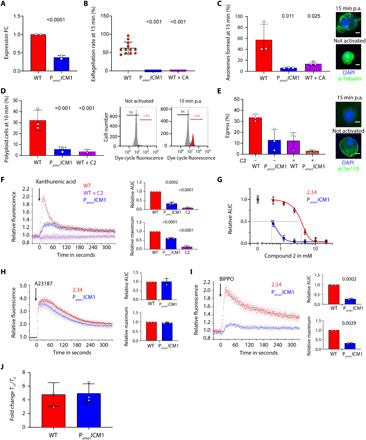
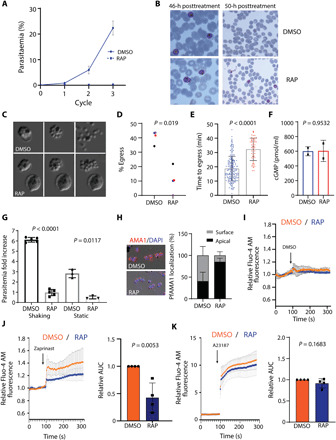
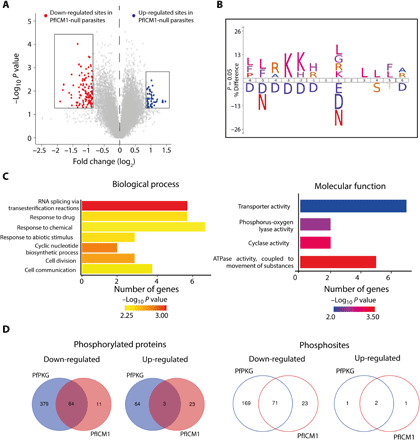
Calcium signaling regulated by the cGMP-dependent protein kinase (PKG) controls key life cycle transitions in the malaria parasite. However, how calcium is mobilized from intracellular stores in the absence of canonical calcium channels in Plasmodium is unknown. Here, we identify a multipass membrane protein, ICM1, with homology to transporters and calcium channels that is tightly associated with PKG in both asexual blood stages and transmission stages. Phosphoproteomic analyses reveal multiple ICM1 phosphorylation events dependent on PKG activity. Stage-specific depletion of Plasmodium berghei ICM1 prevents gametogenesis due to a block in intracellular calcium mobilization, while conditional loss of Plasmodium falciparum ICM1 is detrimental for the parasite resulting in severely reduced calcium mobilization, defective egress, and lack of invasion. Our findings suggest that ICM1 is a key missing link in transducing PKG-dependent signals and provide previously unknown insights into atypical calcium homeostasis in malaria parasites essential for pathology and disease transmission.


Figures

Fig. 1
Fig. 1. PKG interacts with ICM1 in P. falciparum and P. berghei schizonts and in P. berghei gametocytes.
(A) Volcano plot depicting relative abundance of proteins identified by quantitative MS in pull-downs from P. falciparum PKG-HA compared to WT (control) parasites (n = 3). Significance (Student’s t test) is expressed as log10 of the P value (y axis). X axis, enrichment of interaction partners in the P. falciparum PKG-HA pull-down compared to controls. (B) Competitive chemoproteomic studies using Kinobeads on extracts of P. falciparum schizonts. (C) Mass spectrometric quantitation of proteins immunoprecipitated from extracts of P. berghei PKG-HA3 (n = 1) and ICM1-HA3 (n = 1) schizonts. ND, not detected (D) Mass spectrometric spectral count values for proteins copurifying with PbPKG-HA3 (n = 2) and PbICM1-HA3 (n = 2) gametocytes following IP and displayed in the first and second principal components compared with previously published IPs of CRK5, CDKrs, SOC2, CDPK4, SOC1, SOC3, and MCM5.
Fig. 2
Fig. 2. ICM1 is phosphorylated in a PKG-dependent manner.
(A) Volcano plot showing the extent of differentially phosphorylated peptides in P. berghei gametocytes 15 s after XA stimulation in presence or absence of compound A (CA) (n = 3). (B) Volcano plots showing differentially phosphorylated peptides in DMSO- and RAP-treated pfpkg:cKO schizonts (n = 5). Blue dots correspond to identified PfICM1 phosphosites and black dots to PfPKG phosphosites. (C and D) GO term enrichment analysis for down-regulated phosphopeptides in 15-s activated gametocytes upon inhibition of PbPKG by compound A and of PfPKG-null schizonts. For the latter, a cutoff of Welch difference of <−1 and >1 with P <0.05 and a localization probability of >0.7 represent a significantly regulated peptide. Representative terms are shown (for a full list of GO term enrichment analysis in PfPKG-null schizonts, see data S4). (E) Relative abundance of proteins coprecipitated with PbICM1-HA3 in 15-s activated gametocytes in the presence or absence of compound A. Inset: Representative spectra indicating that phosphorylation of PbICM1-S1203 is only detected in absence of compound A. (F) Schematic of PbICM1 and PfICM1 indicating predicted TMDs and phosphosites detected in this and previous studies.
Fig. 3
Fig. 3. Stage-specific knockdown of PbICM1 partially phenocopies PKG inhibition.
(A) Relative levels of pbicm1 mRNA in WT and Pama1ICM1gametocytes. FC, fold change. (B) Knockdown of PbICM1 impairs exflagellation. (C) Pama1ICM1 male gametocytes show a strong reduction in fully assembled axonemes. Insets: Representative images. Scale bars, 2 μm. (D) Proportion of male gametocytes undergoing DNA replication determined at 1 min postactivation (p.a.) and expressed as a percentage of polyploid (>1n) cells. Insets: Gating used for the analysis. (E) Egress from RBCs was quantified by flow cytometry based on the presence of the RBC membrane marker Ter-119 in gametocytes, 15 min p.a. Insets: IFA of WT and Pama1ICM1 gametocytes activated 15 min p.a. Scale bars, 2 μm. (F) Fluorescence response kinetics of gametocytes loaded with Fluo-4 AM upon stimulation with 100 μM XA. AUC, area under each curve. (G) Relative calcium response to 100 μM XA of WT and Pama1ICM1 gametocytes upon treatment with compound 2. (H) Fluorescence response of gametocytes loaded with Fluo-4 AM upon stimulation with A23187. (I) Fluorescence response of gametocytes loaded with Fluo-4 AM upon stimulation with BIPPO. (J) cGMP levels in WT and Pama1ICM1 gametocytes upon stimulation with BIPPO. Error bars, ±SD; numbers of independent replicates are indicated for each experiment; two-tailed unpaired t test.
Fig. 4
Fig. 4. PfICM1 is essential for parasite viability, microneme discharge, efficient egress, and invasion.
(A) Replication of DMSO- and RAP-treated pficm1:cKO parasites (n = 3). (B) Giemsa-stained blood films showing normal development of DMSO- and RAP-treated pficm1:cKO schizonts 46 hours after treatment. By 50 hours, most control parasites had successfully invaded while very few rings formed in RAP-treated cultures. (C) Stills from time-lapse differential inference contrast (DIC) video microscopy of DMSO/RAP-treated pficm1:cKO schizonts. (D) Egress quantification of DMSO- and RAP-treated pficm1:cKO schizonts. (n = 4). P value derived from paired t tests. (E) Quantification of time to egress for each schizont. P value, unpaired two-tailed t test (DMSO, 209 schizonts; RAP, 55 schizonts). Error bars, ±SD. (F) cGMP levels in DMSO- and RAP-treated pficm1:cKO schizonts (n = 2). P value, paired t test. (G) Invasion assays of DMSO- and RAP-treated pficm1:cKO schizonts. P values, paired t test. (H) Left: Representative IFA images of pficm1:cKO parasites showing translocated AMA1 in DMSO-treated or micronemal AMA1 in RAP-treated merozoites. Right: Quantification of AMA1 relocalization (n = 3). At least 150 schizonts were quantified in each. Values, means ± SD. (I to K) Relative Fluo-4 AM fluorescence response of DMSO- and RAP-treated pficm1:cKO schizonts after treatment with DMSO, zaprinast, or A21387 (n = 4). For the AUC, DMSO values were normalized to 1. Values, means ± SD. P values, two tailed t test.
Fig. 5
Fig. 5. Impact of PfICM1 disruption on the schizont phosphoproteome.
(A) Volcano plot showing distribution of phosphopeptide abundance in the presence or absence of PfICM1. Red circles correspond to significantly down-regulated peptides and blue circles to significantly up-regulated peptides. A cutoff of Welch difference of <−0.875 and >0.875 with P <0.05 and a localization probability of >0.7 represent significantly regulated peptides. (B) Motif analysis of the significantly down-regulated phosphosites in PfICM1-null parasites. All detected phosphopeptides were used as the reference dataset, with amino acids below the position line indicating residues unfavored for this position. Position 0 corresponds to the phosphorylated residue. (C) GO enrichment analysis of biological process and molecular function for proteins significantly hypophosphorylated in PfICM1-null parasites. Enriched terms with P < 0.01 are shown. (D) Venn diagram showing the number of phosphoproteins and the corresponding phosphopeptides significantly deregulated by PfPKG and PfICM1.

References

    1. WHO, World malaria report (2019).
    1. Baker D. A., Drought L. G., Flueck C., Nofal S. D., Patel A., Penzo M., Walker E. M., Cyclic nucleotide signalling in malaria parasites. Open Biol. 7, 170213 (2017). - PMC - PubMed
    1. Brochet M., Billker O., Calcium signalling in malaria parasites. Mol. Microbiol. 100, 397–408 (2016). - PubMed
    1. Taylor H. M., McRobert L., Grainger M., Sicard A., Dluzewski A. R., Hopp C. S., Holder A. A., Baker D. A., The malaria parasite cyclic GMP-dependent protein kinase plays a central role in blood-stage schizogony. Eukaryot. Cell 9, 37–45 (2010). - PMC - PubMed
    1. Koussis K., Withers-Martinez C., Baker D. A., Blackman M. J., Simultaneous multiple allelic replacement in the malaria parasite enables dissection of PKG function. Life Sci. Alliance 3, e201900626 (2020). - PMC - PubMed

Publication types