. 2021 Mar 24;13(586):eabe0357.
doi: 10.1126/scitranslmed.abe0357.

SVEP1 is a human coronary artery disease locus that promotes atherosclerosis

Affiliations

SVEP1 is a human coronary artery disease locus that promotes atherosclerosis

In-Hyuk Jung et al. Sci Transl Med. .

Abstract

A low-frequency variant of sushi, von Willebrand factor type A, EGF, and pentraxin domain-containing protein 1 (SVEP1), an extracellular matrix protein, is associated with risk of coronary disease in humans independent of plasma lipids. Despite a robust statistical association, if and how SVEP1 might contribute to atherosclerosis remained unclear. Here, using Mendelian randomization and complementary mouse models, we provide evidence that SVEP1 promotes atherosclerosis in humans and mice and is expressed by vascular smooth muscle cells (VSMCs) within the atherosclerotic plaque. VSMCs also interact with SVEP1, causing proliferation and dysregulation of key differentiation pathways, including integrin and Notch signaling. Fibroblast growth factor receptor transcription increases in VSMCs interacting with SVEP1 and is further increased by the coronary disease-associated SVEP1 variant p.D2702G. These effects ultimately drive inflammation and promote atherosclerosis. Together, our results suggest that VSMC-derived SVEP1 is a proatherogenic factor and support the concept that pharmacological inhibition of SVEP1 should protect against atherosclerosis in humans.


Conflict of interest statement

Competing interests: IHJ, JSE, AA, and NOS are inventors on U.S. Patent Application 62/962,736 submitted by Washington University that covers compositions and methods of treatment targeted to SVEP1-mediated disorders. NOS has received investigator-initiated research funds from Regeneron Pharmaceuticals unrelated to the content of this study. The other authors have no conflicts.

Figures

Fig. 1.
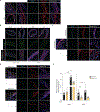
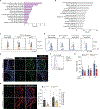
Fig. 1.. SVEP1 is expressed by VSMCs under pathological conditions.
(A) Expression of SVEP1 in human aortic wall and LIMA cross-sections from patients using in situ hybridization (ISH). (B) β-gal expression in the aortic root, BCA (brachiocephalic artery), LC (lesser curvature) from 8-week-old Svep1+/−Apoe−/− and Apoe−/− mice. (C) Expression of Svep1 using ISH in the aortic root from young (8-week-old) CD-fed and 8 weeks of HFD-fed Apoe−/− mice. (D) Expression of Svep1 using ISH in the aortic root from Svep1SMC+/+ and Svep1SMC∆/∆ mice after 8 weeks of HFD feeding. Outlined areas indicate the regions magnified in the next panels. Tissues in (A-D) were co-stained with the VSMC marker, SMα-actin. Scale bars, 50 µm. M, media; L, lumen; P, plaque. (E) Cd36 and Svep1 expression in primary VSMCs from Svep1SMC+/+ and Svep1SMC∆/∆ mice with or without the addition of oxLDL for 48 hr (n = 6–12/group, N = 2). Data were analyzed with an unpaired nonparametric Mann-Whitney test. The bar graphs depict the mean ± SEM. ***P < 0.001; ****P < 0.0001.
Fig. 2.
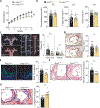
Fig. 2.. Svep1 haploinsufficiency abrogates atherosclerosis.
(A) Body weight of Apoe−/− and Svep1+/−Apoe−/− mice during HFD feeding. (B) Plasma total cholesterol, triglycerides, and glucose of mice after HFD feeding. (C) En face Oil Red O-stained murine aortas. Outlined areas indicate the aortic arch regions magnified in left panels. Quantification of Oil Red O-stained area in each aortic arch and whole artery. (D) Oil Red O-stained murine aortic root cross-sections. Quantification of Oil Red O-stained area. Scale bar, 500 µm. (E) Mac3 staining in murine aortic root sections. Quantification of Mac3 as a percentage of plaque area. Scale bar, 200 µm. M, media; L, lumen; P, plaque. n = 7–17/group (A-E). Data were analyzed with a one-way ANOVA (A) or unpaired nonparametric Mann-Whitney test (B-E). The bar graphs depict the mean ± SEM. *P < 0.05; **P < 0.01; NS, not significant.
Fig. 3.
Fig. 3.. VSMC-specific Svep1 deficiency reduces atherosclerosis and plaque complexity.
(A) Body weight of Svep1SMC+/+ and Svep1SMC∆/∆ mice during HFD feeding. (B) Total plasma cholesterol, triglycerides, and glucose in mice. (C) En face Oil Red O-stained murine aortas. Outlined areas indicate the aortic arch regions magnified in left panels. Quantification of Oil Red O-stained area in each aortic arch and whole artery. (D) Oil Red O-stained murine aortic root cross-sections. Quantification of Oil Red O-stained area. Scale bar, 500 µm. (E) Mac3 staining of murine aortic roots. Quantification of Mac3 as a percentage of plaque area. (F) Necrotic core of murine aortic roots outlined on H&E-stained sections. Quantification of necrotic core as a percentage of plaque area. (G) Collagen staining of murine aortic roots using Masson’s trichrome stain. Quantification of collagen as a percentage of plaque area. Scale bars, 200 µm. M, media; L, lumen; P, plaque. n = 13–15/group (A- D) or 8–9/group (E-G). Data were analyzed with a one-way ANOVA (A) or unpaired nonparametric Mann-Whitney test (B-G). The bar graphs depict the mean ± SEM. *P < 0.05; **P < 0.01; ***P < 0.001; NS, not significant.
Fig. 4.
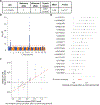
Fig. 4.. Plasma SVEP1 is causally related to CAD in humans.
(A) The effect of the CAD-associated SVEP1 p.D2702G allele on plasma SVEP1 expression in humans. Effect refers to the change per alternative allele (2702G) in units of normalized protein concentration after adjusting for covariates as previously described (26). (B) Genome-wide Manhattan plot for variants associated with plasma SVEP1 in humans. The –log10(P) of the association with SVEP1 concentration is plotted for each variant across the genome according to chromosomal position (X-axis). The red line indicates genome-wide significance (P < 5 × 10⁻⁸). The association peak on chromosome 9 overlies the SVEP1 locus. (C) Estimated effect (with 95% confidence intervals) of each variant included in the Mendelian randomization analysis on plasma SVEP1 expression and CAD risk. The red line indicates the causal effect estimate (P = 7 × 10⁻¹¹). (D) The estimated causal effect (with 95% confidence intervals) of each SNP included in the Mendelian randomization analysis for a one unit increase in SVEP1 concentration is plotted along with the overall summary estimate from the causal analysis.
Fig. 5.
Fig. 5.. SVEP1 induces Itgα9-dependent proliferation in VSMCs.
(A) ITGA9 expression in human aortic wall and LIMA cross-sections from patients using ISH. M, media; L, lumen. (B) Expression of Itgα9 in the aortic root from 8-week-old Svep1SMC+/+ and Svep1SMC∆/∆ mice using ISH. Outlined areas indicate the regions magnified in the next panels. Scale bar, 50 µm. (C) MCM-2 immunofluorescent staining of aortic root regions from Svep1SMC+/+ and Svep1SMC∆/∆ mice after 8 weeks of HFD feeding. Yellow arrows indicate MCM-2+/SMα-actin+ cells within plaque. Quantification of MCM-2+/SMα-actin+ cells (n = 13–15/group). Scale bars = 50 µm. Tissues in (A-C) were co-stained with the VSMC marker, SMα-actin. (D) Adhesion of murine VSMCs to increasing concentrations of immobilized SVEP1. Adhered cells were counted manually and normalized to wells lacking SVEP1. (E) Proliferation of murine VSMCs in response to increasing concentrations of immobilized SVEP1 and SVEP1CADrv using a BrdU incorporation assay. (F) Svep1SMC∆/∆ murine VSMCs were incubated in wells precoated with 30 µg ml−1 SVEP1 protein or BSA (as vehicle control) and treated with or without 50 µg ml−1 oxLDL in the culture media for 36 hr. Proliferation was determined by BrdU incorporation. (G) Immunoblots of integrin signaling kinases and downstream kinases of murine VSMCs adhered to control, VCAM-1, or SVEP1-treated plates. β-actin was used as loading control. (H) Murine VSMCs were transfected with control or Itga9-targetted siRNAs and grown on immobilized SVEP1 or BSA. Proliferation was determined by BrdU incorporation. n = 4–12/group; N = 2–3 for D-H. Data were analyzed using an unpaired nonparametric Mann-Whitney test (C) or a two-tailed t-test (F and H). The bar graphs depict the mean ± SEM. *P < 0.05; **P < 0.01; ***P < 0.001.
Fig. 6.
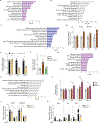
Fig. 6.. SVEP1 modulates key VSMC-developmental pathways.
(A-C) Common transcriptional response of murine VSMCs to SVEP1 and SVEP1CADrv proteins. Dysregulated (A) Kyoto Encyclopedia of Genes and Genomes (KEGG) pathways, (B) Gene Ontoloty (GO) term molecular functions, and (C) InterPro domains. Top 5 dysregulated categories plus additional, select categories are included. Full results are available in table S1. Bars represent -log10 of P values (n = 4/group). (D) Transcription of canonical Notch target genes in murine VSMCs after 4 hours of adhesion to SVEP1, relative to BSA. (E) Basal transcription of Notch target genes in Svep1SMC+/+ and Svep1SMC∆/∆ murine VSMCs. (F) Proliferation of murine VSMCs in response to immobilized SVEP1. Cells were treated with DMSO (carrier) or 25 µM DAPT. Proliferation was determined by BrdU incorporation. n = 3–6/group; N = 2–3 for D-F. (G-H) Differential transcriptional response of murine VSMCs to SVEP1 and SVEP1CADrv proteins. Dysregulated (G) KEGG pathways, and (H) GO term molecular functions. Top 5 dysregulated categories plus additional, select categories are included. Full results are available in table S1. Bars represent -log10 of P values. (I) Bar graph of Fgfr transcript counts from murine VSMC RNAseq. Each transcript is normalized to the BSA control group. n = 4/group for G-I. (J, K) qPCR of (J) VSMC markers, and (K) inflammatory markers of murine VSMC cultured with or without 50 µg ml−1 oxLDL for 24 hr (n = 4–6/group; N = 2). Data were analyzed using a two-tailed t-test (D-F and I-K). The bar graphs depict the mean ± SEM. *P < 0.05; **P < 0.01; ***P < 0.001.
Fig. 7.
Fig. 7.. SVEP1 promotes inflammation in atherosclerosis.
(A-B) Differential transcriptional profile of atherosclerotic aortic arches from Svep1SMC+/+ and Svep1SMC∆/∆ mice. Dysregulated (A) KEGG pathways, and (B) GO term molecular functions. Top 5 dysregulated categories plus additional, select categories are included. Full results are available in table S2. Bars represent -log10 of P values (n = 3–4/group). (C) Histogram for Itgα9β1 expression in mouse blood neutrophils (CD11b+Ly6G+), Ly6Clow (CD11b+Ly6Clow), and Ly6Chigh (CD11b+Ly6Chigh) monocytes from Svep1SMC+/+ and Svep1SMC∆/∆ mice after 8 weeks of HFD. (D) Histogram of Itgα9β1 expression in the subpopulations of aortic leukocytes. Macrophages (CD64+CD11b+), DCs (CD11c+MHCIIhigh), neutrophils (CD11b+Ly6G+), and Ly6Chigh (CD11b+Ly6Chigh) monocytes from Apoe−/− and Svep1+/−Apoe−/− mice after 8 weeks of HFD (n = 3–4/group; N = 3). (E) Expression of Itga9 in the aortic roots from Svep1SMC+/+ and Svep1SMC∆/∆ mice using ISH after 8 weeks of HFD. Tissues were co-stained for Mac3 and SMα-actin. Scale bars, 50 µm. (F) Expression of Integrin alpha-9 in BMDM from Itgα9MAC+/+ and Itgα9MAC∆/∆ mice (n = 3/group; N = 3). (G) Migratory response of thioglycolate-elicited murine macrophages from Itgα9MAC+/+ and Itgα9MAC∆/∆ were determined using a chemotaxis chamber incubated with 0, 50, and 200 ng ml−1 of SVEP1 protein. Migrated cells were counted by an automated microscope and expressed as cells per field of view (n = 4/group; N = 2). (H) In vivo monocyte recruitment assay. YG-bead uptake within plaque lesion in the aortic root regions from Svep1SMC+/+ and Svep1SMC∆/∆ mice. Quantification of YG-bead uptake showing the total number of YG-beads per section (left Y axis), and the number of YG-beads normalized to the percentage of labeled Ly6Clow monocytes (right Y axis) (n = 6–7/group). Scale bar, 50 µm. Data were analyzed using two-tailed t-test (G) or unpaired nonparametric Mann-Whitney test (H). The bar graphs depict the mean ± SEM. *P ≤ 0.05; **P < 0.01.

Similar articles

Cited by

References

    1. Weber C, Noels H, Atherosclerosis: current pathogenesis and therapeutic options. Nat Med 17, 1410–1422 (2011). - PubMed
    1. Dzau VJ, Braun-Dullaeus RC, Sedding DG, Vascular proliferation and atherosclerosis: new perspectives and therapeutic strategies. Nat Med 8, 1249–1256 (2002). - PubMed
    1. Liu X, Ntambi JM, Atherosclerosis: keep your macrophages in shape. Nat Med 15, 1357–1358 (2009). - PubMed
    1. Hansson GK, Klareskog L, Pulling down the plug on atherosclerosis: cooling down the inflammasome. Nat Med 17, 790–791 (2011). - PubMed
    1. Ross R, Genetically modified mice as models of transplant atherosclerosis. Nat Med 2, 527–528 (1996). - PubMed

Publication types

Substances