. 2021 Mar 24;11(1):6756.
doi: 10.1038/s41598-021-86148-8.

Comparative in silico genome analysis of Clostridium perfringens unravels stable phylogroups with different genome characteristics and pathogenic potential

Affiliations

Comparative in silico genome analysis of Clostridium perfringens unravels stable phylogroups with different genome characteristics and pathogenic potential

Mostafa Y Abdel-Glil et al. Sci Rep. .

Abstract

Clostridium perfringens causes a plethora of devastating infections, with toxin production being the underlying mechanism of pathogenicity in various hosts. Genomic analyses of 206 public-available C. perfringens strains´ sequence data identified a substantial degree of genomic variability in respect to episome content, chromosome size and mobile elements. However, the position and order of the local collinear blocks on the chromosome showed a considerable degree of preservation. The strains were divided into five stable phylogroups (I-V). Phylogroup I contained human food poisoning strains with chromosomal enterotoxin (cpe) and a Darmbrand strain characterized by a high frequency of mobile elements, a relatively small genome size and a marked loss of chromosomal genes, including loss of genes encoding virulence traits. These features might correspond to the adaptation of these strains to a particular habitat, causing human foodborne illnesses. This contrasts strains that belong to phylogroup II where the genome size points to the acquisition of genetic material. Most strains of phylogroup II have been isolated from enteric lesions in horses and dogs. Phylogroups III, IV and V are heterogeneous groups containing a variety of different strains, with phylogroup III being the most abundant (65.5%). In conclusion, C. perfringens displays five stable phylogroups reflecting different disease involvements, prompting further studies on the evolution of this highly important pathogen.


Conflict of interest statement

The authors declare no competing interests.

Figures

Figure 1
Figure 1
Whole-genome alignment of Clostridium perfringens strains. (A) A representative detail of the multiple genome alignment depicting genomic conservation within the strains in respect to the physical location of Locally Collinear Blocks (LCBs) and relative order of the genes. Please see Figure S1 for a detailed alignment of the 34 genomes. (B) Alignment of the C. perfringens genomes showing inversions and shifts (NCTC 11144, NCTC 8081 and NCTC 8359) relative to the reference strain (ATCC 13124). In strain NCTC 11144, a large inversion bordered by rRNA operons was observed while the inversions and shifts in the strains NCTC 8081 and NCTC 8359 were bordered by the IS element ISCpe7. Position 1 in all strains corresponds to the origin of replication as determined in strain 13. The alignment was generated using progressiveMauve and edited in Adobe Photoshop CS5 (www.adobe.com/photoshop).
Figure 2
Figure 2
Mobile genetic elements in the closed chromosome of 34 Clostridium perfringens genomes. The predicted number of insertion sequences, genomic islands and prophages is plotted against the chromosome size. Human food poisoning strains carrying the enterotoxin gene on a chromosome (chromosomal cpe strains) are displayed in blue. Black colour (marked with an arrow) represents the Darmbrand (human enteritis necroticans) strain. Other strains are coloured red. The plots were generated in R .
Figure 3
Figure 3
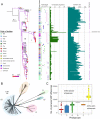
Phylogenetic relationships of 206 Clostridium perfringens genomes. (A) A maximum-likelihood (ML) phylogeny computed from the core genome SNPs using RAxML. Branch colouration denotes bootstrap values as described in the legend. Red colour coding at the tips of the tree indicate strains represented by closed genomes. The five major phylogroups are highlighted on the ML tree with boxes numbered I to V according to phylogroups described in the text. Strains’ origins and toxin types are plotted next to the ML tree. Bar plots represent the percentages of insertion sequences and the total size of the strains’ genomes, respectively. Genome size reported for closed genomes includes the chromosome and extrachromosomal elements. The presence (violet colour) or absence (white colour) of conjugation locus (tcp) in each strain is shown. The phylogenetic position of the historic Darmbrand strain is highlighted with a horizontal dotted line. The phylogenetic tree was visualized using iTOL (B) SplitsTree phylogenetic network based on 63,036 unique SNP sites in the core genome of 206 C. perfringens strains with phylogroups highlighted. (C) The numbers of pairwise SNP distances between strains within each of the five phylogroups and between phylogroups are depicted. The plot was generated in R and edited in Adobe Photoshop CS5 (www.adobe.com/photoshop).
Figure 4
Figure 4
Accessory genome clustering and pangenome accumulation in 206 Clostridium perfringens strains. (A) Heat maps from similarity matrices calculated based on the distribution pattern of accessory genes (left) and the average nucleotide identity of the whole genome (right) in the 206 strains with phylogroups highlighted. Heat maps were generated using ComplexHeatmap in R and edited in Adobe Photoshop CS5 (www.adobe.com/photoshop). (B) Accumulation curves for the pangenome produced using vegan in R for the species (n = 206 strains, 14,942 genes) and the phylogroups I (n = 31 strains, 4,665 genes), II (n = 32 strains, 5,608 genes) and III (n = 135 strains, 12,713 genes). (C) Multidimensional scaling plot of the pangenome showing clustering of strains based on the pattern of presence and absence of accessory genes, with phylogroups highlighted and colour coded as calculated using the R function cmdscale () (goodness of fit = 0.3321971, X-axis eigenvalue = 0.2004366, and Y-axis eigenvalue = 0.1317606).
Figure 5
Figure 5
Association between core-genome SNPs and accessory gene content of 206 Clostridium perfringens genomes. (A) A maximum-likelihood phylogenetic tree based on core genome SNPs as presented in Fig. 3A with phylogroups being highlighted, shown as a coloured band next to the ML phylogeny. The phylogenetic tree was visualized using iTOL (B) A heat map showing the distribution of the 4,099 accessory genes (genes shared by 2—95% of the genomes). Rows represent the accessory genes present in each genome while columns represent accessory gene families. Black and light grey colourations specify accessory gene presence and absence, respectively. Accessory genes were clustered as indicated by the dendrogram (top) using clustering functions from the ComplexHeatmap R package. Genes specifically present or absent in different groups are highlighted (bottom). Heat maps were generated in R using the package ComplexHeatmap ,. The figure was edited in Adobe Photoshop CS5 (www.adobe.com/photoshop).
Figure 6
Figure 6
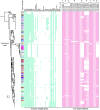
Distribution of virulence-related genes and putative iron uptake systems in the 206 Clostridium perfringens genomes. The presence and absence of genes are presented next to the maximum likelihood phylogeny with the origin of isolates being depicted, similar to Fig. 3A. Coloured cells denote the gene presence and white denotes gene absence. The dotted horizontal line refers to the virulence profile of the Darmbrand strain. The locus tag NCTC8081_02938 describes the toxin gene homolog found in the Darmbrand strain. The iron uptake systems are numbered as follow: feoAB operon for ferrous iron-acquisition systems (numbered 1 to 3), two putative heme acquisition systems (4 and 5), one putative ferric citrate iron acquisition system (6) and three putative siderophore iron acquisition systems (7 to 9). The column headers for the iron uptake systems are locus tags of genes from strain 13 [1 and 4 to 9] and ATCC 13124 [2 and 3]. The figure was produced using iTOL .

References

    1. Kiu R, Hall LJ. An update on the human and animal enteric pathogen Clostridium perfringens. Emerg. Microbes Infect. 2018;7:141. doi: 10.1038/s41426-018-0144-8. - DOI - PMC - PubMed
    1. Rood JI, et al. Expansion of the Clostridium perfringens toxin-based typing scheme. Anaerobe. 2018;53:5–10. doi: 10.1016/j.anaerobe.2018.04.011. - DOI - PMC - PubMed
    1. Li J, et al. Toxin plasmids of Clostridium perfringens. Microbiol. Mol. Biol. Rev. 2013;77:208–233. doi: 10.1128/mmbr.00062-12. - DOI - PMC - PubMed
    1. Shrestha A, Uzal FA, McClane BA. Enterotoxic Clostridia: Clostridium perfringens enteric diseases. Microbiol. Spect. 2018 doi: 10.1128/microbiolspec.GPP3-0003-2017. - DOI - PMC - PubMed
    1. Lindström M, Heikinheimo A, Lahti P, Korkeala H. Novel insights into the epidemiology of Clostridium perfringens type A food poisoning. Food Microbiol. 2011;28:192–198. doi: 10.1016/j.fm.2010.03.020. - DOI - PubMed

Publication types

Substances

LinkOut - more resources