. 2021 May;18(5):1197-1210.
doi: 10.1038/s41423-021-00667-y. Epub 2021 Mar 24.

Hyaluronan is a natural and effective immunological adjuvant for protein-based vaccines

Affiliations

Hyaluronan is a natural and effective immunological adjuvant for protein-based vaccines

Anna Dalla Pietà et al. Cell Mol Immunol. 2021 May.

Abstract

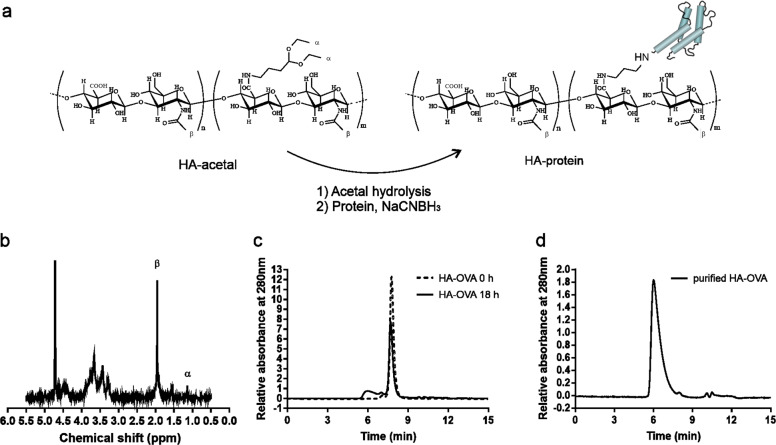
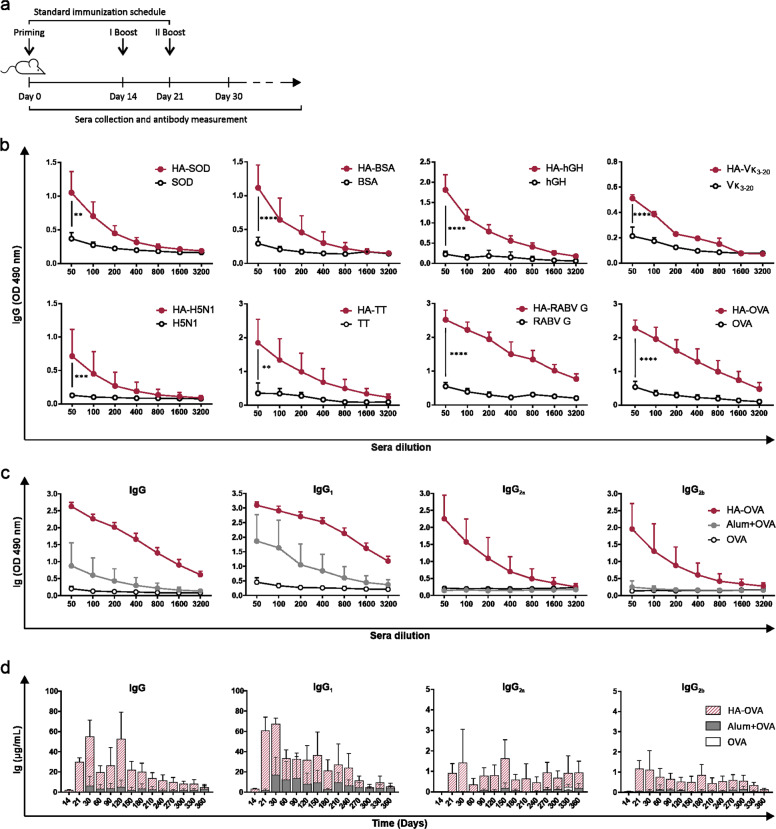
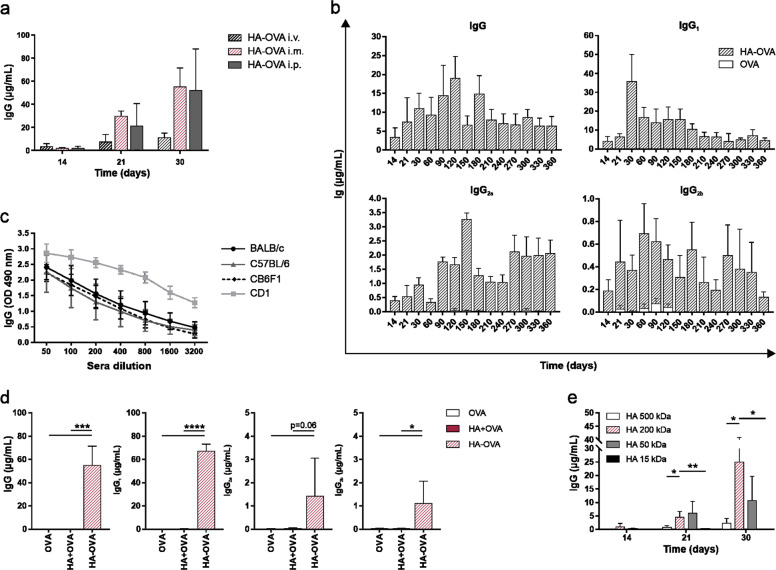
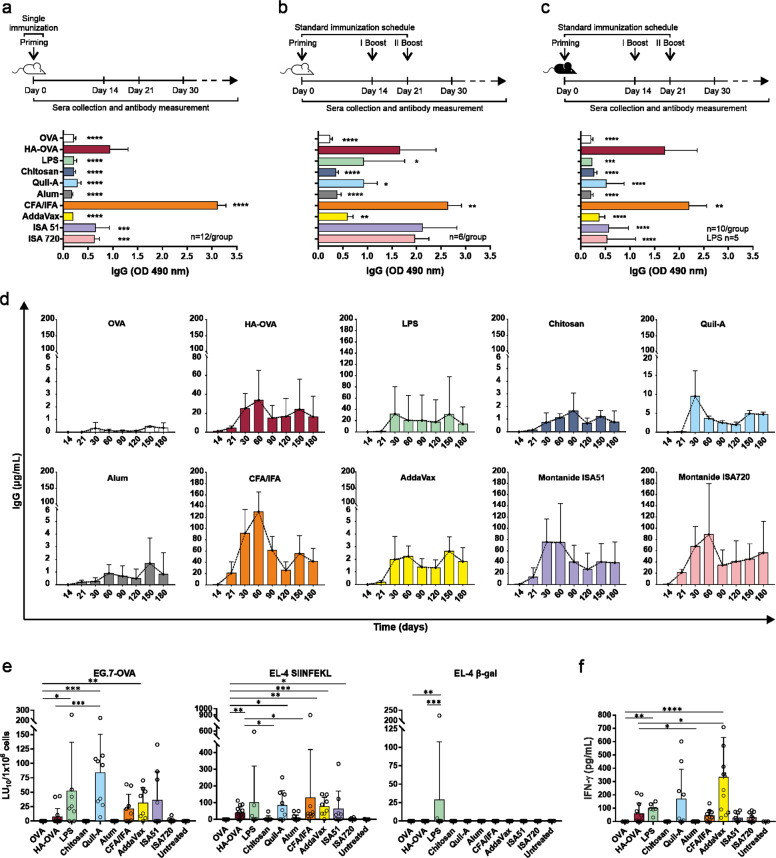
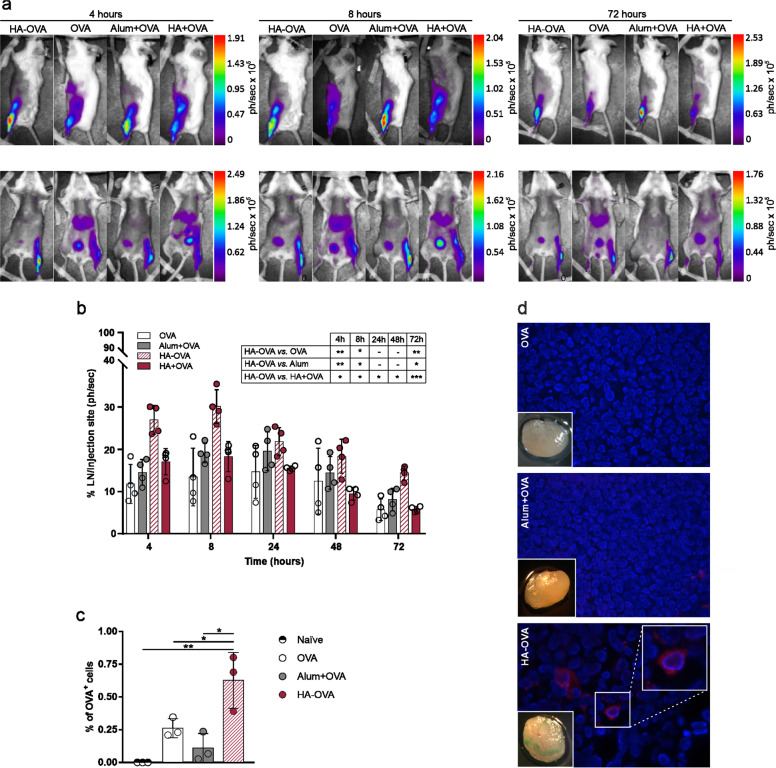
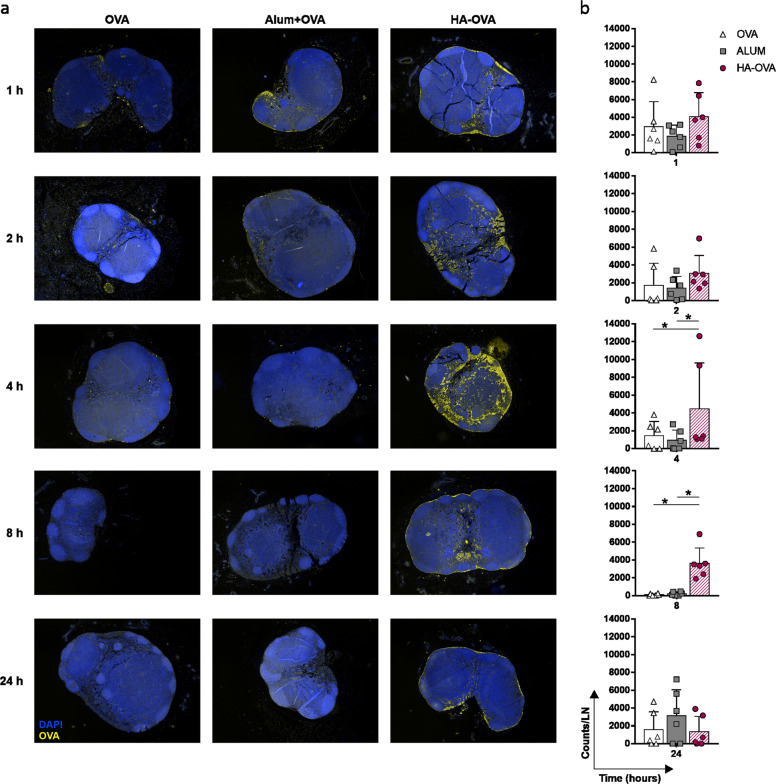
One of the main goals of vaccine research is the development of adjuvants that can enhance immune responses and are both safe and biocompatible. We explored the application of the natural polymer hyaluronan (HA) as a promising immunological adjuvant for protein-based vaccines. Chemical conjugation of HA to antigens strongly increased their immunogenicity, reduced booster requirements, and allowed antigen dose sparing. HA-based bioconjugates stimulated robust and long-lasting humoral responses without the addition of other immunostimulatory compounds and proved highly efficient when compared to other adjuvants. Due to its intrinsic biocompatibility, HA allowed the exploitation of different injection routes and did not induce inflammation at the inoculation site. This polymer promoted rapid translocation of the antigen to draining lymph nodes, thus facilitating encounters with antigen-presenting cells. Overall, HA can be regarded as an effective and biocompatible adjuvant to be exploited for the design of a wide variety of vaccines.

Keywords: HA-bioconjugate vaccines; Hyaluronan; immunological adjuvant; natural polymer.


Conflict of interest statement

A.D.P., D.C., I.M.M., and A.R. are inventors on Patent Application No. PCT/IB2019/059122 submitted on October 24, 2019 related to “Hyaluronic acid as a natural adjuvant for protein and peptide-based vaccines.” All other authors declare that they have no competing interests.

Figures

Fig. 1
Fig. 1
Synthesis and purification of HA-OVA. a Reaction scheme of deprotection of HA-acetal to HA-aldehyde (Step 1) and subsequent conjugation to a protein by reductive amination (Step 2); b 1H-NMR of HA200kDa-acetal in D2O. The modification degree of the polymer was calculated by comparing the integration value of the acetal moiety (α: 1.10 ppm) with that of the acetyl group of the HA backbone (β: 1.85 ppm); for correspondence of α and β, see the HA-acetal chemical formula in (a); c SEC-HPLC chromatograms of the HA-OVA conjugation reaction time course at 0 h and after 18 h. d HA-OVA after purification from the unreacted protein. The chromatographic profiles were obtained by SEC-HPLC on an analytical Zorbax GF-250 column (250 × 4.6 mm), eluted with 20 mΜ Na2HPO4 and 130 mM NaCl (pH 7.2) containing 20% (v/v) acetonitrile (ACN) at a flow rate of 0.3 mL/min. The eluate was monitored by measuring the absorbance at 280 nm
Fig. 2
Fig. 2
HA-based vaccines stimulate antigen-specific antibody responses in BALB/c mice. a Schematic representation of the standard immunization schedule (priming + two boosters). b Antigen-specific total IgG titer in sera collected on day 30 from BALB/c mice subjected to i.m. immunization with different antigens conjugated to 200 kDa HA or injected alone (standard immunization schedule; BSA, Vк3-20, OVA, n = 12; SOD, hGH, TT, RABV G, n = 6; H5N1, n = 4). c Anti-OVA total IgG and IgG subclass titers detected on day 30 in sera of BALB/c mice subjected to i.m. immunization with 10 μg of OVA alone, conjugated to HA, or emulsified with alum following the standard schedule (n = 10 mice/group; HA vs. alum: P < 0.001). The data in both (b, c) are expressed as the optical densities (ODs) at 490 nm for different serum dilutions. d Kinetics of antigen-specific total IgG and IgG subclass concentrations in sera of immunized mice over a period of 1 year (n = 6 mice/group; HA vs. Alum: P < 0.01). The data were analyzed using multiple t-tests (*P < 0.05, **P < 0.01, ***P < 0.001, ****P < 0.0001)
Fig. 3
Fig. 3
The adjuvanticity of HA in different experimental settings. a Anti-OVA total IgG serum concentration at different time points in BALB/c mice immunized via different injection routes (i.v., i.m. or i.p.) with 10 µg of OVA conjugated to HA (standard schedule; n = 6 mice/group). b Kinetics of the serum IgG concentration in mice subjected to i.v. immunization over a period of 1 year (standard schedule; n = 6 mice/group). c OVA-specific total IgG concentration in sera collected on day 30 from different mouse strains (BALB/c, C57BL/6, CD1, and CB6F1) subjected to i.m. immunization with 10 μg OVA alone or conjugated to HA (standard schedule; BALB/c and C57BL/6, n = 42; CD6F1, n = 4; CD1, n = 10). d Anti-OVA total IgG and IgG subclass concentrations in sera collected on day 30 from BALB/c mice subjected to i.m. immunization with 10 µg of OVA alone, chemically conjugated to HA (HA-OVA), or simply mixed with HA (HA + OVA) (standard schedule; n = 6 mice/group). e Total IgG concentration at different time points in the sera of BALB/c mice immunized with 10 μg of OVA conjugated to HA moieties with different MWs (500, 200, 50, or 15 kDa; standard schedule; n = 4 mice/group). The data were analyzed using multiple t-tests (*P < 0.05, **P < 0.01, ***P < 0.001, ****P < 0.0001; P > 0.05 if not indicated)
Fig. 4
Fig. 4
HA-based vaccination is also efficient without booster immunizations and allows antigen dose sparing. a One-year kinetics of the OVA-specific total IgG concentration in BALB/c mice subjected to i.m. immunization with a single injection of 10 μg of OVA alone, conjugated to HA, or emulsified with alum (n = 6 mice/group; 1:50 dilution). b Anti-OVA IgG subclass concentrations on day 30 after a single injection of 10 μg of OVA administered as described above (n = 6 mice/group). c Antigen-specific total IgG concentration on day 30 after immunization with either 0.1, 1, or 10 μg of OVA alone, conjugated with HA or emulsified with alum (standard schedule; n = 6 mice/group; 1:50 dilution). The figure legend refers to all graphs
Fig. 5
Fig. 5
HA performs well compared to other adjuvants. Anti-OVA total IgG concentration in sera (1:100 dilution) collected on day 30 from BALB/c (a, b) and C57BL/6 (c) mice subjected to i.m. immunization with 10 μg OVA alone, conjugated to HA, or mixed with different adjuvants. Immunization schedules are shown above each graph and consisted of a single injection (a) or a standard schedule (b, c). The sample size is shown in each graph. d Quantification of the antigen-specific total IgG concentration at different time points after the first injection in BALB/c mice immunized as in (b) (n = 12 mice/group). e Splenocytes collected on day 30 from C57BL/6 mice vaccinated with 10 μg of OVA administered with different adjuvants (standard schedule) were restimulated in vitro with EG.7-OVA cells (MLTCs) and evaluated 5 days later for lytic activity against target cells. Cytotoxicity against different targets is expressed as LU10/106 effector cells. f IFN-γ in supernatants of MLTCs set up as described above and tested after 72 h of activation. In (e, f), each symbol represents an individual mouse, and the bars indicate the means ± SDs. The data were analyzed using one-way ANOVA; comparisons between the OVA or HA-OVA group and other groups are shown (*P < 0.05, **P < 0.01, ***P < 0.001, ****P < 0.0001; P > 0.05 if not indicated)
Fig. 6
Fig. 6
HA conjugation favors antigen accumulation in draining lymph nodes. a Representative images of the in vivo biodistribution of dye-labeled OVA administered alone or adjuvanted via i.m. injection into BALB/c mice at 4, 8, and 72 h postinoculation. Representative lateral (top panels) or frontal (bottom panels) scans of one animal/group at different time points are shown. b Percentage ratio of LNs to muscle photons detected at different time points after i.m. injection. Statistics are shown in the embedded table (multiple t-test, *P < 0.05, **P < 0.01, ***P < 0.001, ****P < 0.0001; P > 0.05 if not indicated). c Percentage of dye-labeled OVA+ cells in LNs harvested 4 h postinjection (n = 3 mice/group). Multiple t-tests were performed; statistics for only the HA-OVA group vs. other groups are reported (*P < 0.05, **P < 0.01, ***P < 0.001, ****P < 0.0001; P > 0.05 if not indicated). d Representative fluorescence micrographs of LN specimens collected 4 h after injection with dye-labeled OVA injected alone, adjuvanted with alum, or conjugated to HA. Samples were stained with DAPI (blue), and OVA-Cy5.5 fluorescence (red) was detected at ×10 magnification. The white square in the upper right corner of the image shows a magnified view of Cy5.5-specific signals detected in the selected area (oil immersion objective, ×60 magnification). Images of inguinal LNs at ×6.4 magnification are shown in the lower left corner (Leica Wild M3B Stereo Microscope)
Fig. 7
Fig. 7
Time course analysis of OVA distribution in LNs from immunized mice. a Representative images of lymph nodes collected at different time points after i.m. injection of 10 µg of OVA alone, mixed with alum or conjugated to HA; sections were stained with the mIHC panel described in the “Materials and methods” section, and images were acquired at ×4 magnification with a Mantra Quantitative Pathology Workstation. Only OVA+ cells (yellow) and nuclei (DAPI, blue) are visualized. b Time course quantification of the intensity of OVA-associated fluorescence signals expressed as counts per lymph node (counts/LN). Cumulative data from three independent experiments are presented (n = 3 mice; 6 LNs/group). Multiple t-tests were performed (*P < 0.05, **P < 0.01, ***P < 0.001, ****P < 0.0001; P > 0.05 if not indicated)
Fig. 8
Fig. 8
Fluorescence multiplex immunohistochemistry (mIHC) of draining LNs harvested at different time points after i.m. immunization. a Representative seven-color multispectral image of a lymph node collected 4 h after i.m. injection of HA-OVA, scanned at ×20 (upper panel) and ×40 (lower panel) magnification. The white arrows in the ×40 image show examples of an OVA+ DC (1, CD11c), OVA+ lymphatic endothelial cell (2, LYVE-1), and OVA+ macrophage (3, F4/80). b Quantification of OVA+ cell density (cells/mm2) in LNs of mice subjected to i.m. injection with 10 µg of OVA alone, mixed with alum, or conjugated to HA. c Percentage of OVA+ cells among LYVE-1+, CD11c+, and F4/80+ cells. Cumulative data from three independent experiments are presented (n = 3 mice; 6 LNs/group). Multiple t-tests were performed (*P < 0.05, **P < 0.01, ***P < 0.001, ****P < 0.0001; P > 0.05 if not indicated)

References

    1. Fallacara A, Baldini E, Manfredini S, Vertuani S. Hyaluronic acid in the third millennium. Polymers. 2018;10:701. - PMC - PubMed
    1. Kim H, et al. Hyaluronate and its derivatives for customized biomedical applications. Biomaterials. 2017;123:155–171. - PubMed
    1. Montagner IM, et al. A site-selective hyaluronan-interferonα2a conjugate for the treatment of ovarian cancer. J. Control. Release. 2016;236:79–89. - PubMed
    1. Montagner IM, et al. Peritoneal tumor carcinomatosis: pharmacological targeting with hyaluronan-based bioconjugates overcomes therapeutic indications of current drugs. PLoS ONE. 2014;9:e112240. - PMC - PubMed
    1. Banzato A, et al. A paclitaxel-hyaluronan bioconjugate targeting ovarian cancer affords a potent in vivo therapeutic activity. Clin. Cancer Res. 2008;14:3598–3606. - PubMed

Publication types

MeSH terms