. 2021 Apr;592(7856):763-767.
doi: 10.1038/s41586-021-03358-w. Epub 2021 Mar 24.

REV-ERB in GABAergic neurons controls diurnal hepatic insulin sensitivity

Affiliations

REV-ERB in GABAergic neurons controls diurnal hepatic insulin sensitivity

Guolian Ding et al. Nature. 2021 Apr.

Erratum in

Abstract

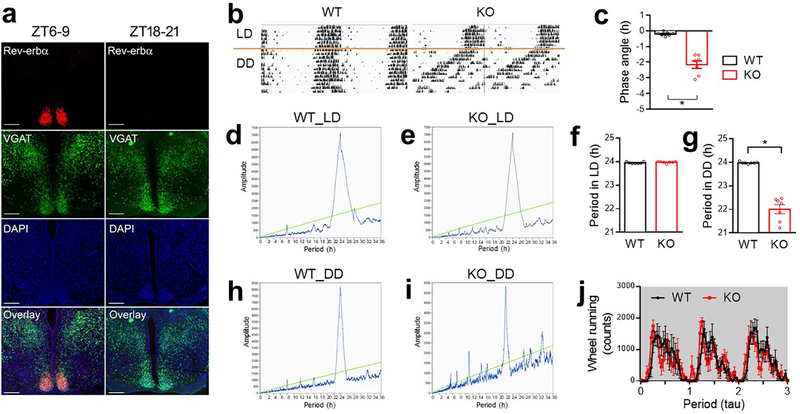
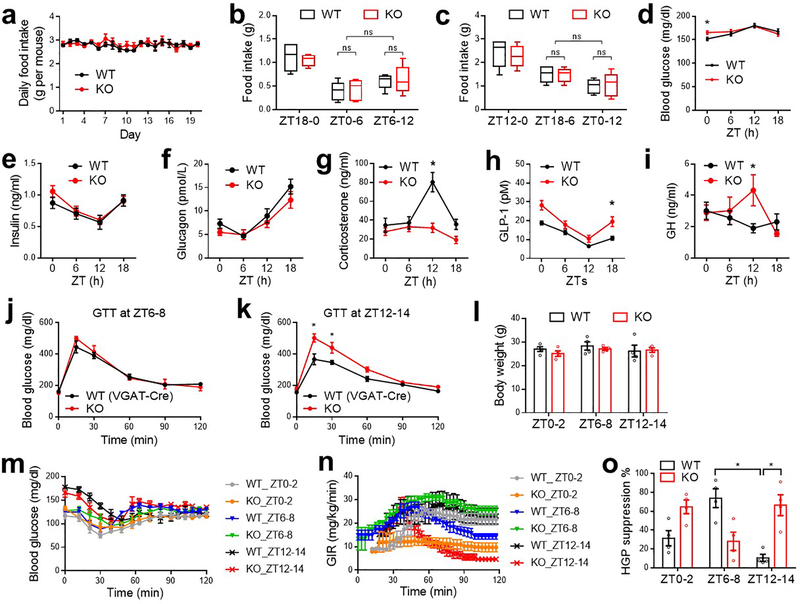
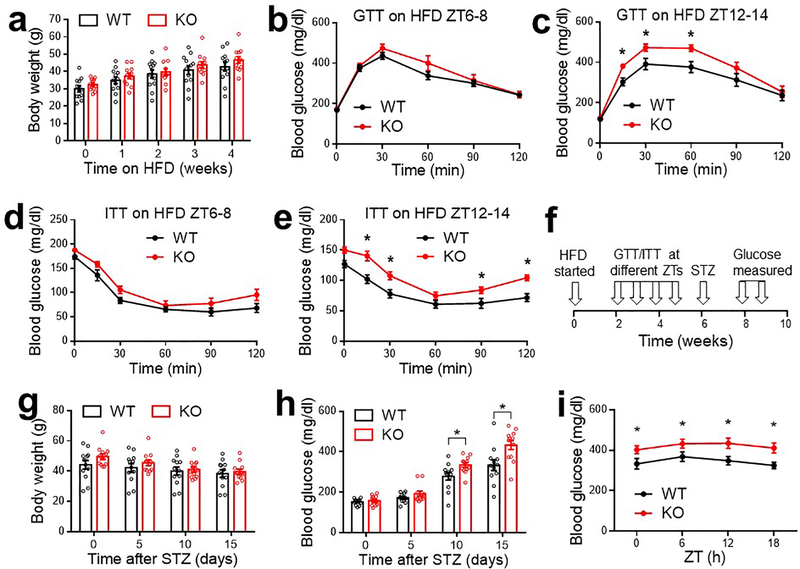
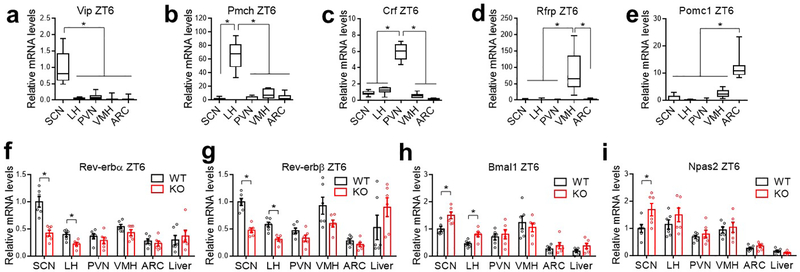
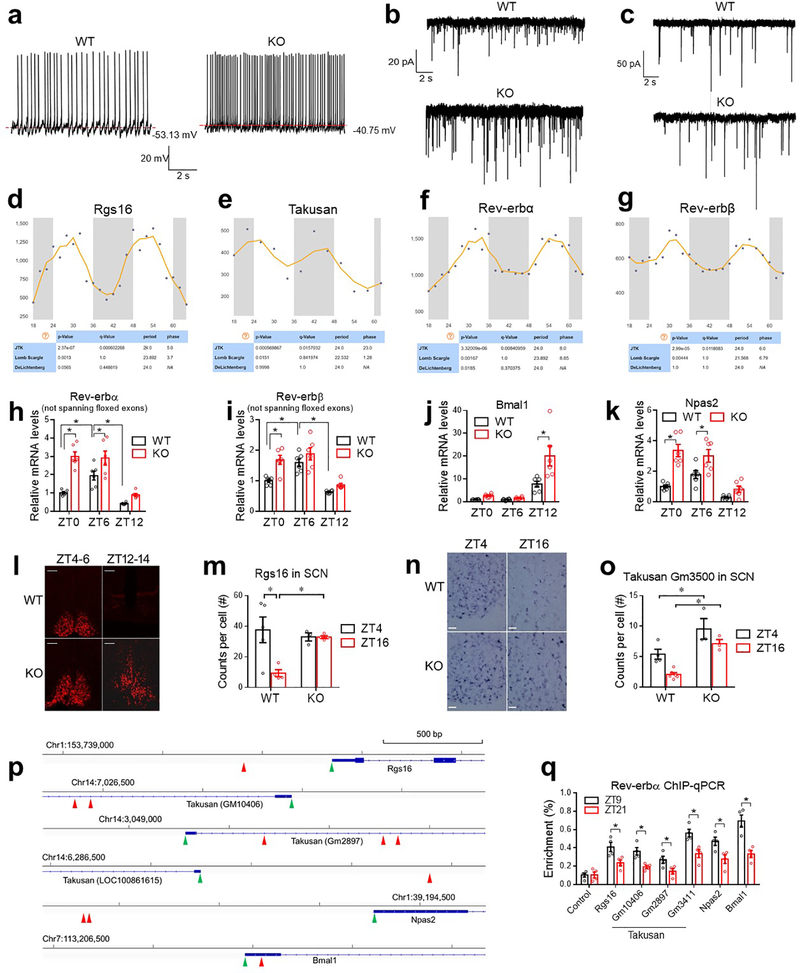
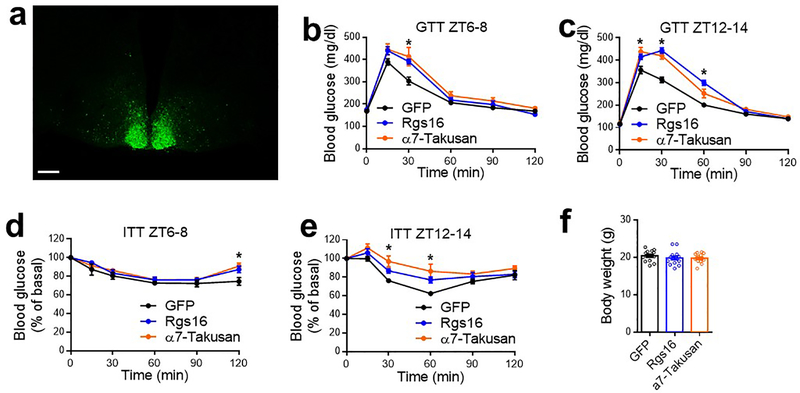
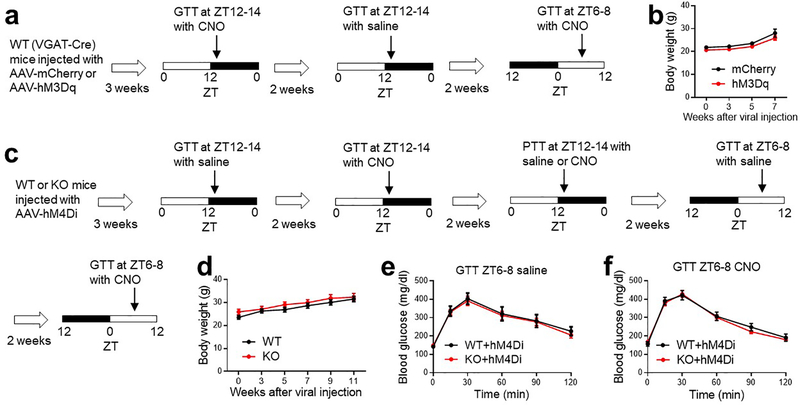
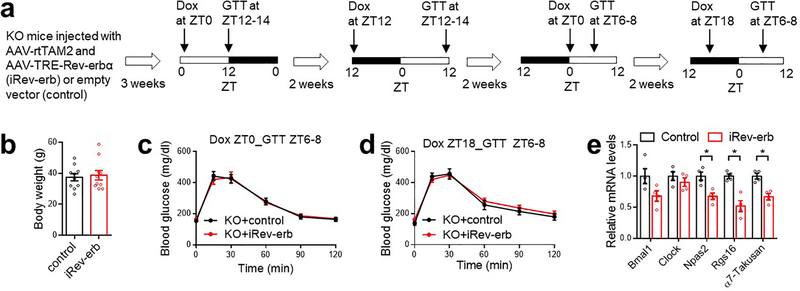
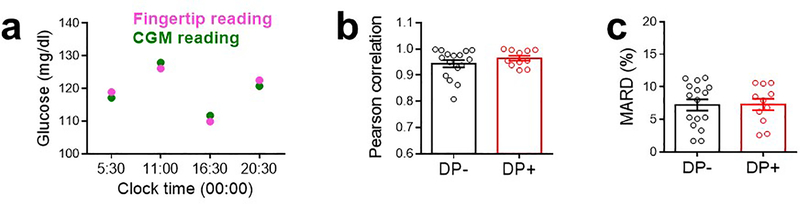
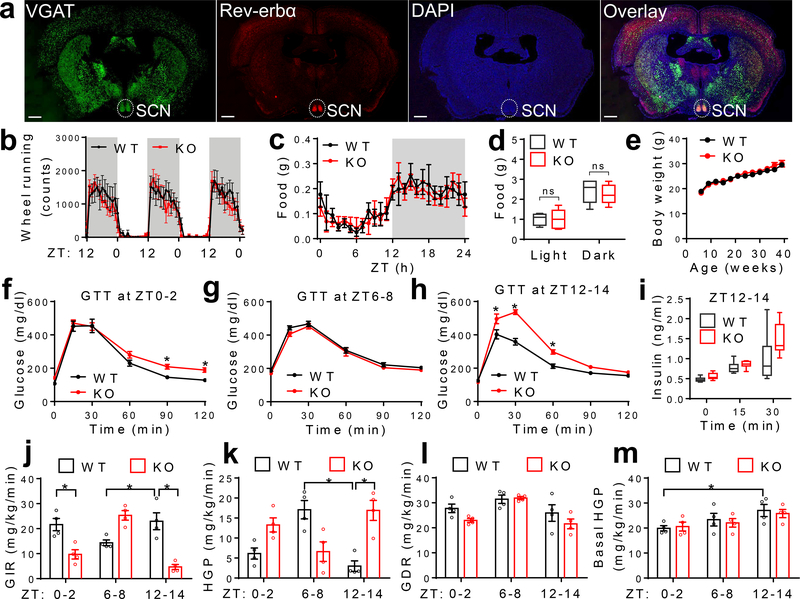
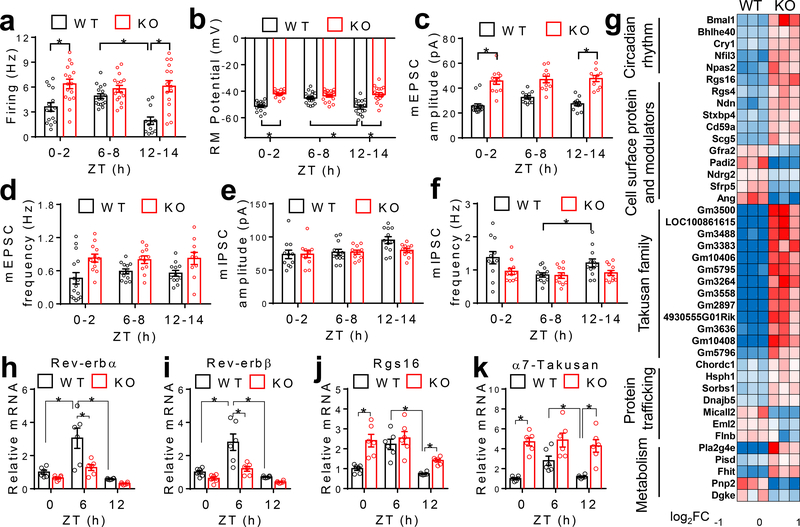
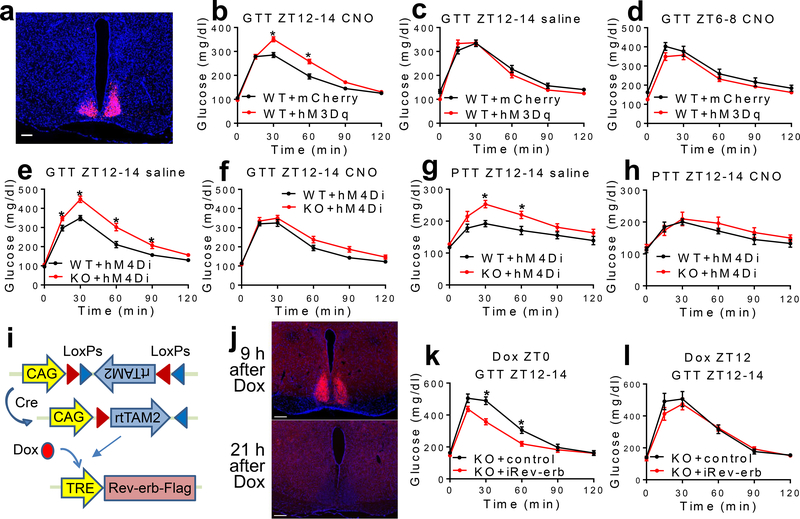
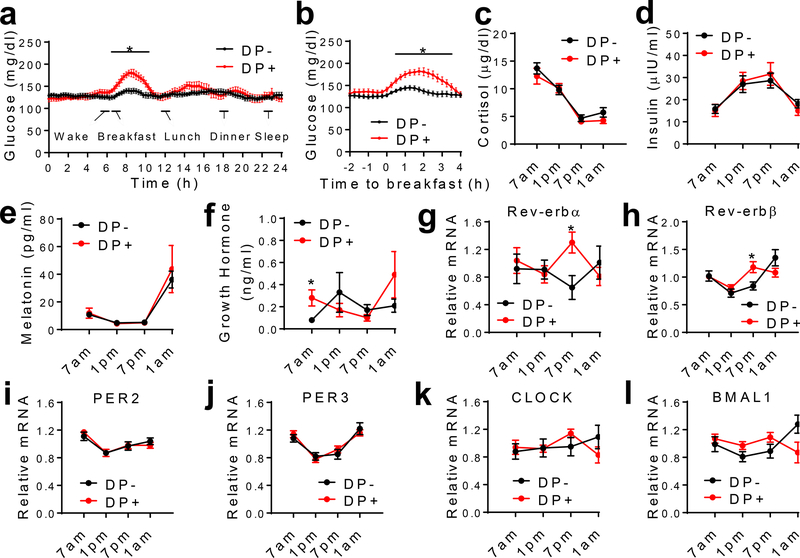
Systemic insulin sensitivity shows a diurnal rhythm with a peak upon waking1,2. The molecular mechanism that underlies this temporal pattern is unclear. Here we show that the nuclear receptors REV-ERB-α and REV-ERB-β (referred to here as 'REV-ERB') in the GABAergic (γ-aminobutyric acid-producing) neurons in the suprachiasmatic nucleus (SCN) (SCNGABA neurons) control the diurnal rhythm of insulin-mediated suppression of hepatic glucose production in mice, without affecting diurnal eating or locomotor behaviours during regular light-dark cycles. REV-ERB regulates the rhythmic expression of genes that are involved in neurotransmission in the SCN, and modulates the oscillatory firing activity of SCNGABA neurons. Chemogenetic stimulation of SCNGABA neurons at waking leads to glucose intolerance, whereas restoration of the temporal pattern of either SCNGABA neuron firing or REV-ERB expression rescues the time-dependent glucose metabolic phenotype caused by REV-ERB depletion. In individuals with diabetes, an increased level of blood glucose after waking is a defining feature of the 'extended dawn phenomenon'3,4. Patients with type 2 diabetes with the extended dawn phenomenon exhibit a differential temporal pattern of expression of REV-ERB genes compared to patients with type 2 diabetes who do not have the extended dawn phenomenon. These findings provide mechanistic insights into how the central circadian clock regulates the diurnal rhythm of hepatic insulin sensitivity, with implications for our understanding of the extended dawn phenomenon in type 2 diabetes.


Conflict of interest statement

COMPETING INTEREST

The authors declare no financial or non-financial conflict of interest. No patent was involved in the study.

Figures

Extended Data Figure 1.
Extended Data Figure 1.. Behavioral characterizations of KO mice.
(a) RNAscope analysis of Rev-erbα gene expression at ZT6–8 and ZT18–20 in WT mice at the age of 3 months old. Scale bar, 200 μm. (b) Representative wheel-running actogram in LD and DD at 5 months old. (c) Phase angle of the light entrainment in the last day of LD. n = 7 mice. (d-i) Representative chi-square periodogram and period length on LD or DD at the age of 5 months old. n = 7 mice. (j) Average wheel-running activity in DD after normalization to the intrinsic period (tau), n = 7 mice. Data are mean ± S.E.M. * p < 0.05 by two-sided t-test. Statistical details were in Supplementary Table 1.
Extended Data Figure 2.
Extended Data Figure 2.. Metabolic characterizations of KO mice on a normal chow diet.
(a) Daily food intake in home cages at 3 months old, n = 4 cages across 20 days. (b-c) Food intake measured by the comprehensive laboratory animal monitoring system (CLAMS) in the 6 h or 12 h prior to GTT analyses at 4 months old, n = 5 mice. Box-plots center lines, limits, and whiskers represent the median, quartile, and minimum/maximum values, respectively. (d) Blood glucose at 4 months old, n = 14 WT mice or 10 KO mice. (e) Serum insulin levels, n = 10 mice per group. (f) Blood glucagon levels, n = 12 mice per group. (g) Blood corticosterone levels, n = 11 mice per group. (h) Blood GLP-1 levels, n = 12 WT mice or 10 KO mice. (i) Blood growth hormone (GH) levels, n = 11 WT mice or 12 KO mice. (j-k) GTT at the indicated ZTs with VGAT-Cre mice serving as the WT control at the age of 5 months old, n = 7 mice. (l) Body weight for clamp analyses at 5 months old, n = 4 mice. (m-n) blood glucose levels and GIR during clamp analyses, n = 4 mice. (o) Hyperinsulinemia-mediated suppression of HGP in the clamp analyses, n = 4 mice. Data are mean ± S.E.M. * p < 0.05 by two-way ANOVA or two-sided t-test. Statistical details were in Supplementary Table 1.
Extended Data Figure 3.
Extended Data Figure 3.. Metabolic characterizations of KO mice on a high-fat diet (HFD).
(a) Body weight on HFD. HFD started at 10 months. n = 12 mice. (b) GTT at ZT6–8 after 2 weeks on HFD, n = 12 mice. (c) GTT at ZT12–14 after 3 weeks on HFD, n = 12 mice. (d) ITT at ZT6–8 after 4 weeks on HFD, n = 12 mice. (e) ITT at ZT12–14 after 5 weeks on HFD, n = 12 mice. (f) Injection of streptozotocin (STZ) at 6 weeks after HFD. (g-h) Body weight and blood glucose levels at ZT10 after STZ injection, n = 12 mice. (i) Blood glucose levels at the indicated ZTs at 2 weeks after STZ injection, n = 12 mice. Data are mean ± S.E.M. * p < 0.05 by two-way ANOVA or two-sided t-test. Statistical details were in Supplementary Table 1.
Extended Data Figure 4.
Extended Data Figure 4.. Gene expression analysis at different brain regions.
(a-e) RT-qPCR analysis of the indicated brain region-specific marker genes for the brain regions isolated from both WT and KO mice at ZT6 at the age of 3 months old, n = 12 mice. Box-plots center lines, limits, and whiskers represent the median, quartile, and minimum/maximum values, respectively. (f-i) RT-qPCR analysis comparing WT and KO mice at ZT6 at the age of 3 months old, n = 6 mice. Data are mean ± S.E.M. * p < 0.05 by two-way ANOVA or two-sided t-test. Statistical details were in Supplementary Table 1.
Extended Data Figure 5.
Extended Data Figure 5.. Electrophysiological and molecular characterizations of KO mice.
(a-c) Brain slice patch-clamp representative traces for spontaneous firing, mEPSC, and mIPSC at ZT12–14. (d-g) Temporal pattern of gene expression in the hypothalamus in LD from CircaDB (http://circadb.hogeneschlab.org). (h-k) RT-qPCR analysis of the SCN in WT and KO mice at 3 months old, n = 6 mice. Primers for Rev-erbα/β did not span the floxed exons. (l) RNAscope of Rgs16 at the SCN in WT and KO mice at the indicated ZTs. Scale bar, 100 μm. (m) Quantification of Rgs16 staining, n = 5 WT mice at ZT4, n = 3 KO mice at ZT4, n = 4 WT or KO mice at ZT16. (n) In situ hybridization analysis of Takusan Gm3500 staining. Scale bar, 25 μm. (o) Quantification of in situ hybridization analysis of Takusan member Gm3500, n = 4 WT mice at ZT4, n = 6 WT mice at ZT16, n = 3 KO mice at ZT4 or ZT16. (p) Genome browser views of transcription start sites (TSSs, green arrows) and nearby AGGTCA elements (red arrows) for the indicated genes on GRCm38. (q) Rev-erbα ChIP-qPCR analysis of the hypothalamus of WT mice at 3 months old at ZT9 and ZT21, the peak and trough of Rev-erbα expression, respectively. n = 4 samples. Hypothalami from 5 mice were pooled as one sample. The negative control primers target a gene desert region on chromosome 17. The primer sequences of ChIP-qPCR assays were in Supplemental Table 6. Data are mean ± S.E.M. * p < 0.05 by two-way ANOVA or two-sided t-test. Statistical details were in Supplementary Table 1.
Extended Data Figure 6.
Extended Data Figure 6.. Metabolic characterizations of mice overexpressing Rgs16 or α7-Takusan at the SCNGABA neurons.
(a) Validation of the injection with GFP fluorescence signals. Scale bar, 200 μm. (b-e) Glucose tolerance tests (GTT) and insulin tolerance test (ITT) in VGAT-Cre mice injected with AAV-FLEX vectors for GFP, Rgs16, or α7-Takusan at 4 months old. n = 7 mice. (f) Body weight of VGAT-Cre mice injected with AAV vectors at 3 weeks after injection at the age of 3 months. n = 14 mice. Data are mean ± S.E.M. * p < 0.05 for Rgs16 or α7-Takusan vs. the GFP control by two-way ANOVA followed by Holm-Sidak’s test. Statistical details were in Supplementary Table 1.
Extended Data Figure 7.
Extended Data Figure 7.. The rhythmicity of SCNGABA firing in glucose metabolism.
(a) Experimental design for chemogenetic activation of the SCNGABA neurons in WT mice with hM3Dq. (b) Body weight of VGAT-Cre mice injected with AAV expressing hM3Dq or control mCherry, n = 11 mice. Mice were injected at the age of 2 months old. (c) Experimental design for chemogenetic repression of the SCNGABA neurons in WT and KO mice with hM4Di. (d) Body weight of WT and KO injected with AAV expressing hM4Di, n = 12 mice for WT, n = 14 mice for KO. Mice were injected at the age of 2 months old. (e-f) GTT of WT or KO mice injected with AAV expressing hM4Di at the indicated ZT in the presence of CNO or saline, n = 12 mice for WT, n = 14 mice for KO. Data are mean ± S.E.M. * p < 0.05 by two-sided t-test.
Extended Data Figure 8.
Extended Data Figure 8.. The rhythmicity of SCNGABA Rev-erb expression in glucose metabolism.
(a) Experimental design for inducible re-expression of Rev-erbα in the SCNGABA neurons of KO mice. Virus was injected at 2.5 months old. (b) Body weight at the time of harvest, n = 9 mice. (c-d) GTT at ZT6–8 at 4–4.5 months old after Dox injection at the indicated time, n = 9 mice. (e) RT-qPCR analysis of the SCN from KO mice with inducible re-expression of Rev-erbα. Dox was injected at ZT0 and the brain were harvested at ZT12–14. n = 4 mice. Data are mean ± S.E.M. * p < 0.05 by two-sided t-test. Statistical details were in Supplementary Table 1.
Extended Data Figure 9.
Extended Data Figure 9.. Assessment of CGM performance.
(a) A representative comparison between fingertip glucometer reading and CGM reading for a patient at different times of the day. (b) Pearson correlation coefficient between CGM and fingertip readings. n = 16 without DP (DP-), n = 11 with DP (DP+). (c) Mean absolute relative difference (MARD), the average of the absolute error between all CGM values and matched reference values. n = 16 without DP (DP-), n = 11 with DP (DP+). Data are mean ± S.E.M.
Figure 1.
Figure 1.. Rev-erb in GABAergic neurons regulates rhythmic hepatic insulin sensitivity.
(a) RNAscope analysis of Rev-erbα gene expression at ZT6–9 at 3 months old. Scale bar, 500 μm. (b) Wheel-running activity in LD at 5 months old, n = 7 mice. (c-d) Food intake in LD at 4 months old, n = 5 mice. (e) Body weight, n = 10 mice. (f-h) Glucose tolerance tests (GTT) at 4 months old, n = 8 mice. (i) Serum insulin levels at 5 months old, n = 8 mice. (j-m) Insulin clamp analyses at 5 months old, n = 4 mice. Data are mean ± S.E.M. Box-plots center lines, limits, and whiskers represent the median, quartile, and minimum/maximum values, respectively. * p < 0.05 by two-way ANOVA or two-sided t-test. Statistical details were in Supplementary Table 1.
Figure 2.
Figure 2.. Rev-erb regulates the diurnal rhythm of the SCNGABA neural activity.
(a-b) Spontaneous firing frequency and resting membrane (RM) potential of SCNGABA neurons at 4 months old, n = 12–17 neurons. (c-d) mEPSCs of SCNGABA neurons at 4 months old, n = 10–15 neurons. (e-f) mIPSCs of SCNGABA neurons at 4 months old, n = 11–12 neurons. (g) Differentially expressed genes (DEGs) in KO vs. WT mice identified by RNA-seq of the SCN at ZT12–14 at 4 months old. (h-k) RT-qPCR analysis of the SCN at 4 months old, n = 6 mice. Primers for Rev-erbα/β span the floxed exons. Data are mean ± S.E.M. * p < 0.05 by two-way ANOVA or two-sided t-test. Statistical details were in Supplementary Table 1.
Figure 3.
Figure 3.. The rhythmicity of the SCNGABA neural activity and Rev-erb expression regulates rhythmic glucose metabolism.
(a) Expression of hM3Dq in SCNGABA neurons after bilateral stereotaxic AAV injection. Blue, DAPI. Red, mCherry. Scale bar, 100 μm. (b-d) GTT at 3–4 months old, n = 11 mice. (e-f) GTT in mice bilaterally injected with AAV expressing hM4Di at the SCN at 3–4 months old, n = 12 WT and 14 KO mice. (g-h) Pyruvate tolerance test (PTT) at ZT12–14 in mice injected with AAV expressing hM4Di at 4 months old, n = 6 WT and 7 KO mice. (i) AAV vectors for inducible re-expression of Rev-erbα. (j) Immunostaining to Flag-tagged Rev-erbα at 9 and 21 h after doxycycline (Dox) injection. Blue, DAPI. Red, Flag. Scale bar, 200 μm. (k) GTT at ZT12–14, 12 h after Dox injection at ZT0, at 3 months old, n = 9 mice. (l) GTT at ZT12–14, 24 h after Dox injection at ZT12, at 3.5 months old, n = 9 mice. Data are mean ± S.E.M. * p < 0.05 by two-way ANOVA or two-sided t-test. Statistical details were in Supplementary Table 1.
Figure 4.
Figure 4.. Dawn phenomenon (DP) is associated with the altered Rev-erb expression.
(a-b) Continuous glucose monitoring (CGM) data of T2D patients, n = 16 without DP (DP-), n = 11 with DP (DP+). (c-f) Oscillation of plasma hormone levels, n = 16 without DP, n = 11 with DP. (g-l) RT-qPCR analysis of gene expression in blood monocytes collected at the indicated time. Data were normalized to the average value of all time-points for each patient. n = 12 without DP, n = 10 with DP. Data are mean ± S.E.M. * p < 0.05 by two-way repeated-measure ANOVA with Holm-Sidak’s test. Statistical details were in Supplementary Table 1.

References

    1. Shi S, Ansari TS, McGuinness OP, Wasserman DH & Johnson CH Circadian disruption leads to insulin resistance and obesity. Curr. Biol. 23, 372–381 (2013). - PMC - PubMed
    1. Coomans CP et al. Detrimental effects of constant light exposure and high-fat diet on circadian energy metabolism and insulin sensitivity. FASEB J. 27, 1721–1732 (2013). - PubMed
    1. O’Neal TB & Luther EE Dawn Phenomenon. in StatPearls (StatPearls Publishing, 2020). - PubMed
    1. Monnier L, Colette C, Dejager S & Owens D Magnitude of the dawn phenomenon and its impact on the overall glucose exposure in type 2 diabetes: is this of concern? Diabetes Care 36, 4057–4062 (2013). - PMC - PubMed
    1. Hastings MH, Maywood ES & Brancaccio M Generation of circadian rhythms in the suprachiasmatic nucleus. Nat. Rev. Neurosci. 19, 453–469 (2018). - PubMed

Publication types