. 2021 Apr;592(7853):302-308.
doi: 10.1038/s41586-021-03357-x. Epub 2021 Mar 24.

Breast tumours maintain a reservoir of subclonal diversity during expansion

Affiliations

Breast tumours maintain a reservoir of subclonal diversity during expansion

Darlan C Minussi et al. Nature. 2021 Apr.

Abstract

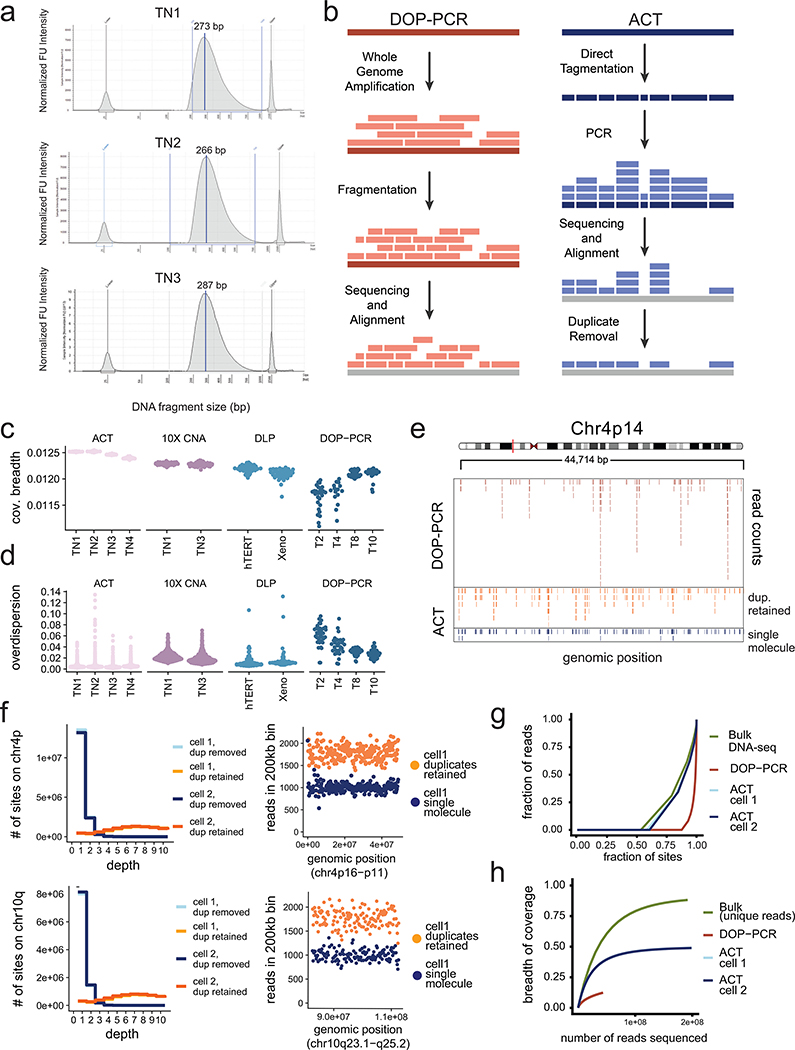
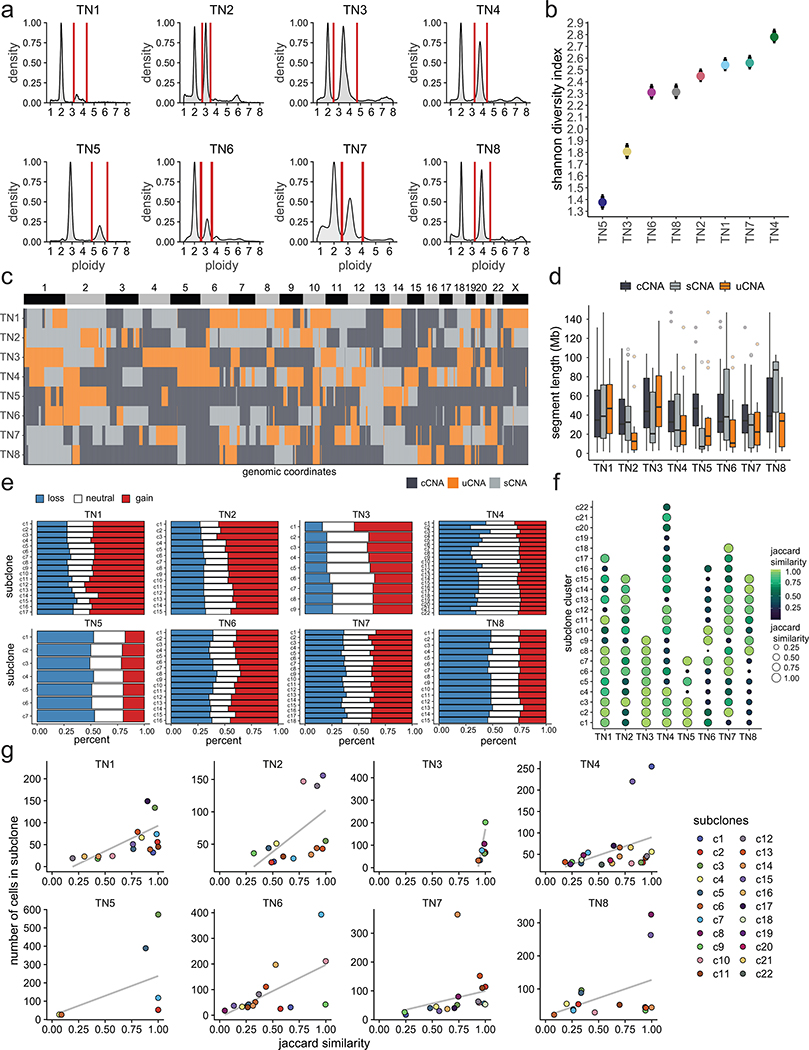
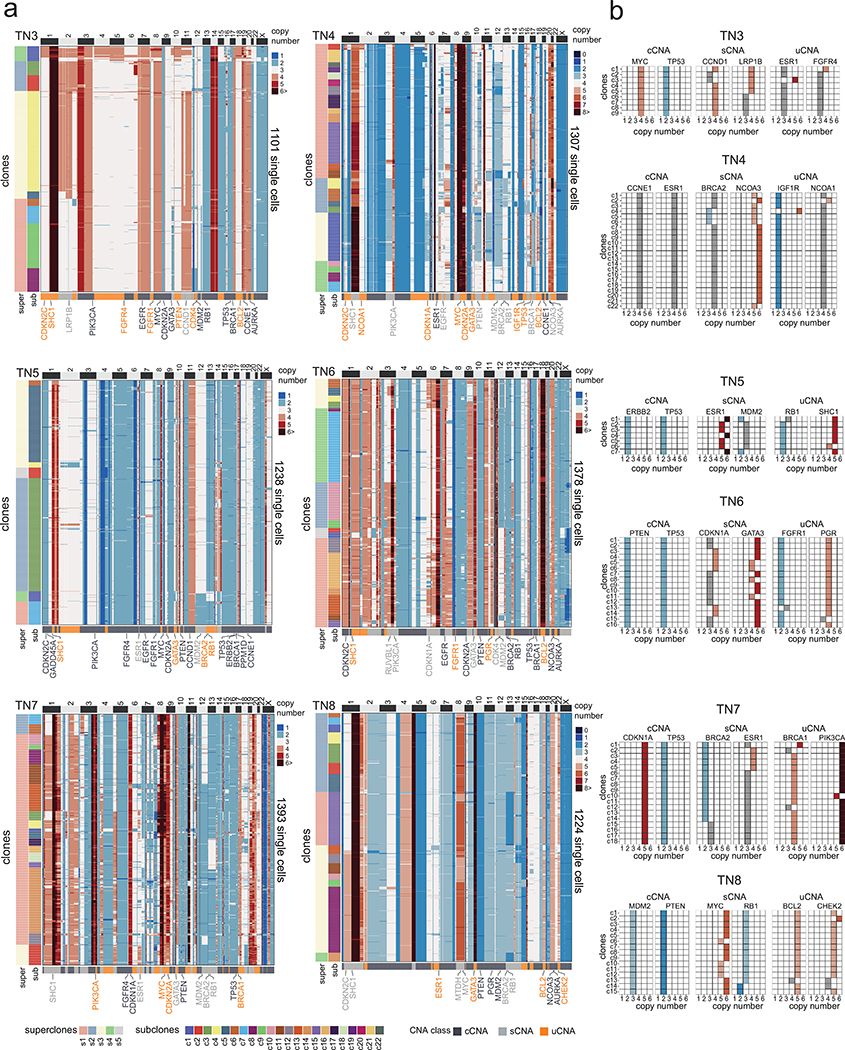
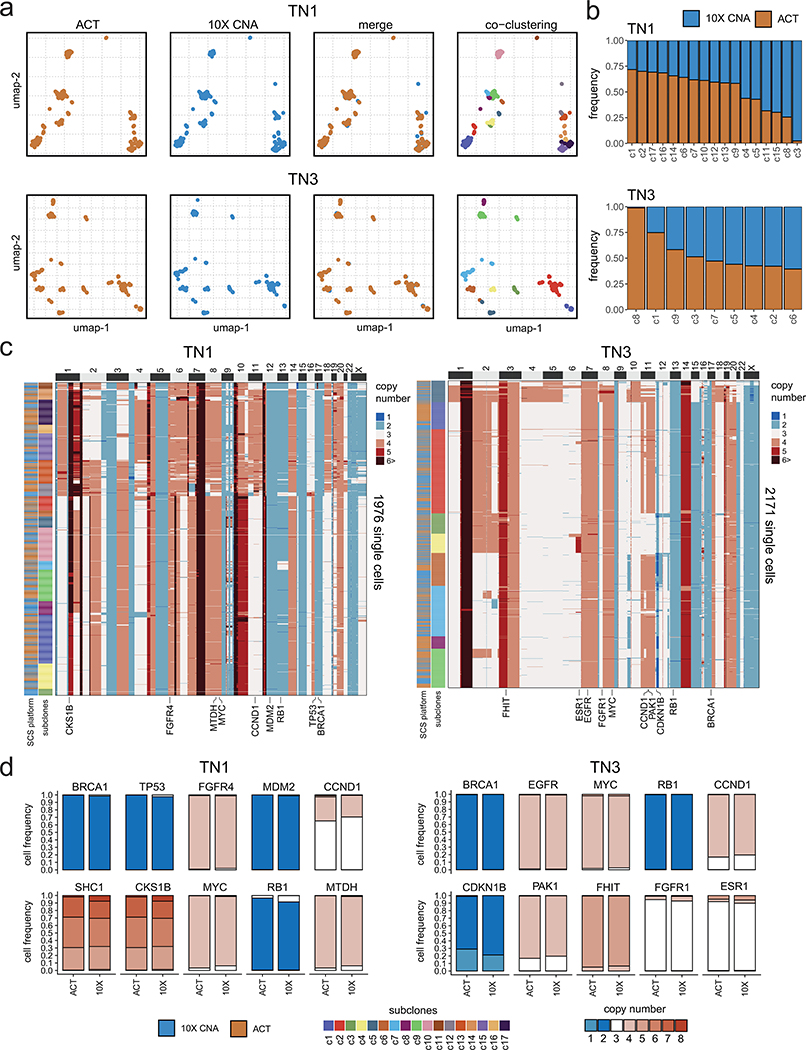
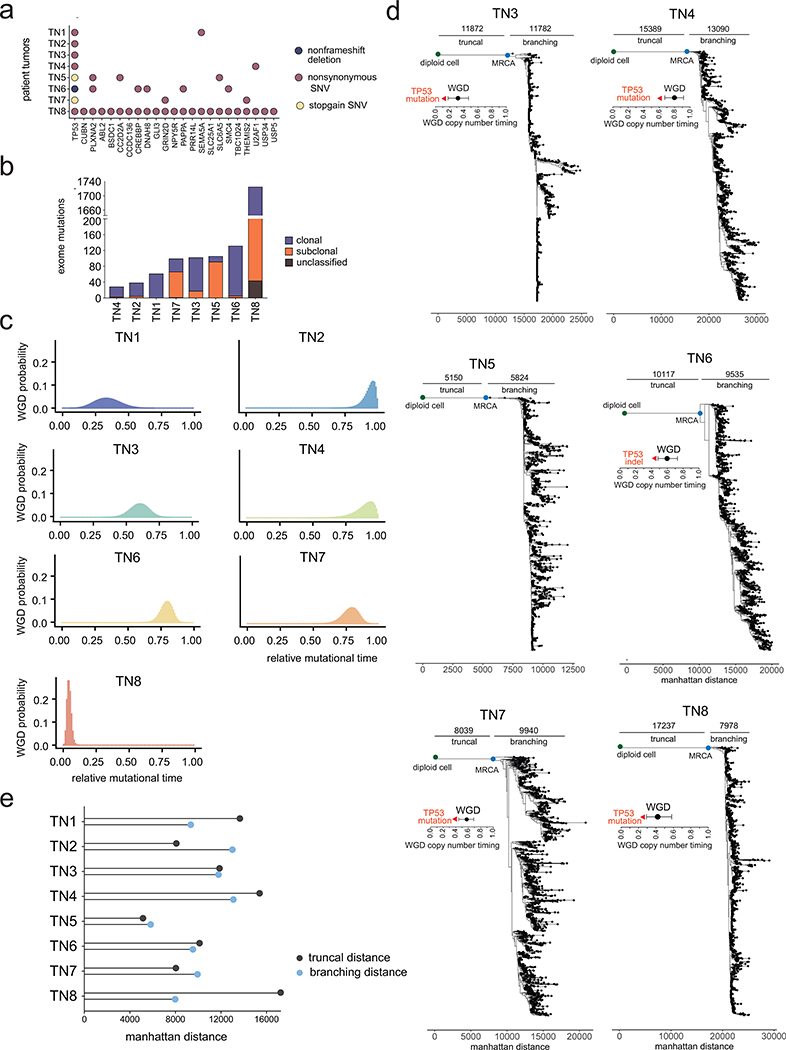
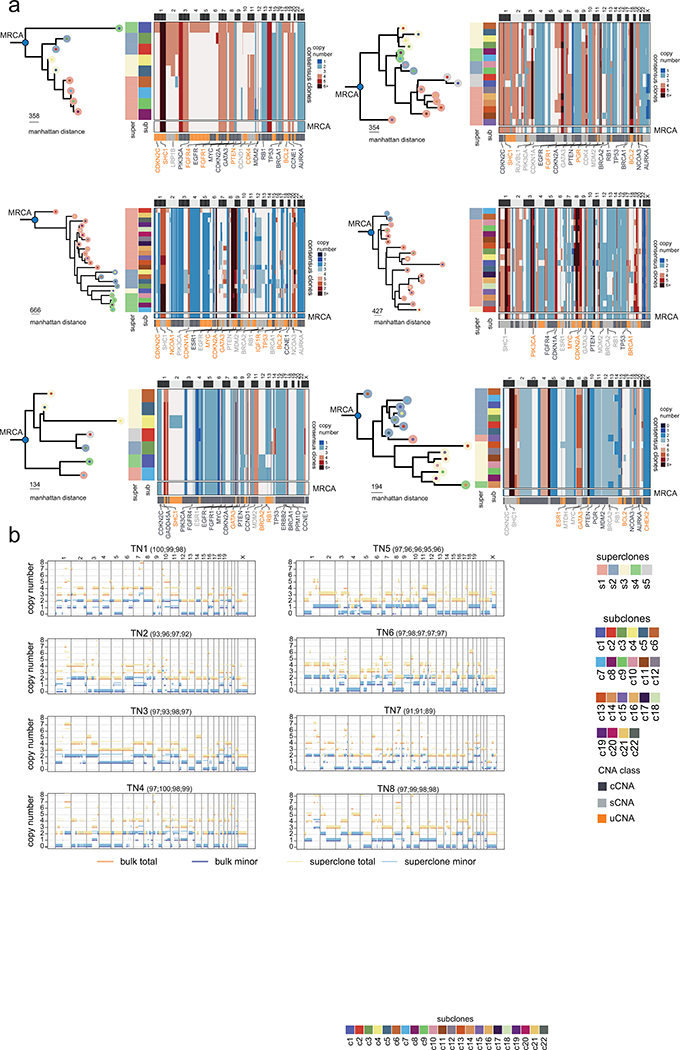
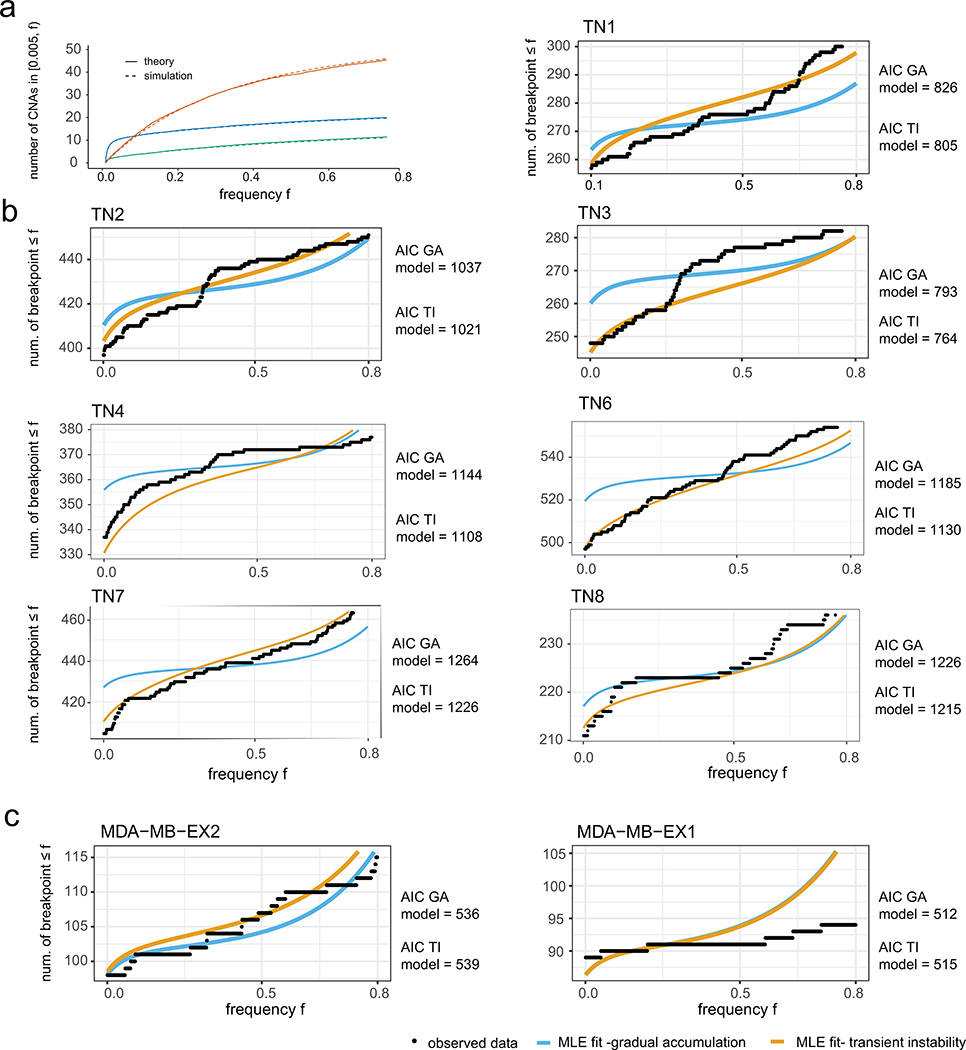
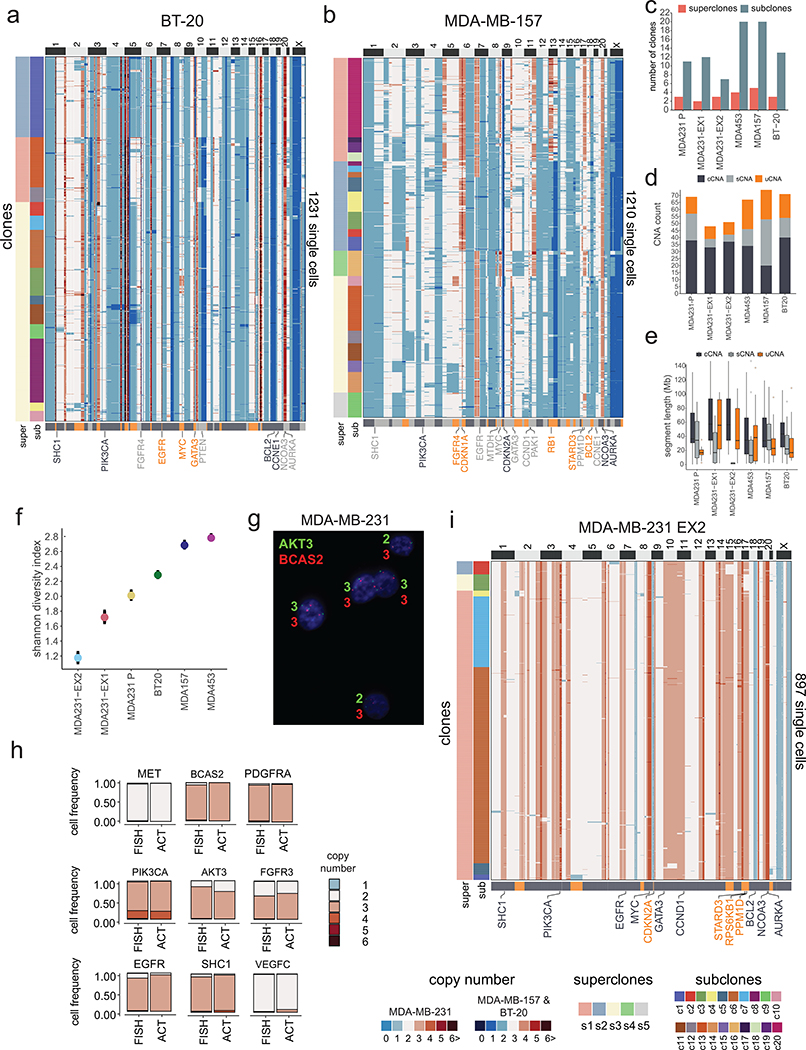
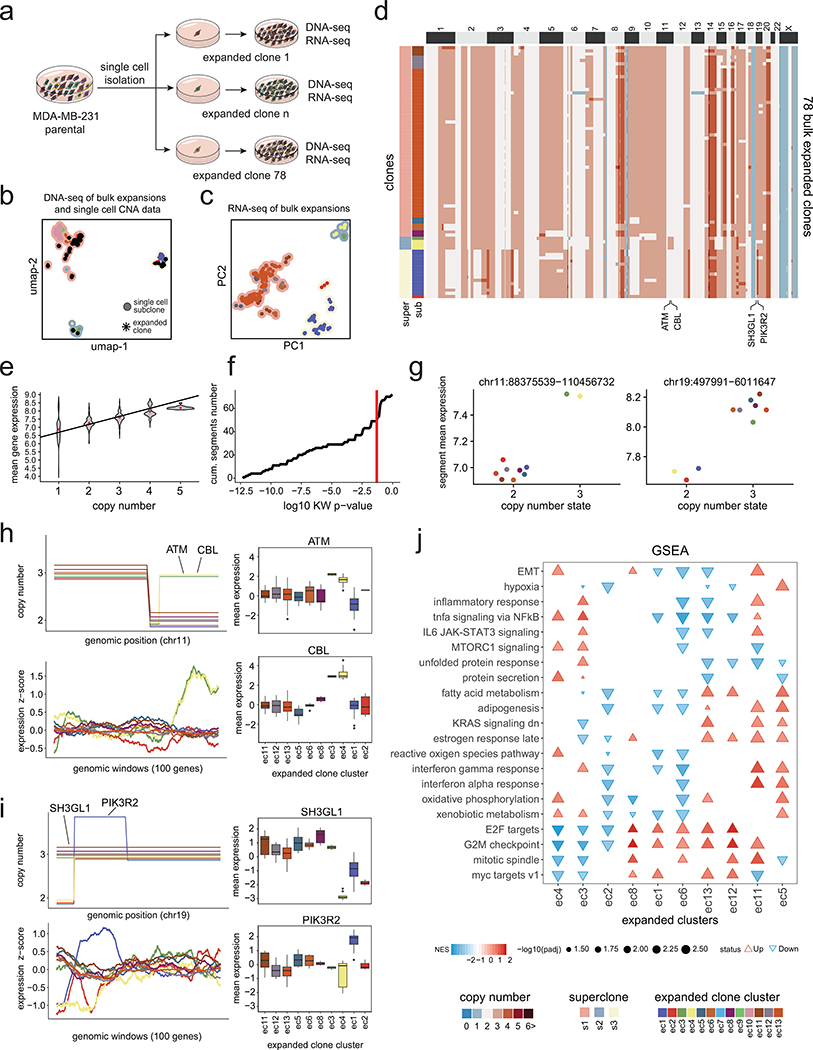
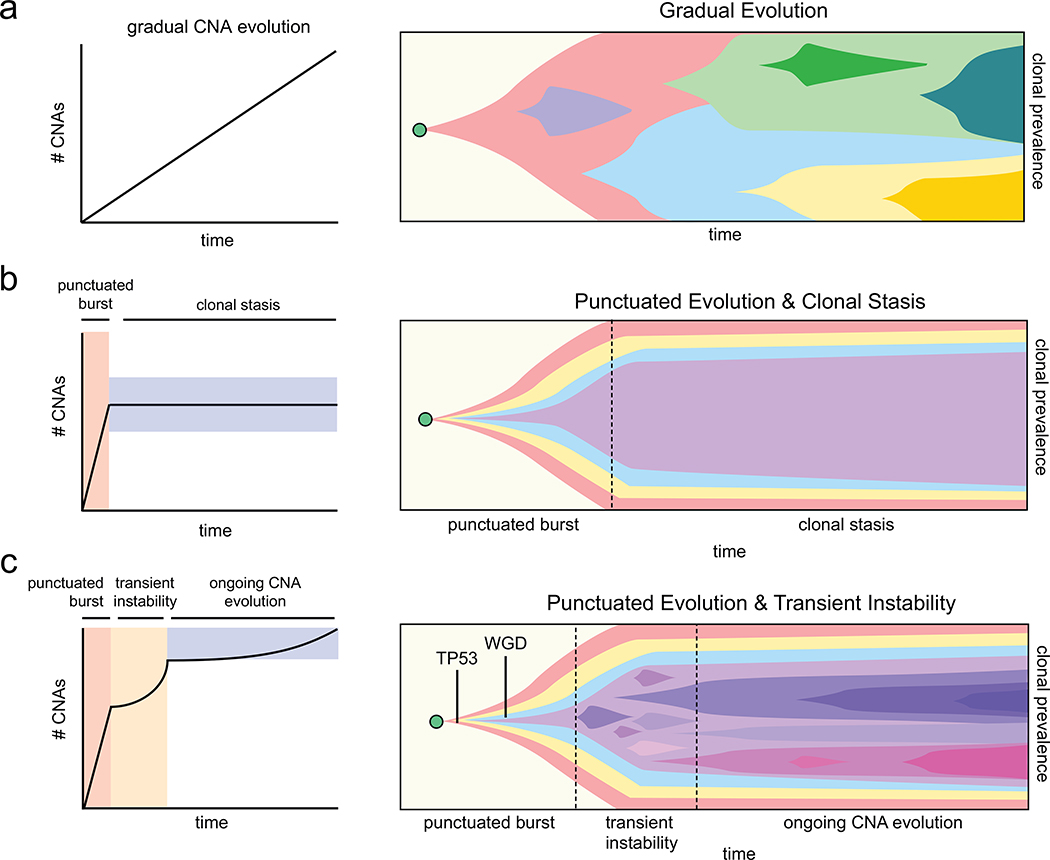
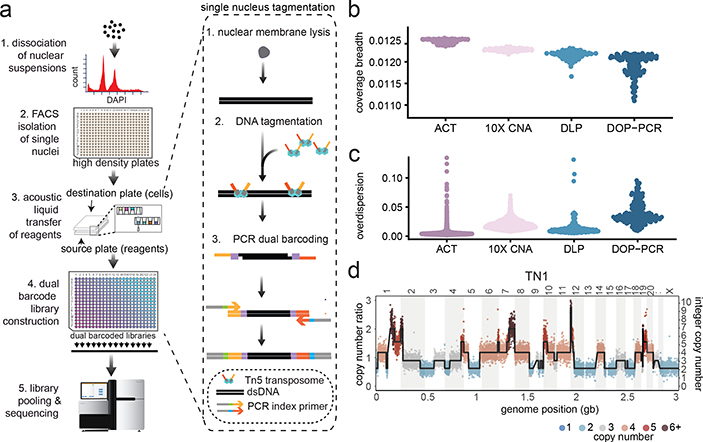
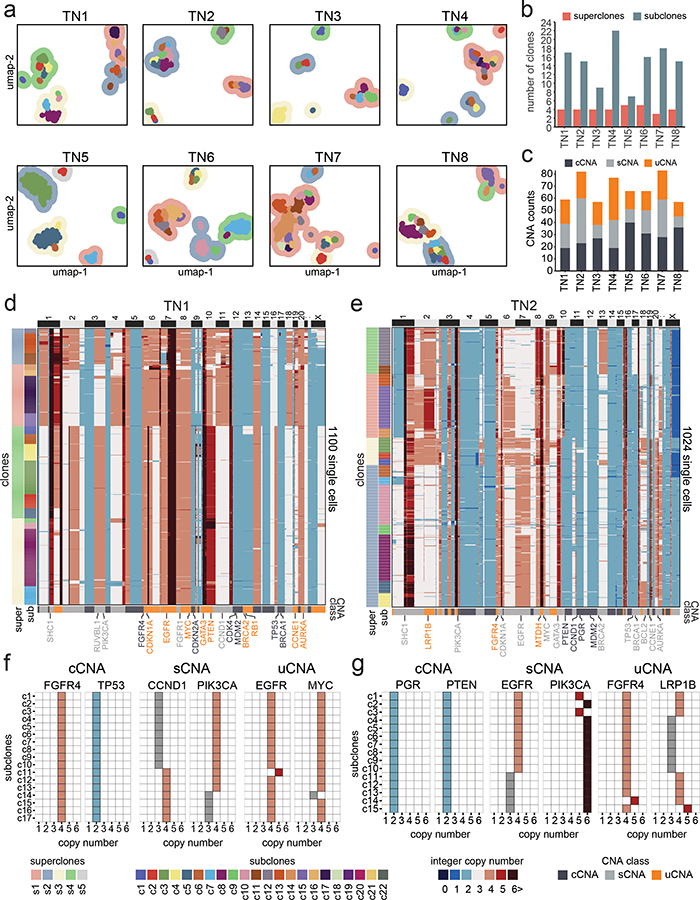
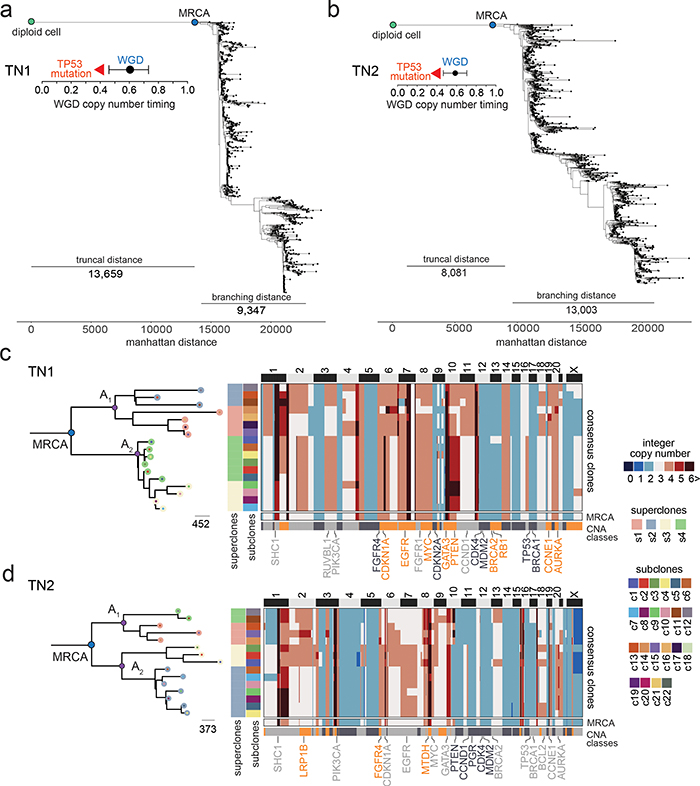
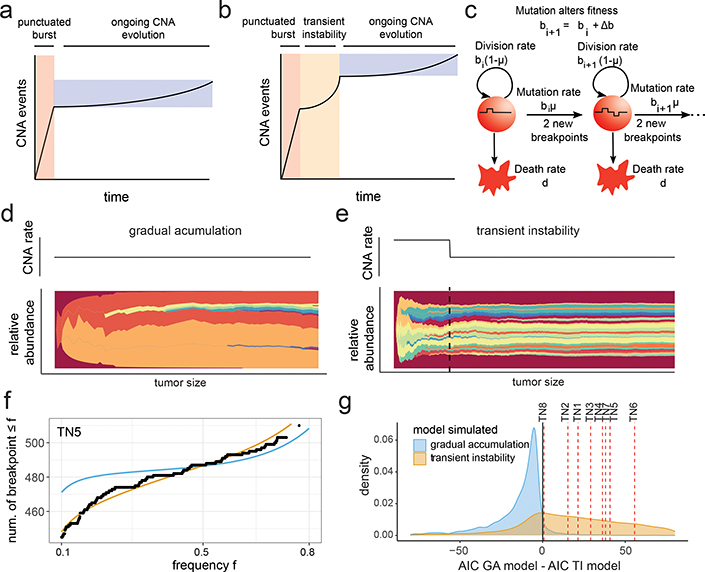
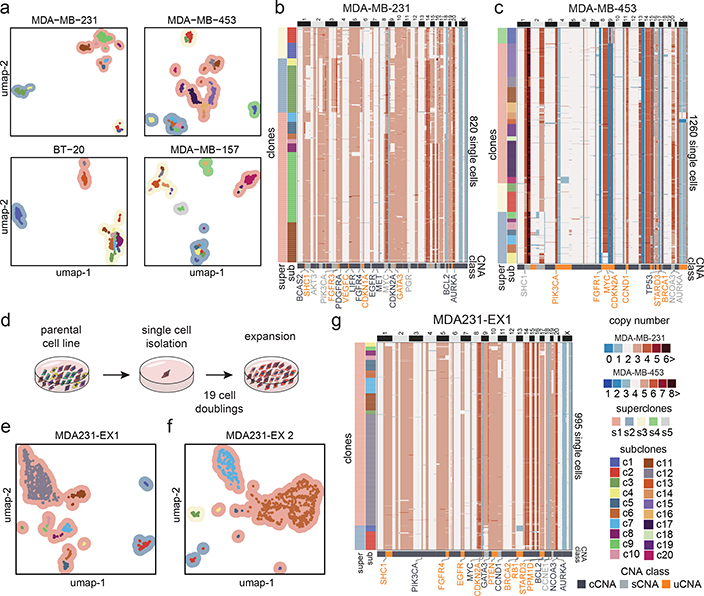
Our knowledge of copy number evolution during the expansion of primary breast tumours is limited1,2. Here, to investigate this process, we developed a single-cell, single-molecule DNA-sequencing method and performed copy number analysis of 16,178 single cells from 8 human triple-negative breast cancers and 4 cell lines. The results show that breast tumours and cell lines comprise a large milieu of subclones (7-22) that are organized into a few (3-5) major superclones. Evolutionary analysis suggests that after clonal TP53 mutations, multiple loss-of-heterozygosity events and genome doubling, there was a period of transient genomic instability followed by ongoing copy number evolution during the primary tumour expansion. By subcloning single daughter cells in culture, we show that tumour cells rediversify their genomes and do not retain isogenic properties. These data show that triple-negative breast cancers continue to evolve chromosome aberrations and maintain a reservoir of subclonal diversity during primary tumour growth.


Conflict of interest statement

Competing interests

F.M. is the co-founder of an oncology company.

Figures

Extended Data Figure 1 –
Extended Data Figure 1 –. Technical Metrics and Performance of ACT
(a) ACT single cell DNA library size distributions for TN1, TN2 and TN3 after pooling 384 cell libraries. (b) Schematic of using positional barcoding information to determine single-molecule information by tagmentation during ACT, compared to whole-genome amplification using DOP-PCR, where the original DNA fragmentation sites of single molecules cannot be resolved. (c) Breadth of coverage for sparse depth data from different scDNA-seq methods plotted by individual samples, using N=100 random cells per sample. (d) Overdispersion of bin counts for sparse depth data from different scDNA-seq methods plotted by individual samples, using N=100 random cells per sample. (e) Distribution of sequencing reads across a diploid region of chromosome 4p14 for a single SK-BR-3 cell sequenced by DOP-PCR compared to ACT, in which the PCR duplicates were retained or removed to obtain single-molecule data. (f) Distribution of sequencing reads across a diploid region of chromosome 4p (top panel) and 10q (bottom panel) for a single SK-BR-3 cell sequenced by DOP-PCR compared to ACT, with or without duplicate molecules retained. (g) Lorenz curves of coverage uniformity for ACT, DOP-PCR and one bulk DNA-seq data from SK-BR-3 single cells, downsampled to equal coverage depth. (h) Breadth of coverage as a function of pseudo-bulk reconstruction by combining multiple cells for ACT, DOP-PCR and bulk sequencing.
Extended Data Figure 2 –
Extended Data Figure 2 –. Molecular Properties of Subclonal Chromosome Aberrations
(a) FACS profiles of DAPI-stained nuclei flow-sorted for ACT from eight TNBC patients showing ploidy distributions, with vertical red lines showing the sorting gates. (b) Shannon diversity indexes calculated from the single cell copy number data from each of the eight TNBC patients with 95% confidence intervals indicated. (c) Heatmap of the genomic regions of cCNAs, sCNAs and uCNAs across the eight tumor samples. (d) Distributions of the genomic segment sizes of clonal, subclonal and unique CNAs across the eight tumors. (e) Proportion of genome altered relative to the tumor ploidy classified as copy number losses in blue, neutral ground state copy number in white and gains in red. (f) Bootstrapping of subclone clusters showing the mean jaccard similarity for each subclone across the eight tumors. (g) Scatter plots of number of cells in each subclone cluster by mean jaccard similarity for each of the eight tumors.
Extended Data Figure 3 –
Extended Data Figure 3 –. Copy Number Substructure of Additional TNBC Patients
(a) Clustered heatmaps of single cell copy number profiles for TN3 – TN8 with left annotation bars representing superclones and subclones, and bottom annotation bars representing different genomic regions of CNAs classes as well as annotations for selected breast cancer genes. (b) Matrix plots for TN3 – TN8 showing integer copy number states for selected breast cancer genes in regions of cCNAs, sCNAs and uCNAs across the different subclones in each tumor.
Extended Data Figure 4 –
Extended Data Figure 4 –. Validation of Clonal Substructure Using a Microdroplet Approach
(a) Co-clustering of ACT and 10X Genomics copy number data for samples TN1 (n = 1976 cells) and TN3 (n = 2171 cells), showing subclones detected in the merged data sets. (b) Frequency of subclones detected on each platform in the merged datasets from 10X and ACT. (c) Clustered heatmaps of single cell copy number profiles for TN1 and TN3 with left annotation bars representing the scDNA-seq technology platform and the different subclones, with annotations for selected breast cancer genes indicated below (d) Barplots of copy number state frequencies of selected breast cancer genes for ACT and 10X CNV showing the proportion of copy number states for all cells separated by platform.
Extended Data Figure 5 –
Extended Data Figure 5 –. Whole Genome Doubling Estimates and Additional Copy Number Lineages
(a) Exome mutation counts of each tumor indicating mutations that were classified as clonal or subclonal based on allele-specific copy number frequencies. (b) Most frequent exonic mutations in genes with significant SIFT (<0.05) and Polyphen2 (>0.85) scores. (c) Density plots showing the probability of genome doubling as a function of relative mutational time for 7 out of the 8 TNBC patients with sufficient number of truncal exome mutations (d) Minimum evolution trees of single cell copy number profiles using Manhattan distances for TN3-TN8, indicating the distance from the diploid root node to the most recent common ancestral (MRCA) and the distance from the MRCA to the terminal nodes. Annotations indicate the timing of genome doubling and timing of TP53 mutations prior to WGD in all of the tumors. (e) Summary of the truncal distances from the diploid root node to the MRCA and the branching distances from the MRCA to the last terminal node.
Extended Data Figure 6 -
Extended Data Figure 6 -. Evolutionary Analysis of Clonal Lineages in additional TNBC Patients
(a) Left panels show the minimum evolution trees after the MRCA generated using the consensus CNA profiles of subclones for TN3 – TN8 rooted by a neutral node to the MRCA and colored by superclones and subclones. Right panels show heatmaps of consensus subclones profiles, with annotations for the superclones and subclones on left annotation bars and bottom annotation bars showing different CNA classes, as well as selected breast cancer genes. The last row in the clustered heatmaps shows the inferred MRCA copy number profiles. (b) Genome-wide copy-number profiles of TNBC tumors with segments of the rounded total copy-number (orange) and the rounded number of copies of the minor allele (blue). Thick segments are ASCAT profiles from the exome bulk, while thinner segments are from the superclones with slight offset relative to integer values for visualization. For each superclone, in parentheses the percentage of the genomic region where both the minor and major allele copy numbers are the same as in the exome are shown, restricting to the genomic region where the total is also the same.
Extended Data Figure 7 –
Extended Data Figure 7 –. Chromosome Breakpoint Frequency Spectra of Additional Tumors
(a) Comparison of the expected CNA frequency spectrum obtained from theory and simulation. Simulations include a flexible fitness distribution, while the theory considers neutral and lethal changes only. Different colors correspond to varying the increase in CNA rate during the transient instability phase, and the tumor size at which the instability subsides. Exact parameters given in the Supplementary Methods 1. (b) Maximum likelihood fits for the breakpoint frequency spectra obtained for TNBC tumors under models of gradual and transient instability after PCNE, parameter values for simulations and further details are provided in the Supplementary Methods. (c) Maximum likelihood fits for the breakpoint frequency spectra obtained from expanded clones of MDA-MB-231 under models of gradual and transient instability. Further details are provided in the Supplementary Methods.
Extended Data Figure 8 –
Extended Data Figure 8 –. Clonal Substructure of Additional TNBC Cell Lines and Single Cell Expansions
(a-b) Clustered heatmaps of single cell copy number data from the BT-20 (n = 1231 cells) and MDA-MB-157 (n = 1210 cells) cell lines, in which left annotation bars represent superclones and subclones, while the bottom annotation bar represents different classes of CNA types (c) Number of superclones and subclones identified in the TNBC cell lines (d) Number of clonal, subclonal and unique CNAs detected in the 4 TNBC cell lines, as well as the two MDA-MB-231 expanded daughter cells. (e) Distributions of the genomic sizes of clonal, subclonal and unique CNAs across the 4 TNBC cell lines and the two MDA-MB-231 expanded daughter cell lines. (f) Shannon indexes calculated from the single cell copy number profiles from the 4 TNBC cell lines and the two expanded MDA-MB-231 daughter cells with 95% confidence intervals. (g) Microscopic field of DNA-FISH experiments of MDA-MB-231 using AKT3 and BCAS2 probes at 60X magnification. (h) Barplots showing the results of DNA-FISH copy number states counted across 1000 cells for each of the probes compared to the ACT data. (i) Clustered heatmap of single cell copy number data for MDA-MB-231 EX2 cell line expansion (n = 897 cells), in which left annotation bars represent superclones and subclones, while the bottom annotation bar represents different classes of CNA types.
Extended Data Figure 9 –
Extended Data Figure 9 –. DNA and RNA Analysis of Expanded Clones from MDA-MB-231
(a) Schematic of physical single cell subcloning experiments of daughter cells to generate 78 expansions from the MDA-MB-231 parental cell line. (b) Co-clustering of the single cell copy number data from the parental MDA-MB-231 cell line (n = 820 cells) with the 78 expanded clone bulk DNA-seq copy number profiles. (c) PCA of bulk RNA-seq profiles of the 78 expanded daughter cell lines triplicates, with contour colors representing superclones and point color representing the subclone clusters from the genotypes of the single-cell and bulk DNA-Seq co-clustering. (d) Clustered heatmap of bulk DNA copy number profiles from the 78 expanded clones, with left annotation bars representing superclones and subclones, as determined by co-clustering with the parental single cell copy number data. (e) Mean gene expression levels of different copy number states for 78 expansions from the MDA-MB-231 parental cell line. (f) Cumulative number of subclonal segments as a function of Kruskal-Wallis test p-value, in which the red line denotes a p-value of 0.05. (g) Mean gene expression as a function of copy number segments with points representing expanded clusters for two subclonal CNAs on chr11 and chr19. (h-i) Consensus integer copy number profiles of the 10 expanded clone clusters on chromosome 11 (h) and chromosome 19 (i) shown in the upper panels with matched RNA-seq expression below using moving windows of 100 genes. Right panels show selected breast cancer genes in subclonal CNA regions and their corresponding box plots of RNA expression for each expanded cluster. (j) Cancer hallmark signatures with significant variability of normalized enrichment scores (NES) across the expanded clone clusters.
Extended Data Figure 10 –
Extended Data Figure 10 –. Models of Chromosome Evolution During Primary Tumor Expansion
(a-c) Three models of chromosome evolution dynamics during the expansion of primary TNBC tumors, with schematic plots of chromosome accumulation over time in left panels and Muller plots of clonal frequencies in right panels. (a) Gradual model of copy number evolution, in which CNAs are acquired sequentially throughout tumor progression leading to the expansion of successive subclones over time (b) Punctuated copy number evolution model, in which an initial burst of instability generates a large number of CNAs and subclones that undergo stable expansions to form the primary tumor mass, with no (or few) new CNAs acquired after the initial burst (c) Model of punctuated evolution and transient instability, in which the early acquisition of TP53 mutations and genome doubling lead to a burst of genomic instability in which a large number of CNA events are acquired and subclones are generated. These events are followed by a period of transient instability and ongoing copy number evolution during the expansion of the primary tumor mass, which leads to the generation of additional subclones and genomic diversity.
Figure 1 –
Figure 1 –. ACT Method and Technical Performance
(a) Experimental steps to perform Acoustic Cell Tagmentation involve the dissociation of nuclei from tissues, isolation of single nuclei into high density 384-well plates by FACS, acoustic liquid transfer of tagmentation reagents, PCR addition of dual barcodes and pooling of single cell libraries for multiplexed sequencing. (b) Breadth of coverage for sparse scDNA-seq data from four different methods, including ACT, DLP, 10X Genomics CNV and DOP-PCR using N = 100 sampled cells. (c) Overdispersion of bin counts in sparse scDNA-seq data from ACT, DLP, 10X Genomics CNV and DOP-PCR using N=100 sampled cells. (d) Copy number ratio and integer segmentation plots for a single cell from TN1.
Figure 2 –
Figure 2 –. Clonal Substructure of Eight Triple-Negative Breast Tumors
(a) High-dimensional UMAP clustering of single cell copy number data from 8 triple-negative breast tumors, where contour colors represent superclones and colored points represent subclones. (b) Number of superclones and subclones detected in each tumor. (c) Number of clonal, subclonal and unique CNAs detected in each tumor. (d-e) Clustered heatmaps of single cell copy number profiles for TN1 (n=1100 cells) and TN2 (n=1024 cells). (f-g) Integer copy number states of selected breast cancer genes for each subclone according to clonal, subclonal and unique CNA classes.
Figure 3 –
Figure 3 –. Evolutionary Analysis of Clonal Lineages in TNBC Patients
(a-b) Minimum evolution trees of single cell copy number data for TN1 and TN2, with annotations indicating the time of the WGD events and confidence intervals, as well as the timing of TP53 mutations (c-d) Minimum evolution trees after the MRCA generated using consensus CNA profiles of subclones for TN1 and TN2 and rooted by a neutral node to the MRCA, with common ancestors (A1, A2) in the left panels. Right panels show consensus copy number profile heatmaps of subclones, where the bottom rows represent the inferred MRCA profile and different CNA classes.
Figure 4 –
Figure 4 –. Mathematical Modeling of Transient Instability After Punctuated Copy Number Evolution
Representations of CNA accumulation under (a) gradual evolution after punctuated instability, or (b) transient instability after the punctuated burst. (c) Schematic of the branching model for the chromosome breakpoint accumulation that incorporates cell fitness and cell birth/death rates; replicating cells acquire heritable breakpoints in their copy number profiles with a probability that depends on the tumor size in the transient instability scenario, or is constant under gradual evolution. (d-e) Muller plots of clonal frequencies obtained from (d) stochastic simulations of the gradual accumulation model, and (e) the transient instability model. (f) Maximum likelihood fits for the chromosome breakpoint frequency spectra obtained for TN5 under both scenarios. (g) Difference of AICs for the transient instability and gradual accumulation models from simulated data from a large parameter range; difference of AICs obtained from the single cell patient data shown in red lines.
Figure 5 –
Figure 5 –. Clonal Substructure of TNBC Cell Lines and Single Cell Expansions
(a) UMAP and clustering of single cell copy number data from four TNBC cell lines, including MDA-MB-231 (n = 820 cells), MDA-MB-453 (n = 1260 cells), BT-20 (n = 1231 cells) and MDA-MB-157 (n = 1210 cells), in which contour colors represent superclones and colored points represent subclones. (b-c) Clustered heatmaps of ACT data from the MDA-MB-231 and MDA-MB-453 cell lines (d) Schematic of subcloning experiments for expanding single daughter cells from the parental MDA-MB-231 cell line. (e-f) High-dimensional UMAP clustering of single cell copy number data from two expanded daughter cell populations after 20 cell doublings. (g) Clustered heatmaps of ACT data from the EX1 expanded cells from MDA-MB-231, with CNA classes indicated below.

Comment in

References

    1. Davis A, Gao R & Navin N Tumor evolution: Linear, branching, neutral or punctuated? Biochim Biophys Acta Rev Cancer 1867, 151–161, doi:10.1016/j.bbcan.2017.01.003 (2017). - DOI - PMC - PubMed
    1. Burrell RA, McGranahan N, Bartek J & Swanton C The causes and consequences of genetic heterogeneity in cancer evolution. Nature 501, 338–345, doi:10.1038/nature12625 (2013). - DOI - PubMed
    1. Pfister K et al. Identification of Drivers of Aneuploidy in Breast Tumors. Cell Rep 23, 2758–2769, doi:10.1016/j.celrep.2018.04.102 (2018). - DOI - PMC - PubMed
    1. Xu J, Huang L & Li J DNA aneuploidy and breast cancer: a meta-analysis of 141,163 cases. Oncotarget 7, 60218–60229, doi:10.18632/oncotarget.11130 (2016). - DOI - PMC - PubMed
    1. Gordon DJ, Resio B & Pellman D Causes and consequences of aneuploidy in cancer. Nature reviews. Genetics 13, 189–203, doi:10.1038/nrg3123 (2012). - DOI - PubMed

Methods References

    1. Baslan T et al. Genome-wide copy number analysis of single cells. Nat Protoc 7, 1024–1041, doi:nprot.2012.039 [pii]10.1038/nprot.2012.039 (2012). - DOI - PMC - PubMed
    1. Langmead B & Salzberg SL Fast gapped-read alignment with Bowtie 2. Nat Methods 9, 357–359, doi:10.1038/nmeth.1923 (2012). - DOI - PMC - PubMed
    1. Li H et al. The Sequence Alignment/Map format and SAMtools. Bioinformatics 25, 2078–2079, doi:10.1093/bioinformatics/btp352 (2009). - DOI - PMC - PubMed
    1. Venkatraman ES & Olshen AB A faster circular binary segmentation algorithm for the analysis of array CGH data. Bioinformatics 23, 657–663, doi:10.1093/bioinformatics/btl646 (2007). - DOI - PubMed
    1. Hahsler M, Piekenbrock M & Doran D dbscan: Fast Density-Based Clustering with R. 2019 91, 30, doi:10.18637/jss.v091.i01 (2019). - DOI

Publication types

MeSH terms