. 2021 Apr;592(7854):450-456.
doi: 10.1038/s41586-021-03362-0. Epub 2021 Mar 24.

NASH limits anti-tumour surveillance in immunotherapy-treated HCC

Dominik Pfister  1   2 Nicolás Gonzalo Núñez  3 Roser Pinyol  4 Olivier Govaere  5 Matthias Pinter  6   7 Marta Szydlowska  1 Revant Gupta  8   9 Mengjie Qiu  10 Aleksandra Deczkowska  11 Assaf Weiner  11 Florian Müller  1 Ankit Sinha  12   13 Ekaterina Friebel  3 Thomas Engleitner  14   15   16 Daniela Lenggenhager  17 Anja Moncsek  18 Danijela Heide  1 Kristin Stirm  1 Jan Kosla  1 Eleni Kotsiliti  1 Valentina Leone  1   19 Michael Dudek  20 Suhail Yousuf  10 Donato Inverso  21   22 Indrabahadur Singh  1   23 Ana Teijeiro  24 Florian Castet  4 Carla Montironi  4 Philipp K Haber  25 Dina Tiniakos  5   26 Pierre Bedossa  5 Simon Cockell  27 Ramy Younes  5   28 Michele Vacca  29 Fabio Marra  30 Jörn M Schattenberg  31 Michael Allison  32 Elisabetta Bugianesi  28 Vlad Ratziu  33 Tiziana Pressiani  34 Antonio D'Alessio  34 Nicola Personeni  34   35 Lorenza Rimassa  34   35 Ann K Daly  5 Bernhard Scheiner  6   7 Katharina Pomej  6   7 Martha M Kirstein  36   37 Arndt Vogel  36 Markus Peck-Radosavljevic  38 Florian Hucke  38 Fabian Finkelmeier  39 Oliver Waidmann  39 Jörg Trojan  39 Kornelius Schulze  40 Henning Wege  40 Sandra Koch  41 Arndt Weinmann  41 Marco Bueter  42 Fabian Rössler  42 Alexander Siebenhüner  43 Sara De Dosso  44 Jan-Philipp Mallm  45 Viktor Umansky  46   47 Manfred Jugold  48 Tom Luedde  49 Andrea Schietinger  50   51 Peter Schirmacher  52 Brinda Emu  1 Hellmut G Augustin  21   22 Adrian Billeter  53 Beat Müller-Stich  53 Hiroto Kikuchi  54 Dan G Duda  54 Fabian Kütting  55 Dirk-Thomas Waldschmidt  55 Matthias Philip Ebert  56 Nuh Rahbari  57 Henrik E Mei  58 Axel Ronald Schulz  58 Marc Ringelhan  59   60   61 Nisar Malek  62 Stephan Spahn  62 Michael Bitzer  62 Marina Ruiz de Galarreta  25   63 Amaia Lujambio  25   63   64 Jean-Francois Dufour  65   66 Thomas U Marron  25   67 Ahmed Kaseb  68 Masatoshi Kudo  69 Yi-Hsiang Huang  70   71 Nabil Djouder  24 Katharina Wolter  72   73 Lars Zender  72   73   74 Parice N Marche  75   76 Thomas Decaens  75   76   77 David J Pinato  78   79 Roland Rad  14   15   16 Joachim C Mertens  18 Achim Weber  17   80 Kristian Unger  19 Felix Meissner  12 Susanne Roth  10 Zuzana Macek Jilkova  75   76   78 Manfred Claassen  8   9 Quentin M Anstee  5   81 Ido Amit  11 Percy Knolle  20 Burkhard Becher  3 Josep M Llovet  82   83   84 Mathias Heikenwalder  85
Affiliations

NASH limits anti-tumour surveillance in immunotherapy-treated HCC

Dominik Pfister et al. Nature. 2021 Apr.

Abstract

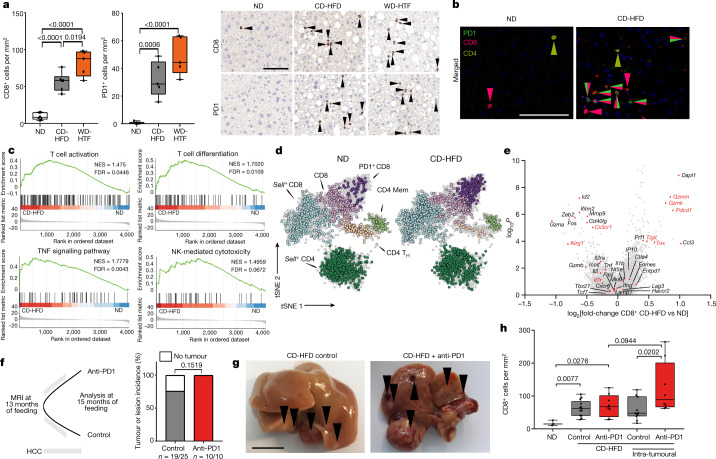
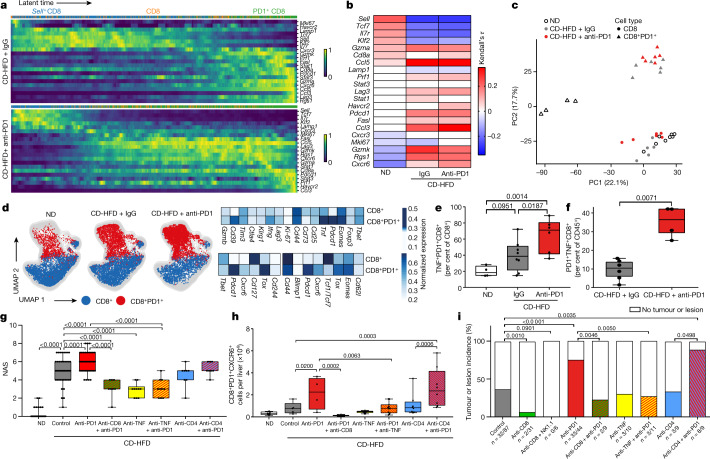
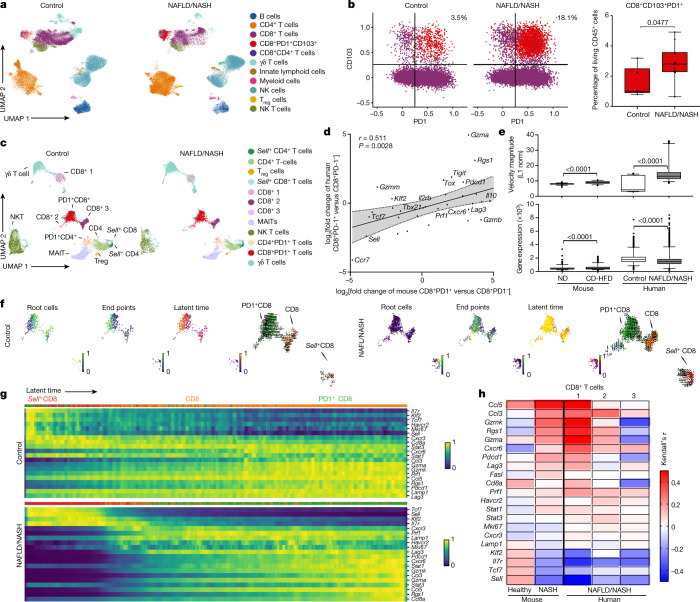
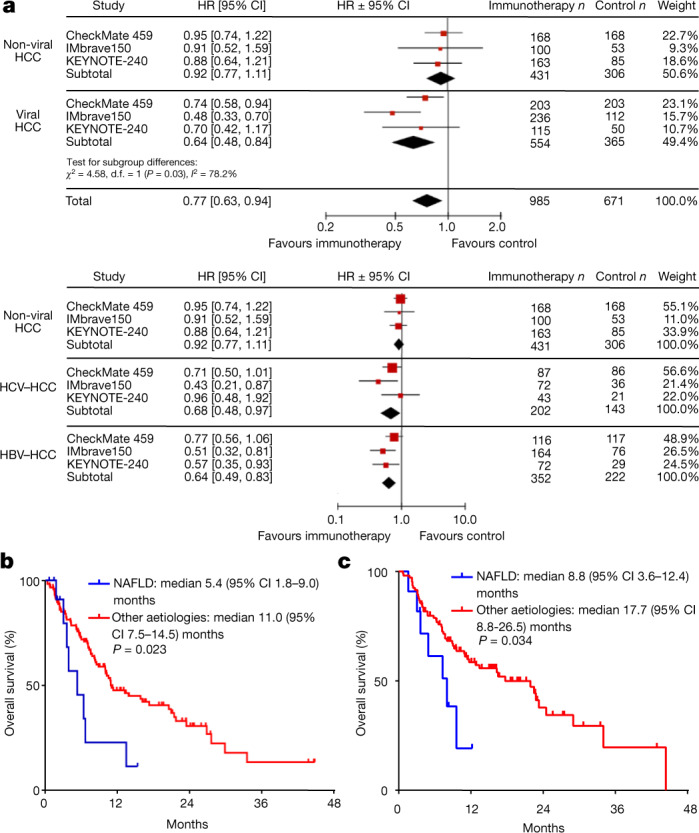
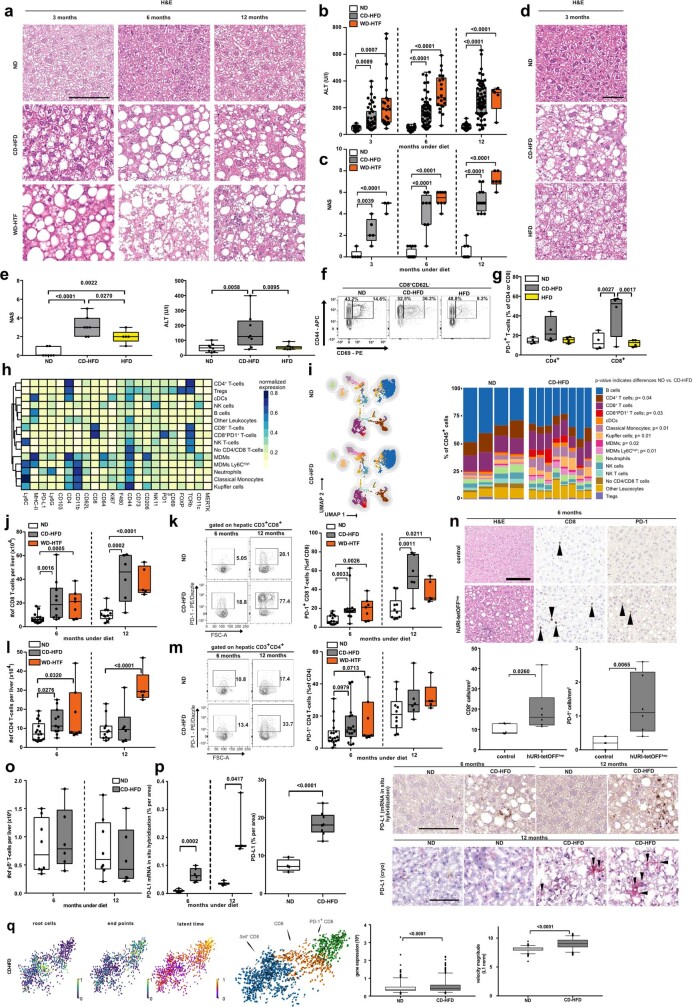
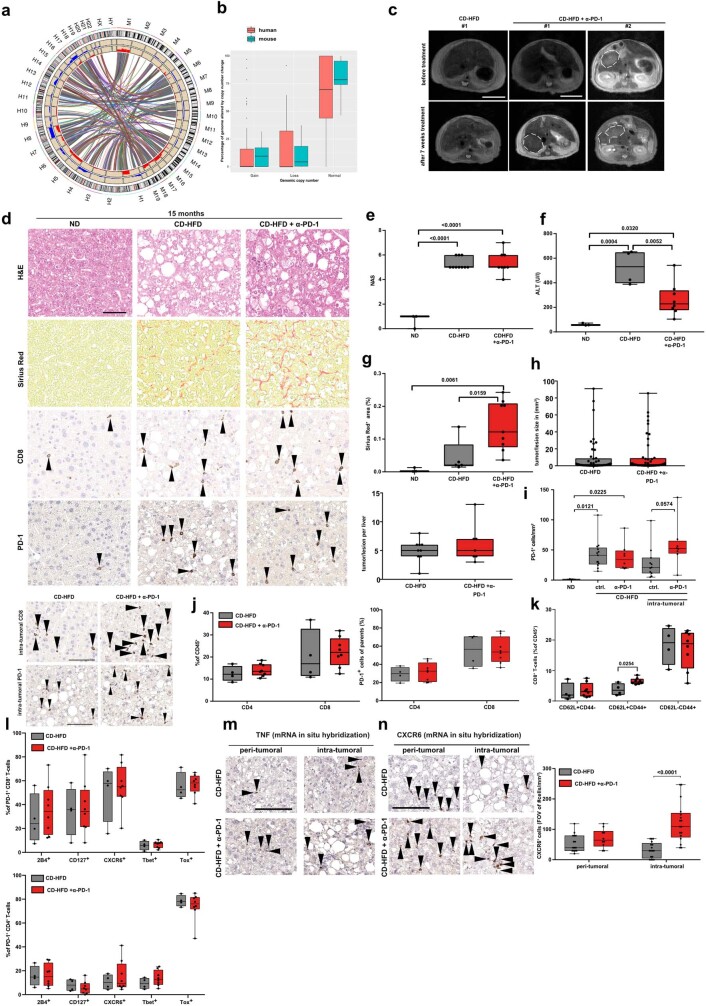
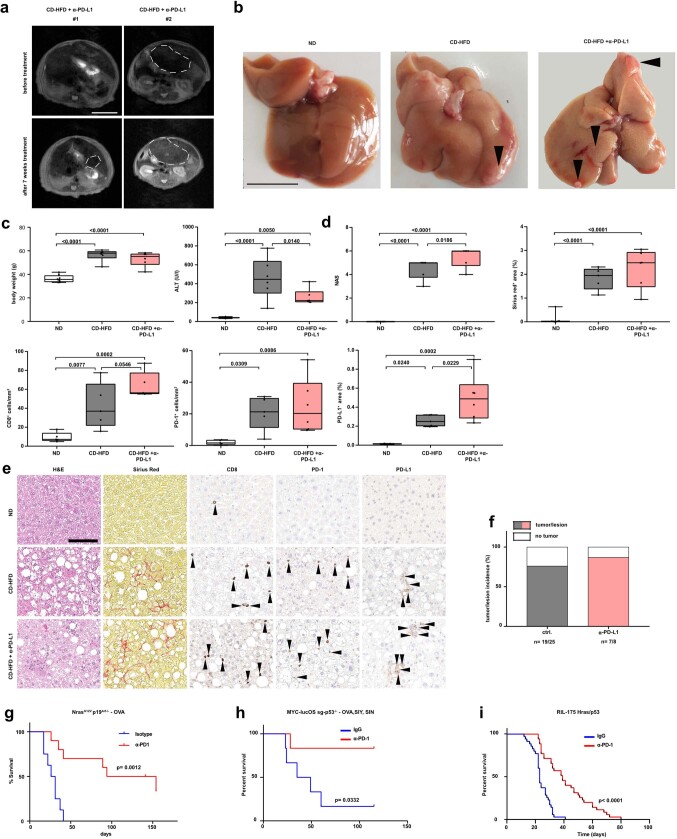
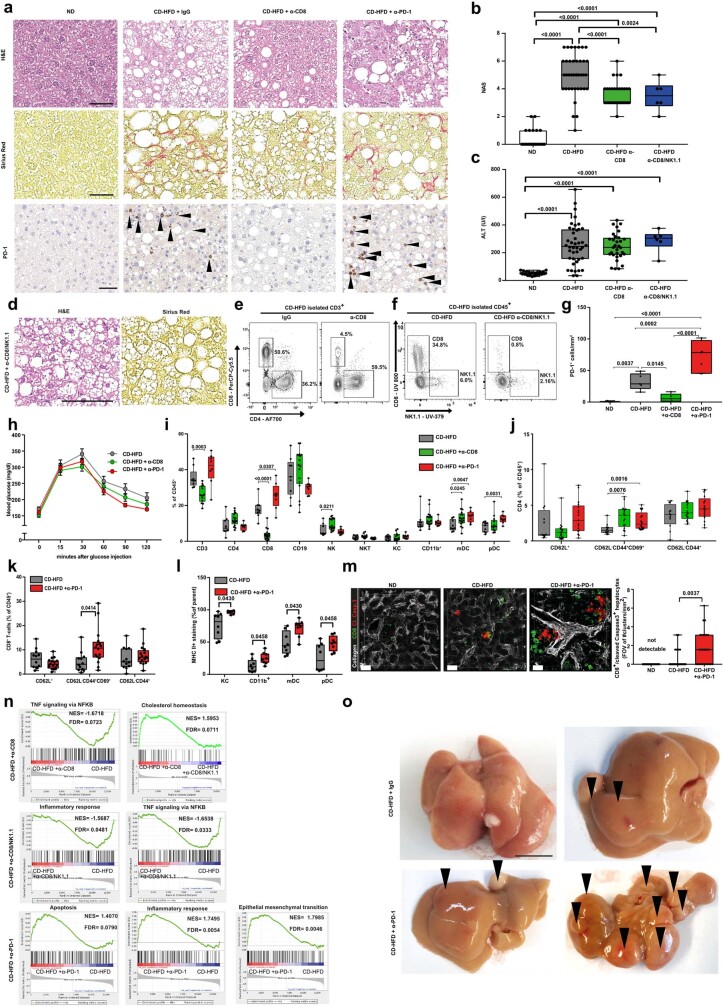
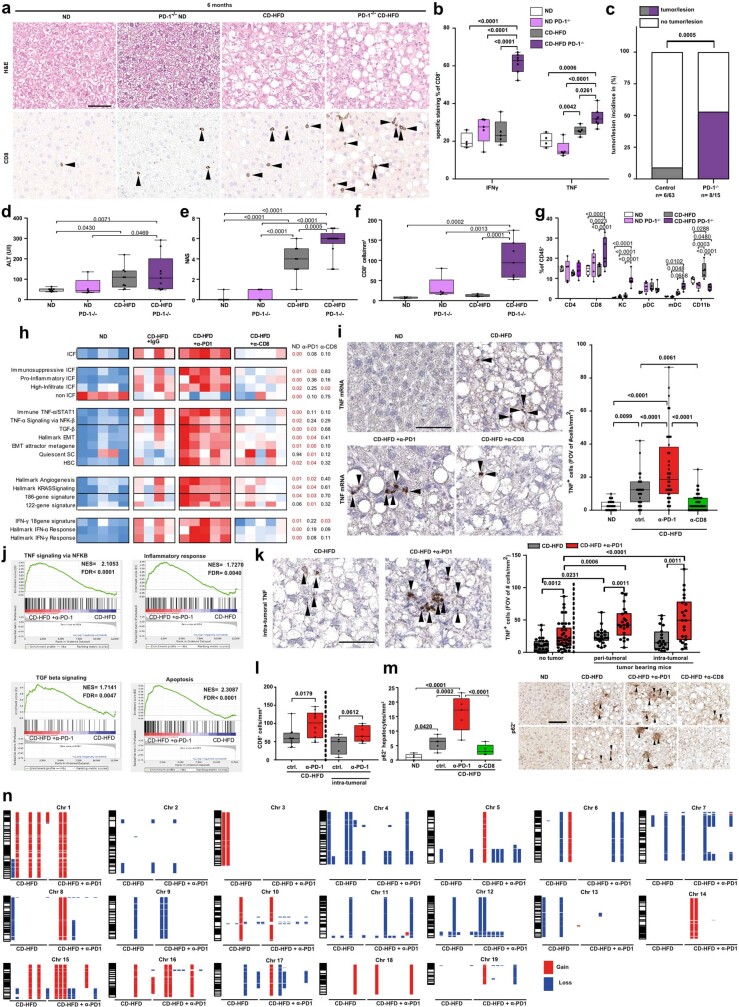
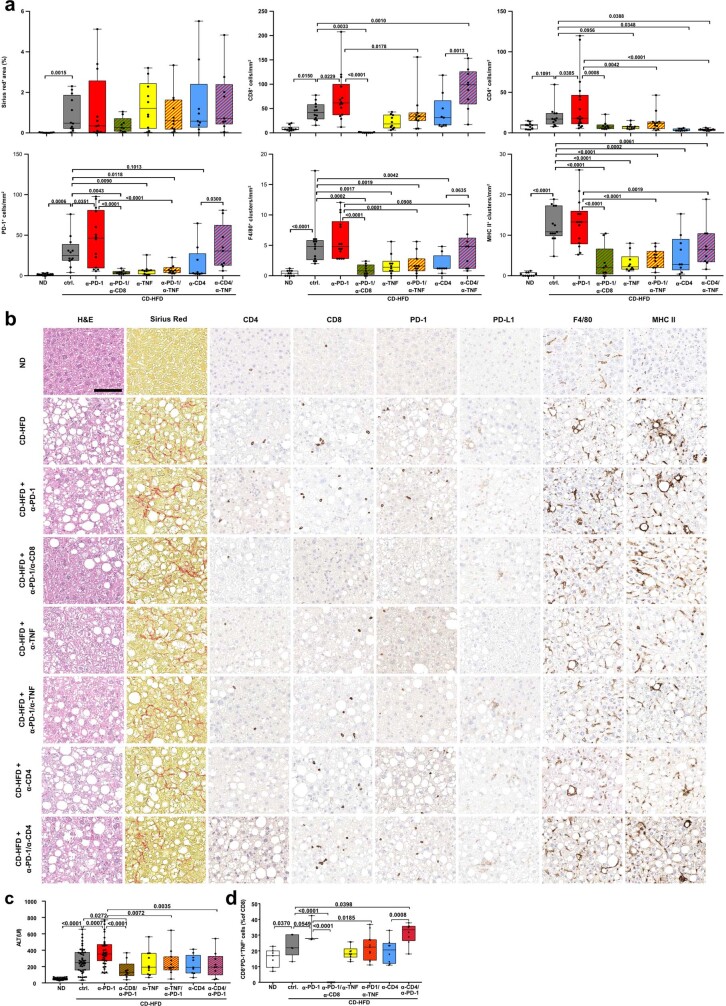
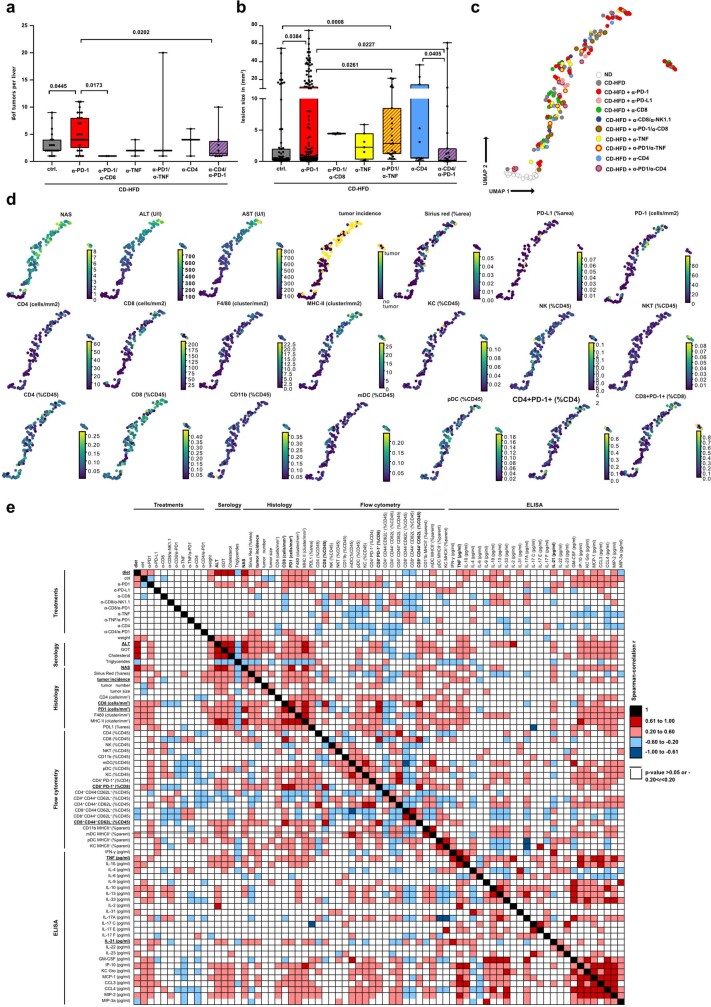
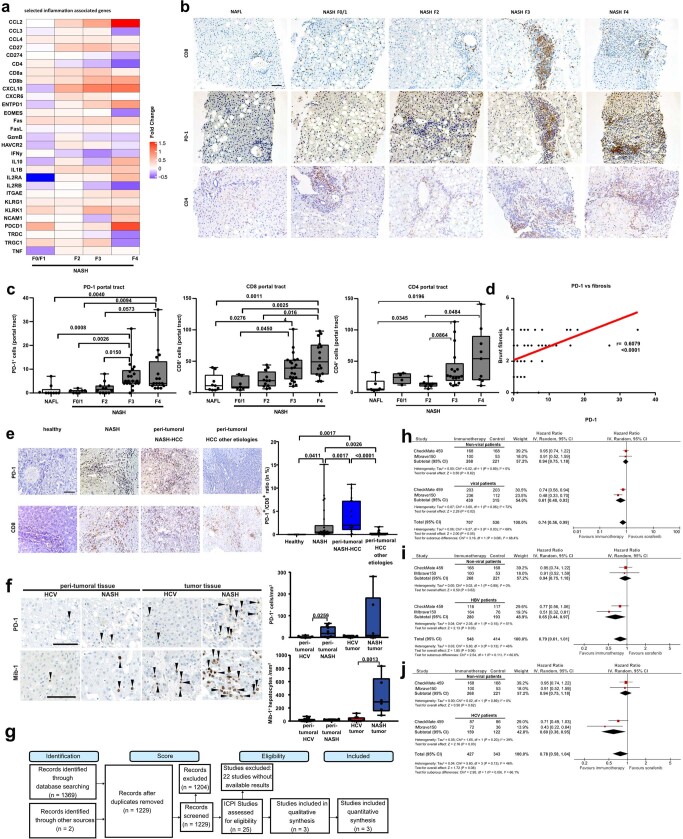
Hepatocellular carcinoma (HCC) can have viral or non-viral causes1-5. Non-alcoholic steatohepatitis (NASH) is an important driver of HCC. Immunotherapy has been approved for treating HCC, but biomarker-based stratification of patients for optimal response to therapy is an unmet need6,7. Here we report the progressive accumulation of exhausted, unconventionally activated CD8+PD1+ T cells in NASH-affected livers. In preclinical models of NASH-induced HCC, therapeutic immunotherapy targeted at programmed death-1 (PD1) expanded activated CD8+PD1+ T cells within tumours but did not lead to tumour regression, which indicates that tumour immune surveillance was impaired. When given prophylactically, anti-PD1 treatment led to an increase in the incidence of NASH-HCC and in the number and size of tumour nodules, which correlated with increased hepatic CD8+PD1+CXCR6+, TOX+, and TNF+ T cells. The increase in HCC triggered by anti-PD1 treatment was prevented by depletion of CD8+ T cells or TNF neutralization, suggesting that CD8+ T cells help to induce NASH-HCC, rather than invigorating or executing immune surveillance. We found similar phenotypic and functional profiles in hepatic CD8+PD1+ T cells from humans with NAFLD or NASH. A meta-analysis of three randomized phase III clinical trials that tested inhibitors of PDL1 (programmed death-ligand 1) or PD1 in more than 1,600 patients with advanced HCC revealed that immune therapy did not improve survival in patients with non-viral HCC. In two additional cohorts, patients with NASH-driven HCC who received anti-PD1 or anti-PDL1 treatment showed reduced overall survival compared to patients with other aetiologies. Collectively, these data show that non-viral HCC, and particularly NASH-HCC, might be less responsive to immunotherapy, probably owing to NASH-related aberrant T cell activation causing tissue damage that leads to impaired immune surveillance. Our data provide a rationale for stratification of patients with HCC according to underlying aetiology in studies of immunotherapy as a primary or adjuvant treatment.


Conflict of interest statement

M.P. is an investigator for Bayer, BMS, Lilly, and Roche; has received speaker honoraria from Bayer, BMS, Eisai, Lilly, and MSD; is a consultant for Bayer, BMS, Eisai, Ipsen, Lilly, MSD, and Roche; and has received travel support from Bayer and BMS. D.P. works currently for Novo Nordisk. M. Szydlowksa works currently for Astra Zeneca. M.K. received honoraria from BMS as consultant and is an investigator for AstraZeneca and BMS. A.V. has served as consultant for Roche, Bayer, Lilly, BMS, Eisai, and Ipsen; has received speaking fees form Roche, Bayer, Lilly, BMS, Eisai, and Ipsen; and is an investigator for Roche, Bayer, Lilly, BMS, Eisai, and Ipsen. F.H. has received travel support from Bayer, Abbvie, and Gilead. M.P.-R. is an advisor/consultant for Astra Zeneca, Bayer, BMS, Eisai, Ipsen, Lilly, and MSD; has served as a speaker for Bayer, Eisai, and Lilly; and is an investigator for Bayer, BMS, Exelixis, and Lilly. F.F. has received travel support from Abbvie and Novartis. O.W. has served as consultant for Amgen, Bayer, BMS, Celgene, Eisai, Merck, Novartis, Roche, Servier, and Shire; has served as a speaker for Abbvie, Bayer, BMS, Celgene, Falk, Ipsen, Novartis, Roche, and Shire; and has received travel support from Abbvie, BMS, Ipsen, Novartis, and Servier. J.T. has served as consultant for Amgen, Bayer, BMS, Eisai, Lilly, Merck Serono, MSD, Ipsen, and Roche; has received travel support from BMS and Ipsen; has received speaking fees from Amgen, Bayer, BMS, Eisai, Lilly, Merck Serono, MSD, Ipsen, and Roche; and is an investigator for Amgen, Bayer, BMS, Eisai, Lilly, Merck Serono, MSD, Ipsen, and Roche. K.S. has served as consultant for Ipsen and Bayer; and conducts studies for Bayer, Roche, Lilly, MSD, and BMS. H.W. has served as speaker for Bayer, Eisai, and Ipsen; has served as a consultant for Bayer, Eisai, Lilly, BMS, Roche, and Ipsen; and conducts studies for Bayer, Roche, Lilly, MSD, and BMS. A. Weberis an advisor for BMS, Wako, Eisai, Roche, and Amgen. J.C.M. has received consulting honoraria from Abbvie, Bayer, BMS, Eisai, Gilead, Incyte, Intercept and MSD for work performed outside the current study. J.M.L. is receiving research support from Bayer HealthCare Pharmaceuticals, Eisai Inc, Bristol-Myers Squibb, Boehringer-Ingelheim and Ipsen, and consulting fees from Eli Lilly, Bayer HealthCare Pharmaceuticals, Bristol-Myers Squibb, Eisai Inc, Celsion Corporation, Exelixis, Merck, Ipsen, Genentech, Roche, Glycotest, Leerink Swann LLC, Fortress Biotech, Nucleix, Can-Fite Biopharma, Sirtex, Mina Alpha Ltd and AstraZeneca. J.M.S. serves as a consultant for Intercept Pharmaceuticals, Genfit, Gilead Sciences, BMS, Madrigal, Novartis, Pfizer, Roche, and Siemens-Healthineers; and has received research funding from Gilead Sciences. D.J.P. has received lecture fees from ViiV Healthcare and Bayer Healthcare; travel expenses from BMS and Bayer Healthcare; consulting fees from Mina Therapeutics, EISAI, Roche and Astra Zeneca; and research funding (to institution) from MSD and BMS. J.-F.D. has served on advisory committees for Abbvie, Bayer, Bristol-Myers Squibb, Falk, Genfit, Genkyotex, Gilead Sciences, HepaRegenix, Intercept, Lilly, Merck, and Novartis; and has spoken or taught at Bayer, Bristol-Myers Squibb, Intercept, Genfit, Gilead Sciences, Novartis, and Roche. L.R. has received consulting fees from Amgen, ArQule, Astra Zeneca, Basilea, Bayer, Celgene, Eisai, Exelixis, Hengrui, Incyte, Ipsen, Lilly, MSD, Nerviano Medical Sciences, Roche, and Sanofi; lectures fees from AbbVie, Amgen, Eisai, Gilead, Incyte, Ipsen, Lilly, Roche, Sanofi; travel expenses from Ipsen; and institutional research funding from Agios, ARMO BioSciences, AstraZeneca, BeiGene, Eisai, Exelixis, Fibrogen, Incyte, Ipsen, Lilly, MSD, and Roche. N.P. has received consulting fees from Amgen, Merck Serono, and Servier; lectures fees from AbbVie, Gilead and Lilly; travel expenses from Amgen and ArQule; and institutional research funding from Basilea, Merck Serono and Servier. T.P. has received institutional research funding from Lilly. D.G.D. has received consultant fees from Bayer, Simcere, Surface Oncology and BMS; and research grants from Bayer, Exelixis and BMS. The remaining authors declare no competing interests.

Figures

Fig. 1
Fig. 1. NASH progression is associated with increased, activated CD8+PD1+ T cells.
a, CD8 and PD1 staining (right) and quantification (left) of T cells from mice fed normal diet (ND), CD-HFD or western-style diet with trans fat (WD-HTF) by immunohistochemistry. b, Immunofluorescence-based detection of PD1 (green), CD8 (red) and CD4 (yellow) cells. Scale bar, 100 μm. c, GSEA of hepatic CD8+PD1+ T cells sorted from TCRβ+ cells by mass spectrometry. FDR, false discovery rate; NES, normalized enrichment score. df, t-distributed stochastic neighbour embedding (tSNE) of TCRβ+ cells (d), differential gene expression by scRNA-seq (e) and scheme for experiment (f): mice were fed CD-HFD for 13 months and then treated with anti-PD1 for 8 weeks before measurement of tumour incidence. Mem, memory CD4 T cells. g, Livers from treated and untreated mice after CD-HFD. Arrowheads, tumours or lesions. Scale bar, 10 mm. h, Quantification of CD8+ cell in liver by immunohistochemistry. Details of sample sizes, biological replicates and statistical tests are given in Methods and Source Data. a, h, P values shown above brackets. Source data
Fig. 2
Fig. 2. Resident-like CD8+PD1+ T cells drive hepatocarcinogenesis in a TNF-dependent manner upon anti-PD1 treatment in NASH.
a, b, RNA-velocity analyses of scRNA-seq data showing expression (a) and correlation of expression (b) along the latent time of selected genes in CD8+ T cells from mice with NASH. Latent time (pseudo-time by RNA velocity): dark colour, start of RNA velocity; yellow, end point of latent time. Kendall’s τ, gene expression along latent time. c, Principal component analysis (PCA) plot of hepatic CD8+ and CD8+PD1+ T cells sorted by mass spectrometry from TCRβ+ cells from mice fed for 12 months with ND, CD-HFD or CD-HFD and treated for 8 weeks with anti-PD1 antibodies. d, e, UMAP representations showing FlowSOM-guided clustering (d, left), heat map showing median marker expression (d, right), and quantification of hepatic CD8+ T cells (e) from mice fed for 12 months with ND or CD-HFD and treated for 8 weeks with IgG or anti-PD1 antibodies. f, Quantification of CellCNN-analysed flow cytometry data for hepatic CD8+ T cells from mice fed for 12 months with CD-HFD and treated for 8 weeks with IgG or anti-PD1 antibodies. g, h, NAS evaluation (g) and quantification of hepatic CD8+PD1+CXCR6+ T cells (h) from mice fed with ND for 12 months or fed with CD-HFD for 12 months and treated for 8 weeks with anti-PD1, anti-PD1 + anti-CD8, anti-TNF, anti-PD1 + anti-TNF, anti-CD4, or anti-PD1 + anti-CD4 antibodies. Kendall’s τ, gene expression along latent time. i, Quantification of tumour incidence in mice as in g, h. Details of sample sizes, biological replicates and statistical tests are given in Methods and Source Data. ei, P values shown above brackets. Source data
Fig. 3
Fig. 3. Hepatic resident-like CD8+PD1+ T cells are increased in livers of patients with NAFLD patients.
a, b, UMAP representation showing the FlowSOM-guided clustering of CD45+ cells (a) and flow cytometry plots (b, left) and quantification (b, right) of CD8+PD1+CD103+ cells derived from hepatic biopsies of healthy individuals or patients with NAFLD or NASH (Supplementary Table 2). Populations in b: violet, CD8+; red, CD8+PD1+CD103+. Treg cells, regulatory T cells. c, UMAP representations and analyses of differential gene expression by scRNA-seq of CD3+ cells from control individuals or patients with NAFLD or NASH. MAITs, mucosal-associated invariant T cells. d, Correlation of significant differentially expressed genes in liver-derived CD8+PD1+ T cells compared to CD8+PD1 T cells from mice fed with CD-HFD for 12 months and patients with NAFLD/NASH. Shading shows 95% CI. eh, Expression (e) and transcriptional activity (f) of velocity analyses of scRNA-seq data, and gene expression (g) and correlation (h) of expression along the latent-time of selected genes along the latent-time of liver-derived CD8+ T cells from patients with NAFLD or NASH in comparison to control or NASH mouse liver-derived CD8+ T cells. Root cells: yellow, root cells; blue, cells furthest from the root by RNA velocity. End points: yellow, end-point cells; blue, cells furthest from defined end-point cells by RNA velocity. Latent time (pseudo-time by RNA velocity): dark colour, start of RNA velocity; yellow, end point of latent time. RNA velocity flow (top): blue cluster, start point; orange cluster, intermediate; green cluster, end point. Arrow indicates cell trajectory. Details of sample sizes, biological replicates and statistical tests are given in Methods and Source Data. b, e, P values shown above brackets. Source data
Fig. 4
Fig. 4. PD1 and PDL1 targeted immunotherapy in advanced HCC has a distinct effect depending on disease aetiology.
a, Meta-analysis of 1,656 patients (Supplementary Table 7). Immunotherapy was initially assessed and then analysed according to disease aetiology: non-viral (NASH and alcohol intake) vs viral (HBV and HCV) (top). Heterogeneity: τ2 = 0.00; χ2 = 0.14, degrees of freedom (d.f.) = 2 (P = 0.93); I2 = 0%. Test for overall effect: Z = 0.87 (P = 0.39). Separate meta-analyses were subsequently performed for each of the three aetiologies: non-viral (NASH and alcohol intake), HCV and HBV (bottom). Heterogeneity: τ2 = 0.03; χ2 = 3.67, d.f. = 2 (P = 0.16); I2 = 46%. Test for overall effect: Z = 3.13 (P = 0.002). Diamonds represent estimated overall effect based on the meta-analysis random effect of all trials. Inverse variance and random effects methods were used to calculate HRs, 95% CIs, P values, and the test for overall effect; calculations were two-sided. b, NAFLD is associated with a worse outcome in patients with HCC treated with PD(L)1-targeted immunotherapy. A total of 130 patients with advanced HCC received PD(L)1-targeted immunotherapy (Supplementary Table 8). c, Validation cohort of patients with HCC treated with PD(L)1-targeted immunotherapy. A total of 118 patients with advanced HCC received PD(L)1-targeted immunotherapy (Supplementary Table 10). b, c, Log-rank test. Details of sample sizes, biological replicates and statistical tests are given in Methods and Source Data. Source data
Extended Data Fig. 1
Extended Data Fig. 1. T cell activation and hepatic abundance correlate with NASH pathology.
ac, Time kinetics of haematoxylin and eosin (H&E) staining of liver tissue (a), ALT (b), and NAS (c) in mice fed ND, CD-HFD, or WD-HTF (n ≥ 5 mice per group). Scale bar, 100 μm. H&E 3 months: ND n = 5 mice; CD-HFD n = 5 mice; WD-HTF n = 3 mice; 6 months: ND n = 16 mice; CD-HFD n = 8 mice; WD-HTF n = 8 mice; 12 months: ND n = 9 mice; CD-HFD n = 12 mice; WD-HTF n = 6 mice; ALT 3 months: ND n = 15 mice; CD-HFD n = 46 mice; WD-HTF n = 23 mice; 6 months: ND n = 46 mice; CD-HFD n = 59 mice; WD-HTF n = 21 mice; 12 months: ND n = 25 mice; CD-HFD n = 69 mice; WD-HTF n = 5 mice; NAS 3 months: ND n = 5 mice; CD-HFD n = 5 mice; WD-HTF n = 3 mice; 6 months: ND n = 16 mice; CD-HFD n = 8 mice; WD-HTF n = 8 mice; 12 months: ND n = 9 mice; CD-HFD n = 12 mice; WD-HTF n = 6 mice. d, e, H&E staining (d) with NAS evaluation by H&E (e, left) and ALT (e, right) of mice fed with ND, HFD or CD-HFD for 3 months. NAS: ND n = 7 mice; CD-HFD n = 7 mice; HFD n = 5 mice; ALT: ND n = 8 mice; CD-HFD n = 8 mice; HFD n = 7 mice. Scale bar, 50 μm. f, g, Representative flow cytometry plots (f) and PD1 expression (g) of hepatic T cells from mice fed for 3 months with ND, HFD or CD-HFD (n = 4 mice per group). h, Heat map showing the median marker expression of the defined CD45+ subsets displayed in i by flow cytometry of cells from mice fed for 12 months with ND or CD-HFD (ND n = 4 mice; CD-HFD n = 8 mice). i, UMAP representation of FlowSOM-guided clustering and quantification of hepatic immune cell composition of mice fed for 12 months with ND or CD-HFD (ND n = 4 mice; CD-HFD n = 8 mice). j, k, Abundance (j), flow cytometry plots (k, left) and PD1 expression (k, right) of hepatic CD8+ T cells from mice fed for 6 or 12 months with ND or CD-HFD (abundance of CD8 6 months: ND n = 17 mice; CD-HFD n = 10 mice; WD-HTF n = 7 mice; 12 months: ND n = 11 mice; CD-HFD n = 6 mice; WD-HTF n = 5 mice; PD1 expression in CD8+ T cells 6 months: ND n = 15 mice; CD-HFD n = 14 mice; WD-HTF n = 7 mice; 12 months: ND n = 10 mice; CD-HFD n = 6 mice; WD-HTF n = 5 mice). l, m, Abundance (l), flow cytometry plots (m, left) and PD1 expression (m, right) of hepatic CD4+ T cells from mice fed for 6 or 12 months with ND or CD-HFD (abundance of CD4 6 months: ND n = 17 mice; CD-HFD n = 10 mice; WD-HTF n = 7 mice; 12 months: ND n = 11 mice; CD-HFD n = 6 mice; WD-HTF n = 5 mice; PD1 expression in CD4+ T cells 6 months: ND n = 15 mice; CD-HFD n = 14 mice; WD-HTF n = 7 mice; 12 months: ND n = 10 mice; CD-HFD n = 6 mice; WD-HTF n = 5 mice). n, H&E, CD8 and PD1 hepatic staining (top), and quantification of CD8+ cells and PD1+ cells by immunohistochemistry (bottom) from 32-week-old hURI-tetOFFhep and non-transgenic littermate control mice (n = 6 mice/group). Arrowheads, specific positive-staining cells. Scale bar, 100 μm. o, Hepatic abundance of TCRγδ T cells from mice fed for 6 or 12 months with ND or CD-HFD (6 months ND n = 8 mice; CD-HFD n = 6 mice; 12 months ND n = 8 mice; CD-HFD n = 6 mice). p, Left, quantification of hepatic Cd274+ expression by mRNA in situ hybridization of mice fed for 6 or 12 months with ND or CD-HFD (6 months: ND n = 6 mice; CD-HFD n = 6 mice; 12 months: ND n = 3 mice; CD-HFD n = 3 mice). Middle, quantification of hepatic PDL1+ expression by immunohistochemistry of mice fed for 12 months with ND or CD-HFD (ND n = 8 mice; CD-HFD n = 6 mice). Right, mRNA in situ hybridization (top) and PD1-stained micrographs (bottom). Scale bars, 100 μm. q, RNA velocity indicating transcriptional activity, gene expression, and the trajectory of CD8+ cells by scRNA-seq from 12 months ND or CD-HFD-fed mice. Root cells: yellow; blue cells: farthest away from root. End points: yellow indicates end point; blue cells: farthest away from defined end point. Latent time: pseudo-time by RNA velocity, dark color: start of velocity, yellow: end point of latent time. RNA velocity flow: Blue cluster: start point; orange cluster: intermediate; green: end point. Arrows: cell trajectory (n=3 mice/group). All data are shown as mean ± s.e.m. a, b, jm, o, p, Two-tailed Student’s t-test. dg, One-way ANOVA and Fisher’s LSD test. i, n, q, Two-tailed Mann–Whitney test. Source data
Extended Data Fig. 2
Extended Data Fig. 2. Anti-PD1 treatment does not achieve anti-tumour effects in NASH-induced tumours.
a, b, Synteny analysis of mouse HCC (a) and quantification of genomic aberrations by array-based comparative genomic hybridization (aCGH) for mice after 12 months on CD-HFD (n = 19) and for human NALFD/NASH–HCC (n = 78). The results here are in whole or part based upon data generated by the TCGA Research Network (https://www.cancer.gov/tcga). c, MRI images of mouse liver after 13 months on CD-HFD followed by 7 weeks with or without treatment with anti-PD1 antibodies (n = 3 mice per group). Dashed outlines indicate tumour nodules. Scale bars, 10 mm. d, Histological staining of hepatic tissue with H&E, Sirius Red, CD8 and PD1 of mice fed for 15 months ND or CD-HFD and either untreated or treated for 8 weeks with anti-PD1 antibodies (H&E: ND n = 3 mice; CD-HFD n = 10 mice; CD-HFD + anti-PD1 n = 8 mice; Sirius Red: ND n = 3 mice; CD-HFD n = 5 mice; CD-HFD + anti-PD1 n = 9 mice; CD8, PD1: ND n = 3 mice; CD-HFD n = 13 mice; CD-HFD + anti-PD1 n = 8 mice). Scale bar, 50 μm. Arrowheads, CD8+ or PD1+ cells. e, NAS evaluation by H&E staining of hepatic tissue from mice fed for 15 months with ND or CD-HFD and either untreated or treated for 8 weeks with anti-PD1 antibodies (ND n = 3 mice; CD-HFD n = 10 mice; CD-HFD + anti-PD1 n = 8 mice). f, ALT levels mice as in e (ND n = 3 mice; CD-HFD n = 4 mice; CD-HFD + anti-PD1 n = 8 mice). g, Quantification of fibrosis by Sirius Red staining of hepatic tissue from mice as in e (ND n = 3 mice; CD-HFD n = 5 mice; CD-HFD + anti-PD1 n = 9 mice). h, Quantification of tumour/lesion size and tumour load in livers from mice as in e (tumour/lesion size and tumour load: CD-HFD n = 9 mice; CD-HFD + anti-PD1 n = 7 mice; tumour incidence: CD-HFD n = 17 tumours/lesions in 22 mice; CD-HFD + anti-PD1 n = 10 tumours/lesions in 10 mice). i, Staining for CD8 and quantification of PD1+ cells in hepatic tissue by immunohistochemistry for mice as in e (ND n = 3 mice; CD-HFD n = 13 mice; CD-HFD + anti-PD1 n = 8 mice; intra-tumoral staining: CD-HFD n = 11 mice; CD-HFD + anti-PD1 n = 8 mice). Scale bar, 100 μm. j, k, Quantification and expression of PD1 in hepatic CD4+ and CD8+ T cells (j) and polarization of CD8+ T cells (k) by flow cytometry for mice fed for 15 months with CD-HFD and either untreated or treated for 8 weeks with anti-PD1 antibodies (CD-HFD n = 4 mice; CD-HFD + anti-PD1 n = 8 mice). l, Quantification of hepatic PD1+ CD4+ and PD1+ CD8+ T cells by flow cytometry for mice as in j (CD-HFD n = 4 mice; CD-HFD + anti-PD1 n = 8 mice). m, n, Expression of Tnf (m) and Cxcr6 (n, left) in hepatic intra-tumoral and peri-tumoral tissue from mice as in j with quantification of Cxcr6-expressing cells (n, right) (quantification of CXCR6: peri-tumoral: CD-HFD n = 15 fields of view (FOV) in 6 tumours from 2 mice; CD-HFD + anti-PD1 n = 10 FOV in 6 tumours from 2 mice; intra-tumoral: CD-HFD n = 17 FOV in 6 tumours from 2 mice; CD-HFD + anti-PD1 n = 17 FOV in 6 tumours from 2 mice). Scale bars, 100 μm. Arrowheads, positive cells. All data are shown as mean ± s.e.m. b, Mann–Whitney test. eg, One-way ANOVA and Fisher’s LSD test. hl, n, Two-tailed Student’s t-test. Source data
Extended Data Fig. 3
Extended Data Fig. 3. Anti-PDL1 treatment does not achieve anti-tumour effects in NASH-induced tumours, but in non-NASH livers PD1-targeted immunotherapy leads to prolonged survival.
a, MRI images of livers of mice after 13 months CD-HFD either untreated or after 7 weeks of treatment with anti-PDL1 antibodies (CD-HFD n = 6 mice; CD-HFD + anti-PDL1 n = 8 mice). Dashed outlines indicate tumour nodules. Scale bar, 10 mm. b, Livers of mice fed with ND or CD-HFD for 13 months and either untreated or treated for 8 weeks with anti-PDL1 antibodies. Arrowheads, tumours or lesions. Scale bar, 10 mm. c, Body weight and ALT of mice as in b (ND n = 8 mice; CD-HFD n = 6 mice; CD-HFD + anti-PDL1 n = 6 mice). d, e, NAS evaluation by H&E, quantification of fibrosis by Sirius Red, and quantification of CD8, PD1 and PDL1 staining of hepatic tissue by immunohistochemistry (d) and corresponding micrographs (e) of mice fed for 13 months with ND or CD-HFD and untreated or treated for 8 weeks with anti-PDL1 antibodies (NAS: ND n = 7 mice; CD-HFD n = 6 mice; CD-HFD + anti-PDL1 n = 6 mice; Sirius Red: ND n = 7 mice; CD-HFD n = 5 mice; CD-HFD + anti-PDL1 n = 6 mice; CD8: ND n = 5 mice; CD-HFD n = 5 mice; CD-HFD + anti-PDL1 n = 5 mice; PD1 and PDL1: ND n = 5 mice; CD-HFD n = 5 mice; CD-HFD + anti-PDL1 n = 6 mice). Scale bar, 100 μm. Arrowheads, positive cells. f, Tumour or lesion incidence in mice fed with CD-HFD for 15 months and untreated or treated for 8 weeks with anti-PDL1 antibodies (CD-HFD n = 19 tumours/lesions in 25 mice; CD-HFD + anti-PDL1 n = 7 tumours/lesions in 8 mice). g, Survival analysis of mice with hydrodynamically delivered NrasG12Vp19Arf−/− liver tumours with OVA as antigen, treated with isotype or anti-PD1 antibodies (control n = 8 mice; anti-PD1 n = 10 mice). h, Survival analysis of a non-NASH model of HCC in which tumours are generated autochthonally in the liver by hydrodynamic injection of genetic elements (OVA, SIY, SIN and MYC-lucOS, in a CRISPR-based vector with tumour suppressor p53 deleted (sg-p53), and a transposase-expressing vector (SB13)). Mice were treated on days 7, 9 and 11 with IgG or anti-PD1 (control n = 6 mice; anti-PD1 n = 6 mice). i, Survival analysis of mice with RIL-175 Hras/P53-mutant hydrodynamically induced liver tumours, treated with IgG or anti-PD1 (n = 35 mice per group). All data are shown as mean ± s.e.m. c, d, One-way ANOVA and Fisher’s LSD test. f, Two-sided Fisher’s exact test. i, Two-tailed Student’s t-test. gi, Two-sided χ2 test. Source data
Extended Data Fig. 4
Extended Data Fig. 4. Preventive anti-PD1 treatment drives hepatocarcinogenesis in a CD8-dependent manner in NASH.
a, Histological staining of hepatic tissue with H&E, Sirius Red and PD1 from mice fed for 12 months with ND or CD-HFD and treated for 8 weeks with IgG, anti-CD8 or anti-PD1 antibodies (H&E: ND n = 24 mice; CD-HFD n = 40 mice; CD-HFD + anti-CD8 n = 29 mice; CD-HFD + anti-PD1 n = 36 mice; Sirius Red: ND n = 19 mice; CD-HFD n = 53 mice; CD-HFD + anti-CD8 n = 24 mice; CD-HFD + anti-PD1 n = 33 mice; PD1: ND n = 5 mice; CD-HFD n = 5 mice; CD-HFD + anti-CD8 n = 5 mice; CD-HFD + anti-PD1 n = 7 mice). Arrowheads, PD1+ cells. Scale bars, 50 μm. bd, NAS evaluation by H&E (b), ALT levels (c) and histological staining of hepatic tissue by H&E and Sirius Red (d) of mice fed for 12 months with ND or CD-HFD, and untreated or treated for 8 weeks with anti-CD8 or anti-CD8 + anti-NK1.1 antibodies (fibrosis ND n = 19 mice; CD-HFD n = 53 mice; CD-HFD + anti-CD8 n = 27 mice; CD-HFD + anti-CD8/NK1.1 n = 6 mice; NAS: ND n = 24 mice; CD-HFD n = 40 mice; CD-HFD + anti-CD8 n = 29 mice; CD-HFD + anti-CD8/NK1.1 n = 6; ALT: ND n = 22 mice; CD-HFD n = 42 mice; CD-HFD + anti-CD8 n = 31 mice; CD-HFD + anti-CD8/NK1.1 n = 6). Scale bar, 100 μm. e, f, Flow cytometry plots of hepatic cells from mice fed for 12 months with ND or CD-HFD and treated for 8 weeks with anti-CD8 (e) or anti-CD8 + anti-NK1.1 (f) antibodies. g, Quantification by immunohistochemistry of PD1+ cells in hepatic tissue from mice fed for 12 months with ND or CD-HFD and untreated or treated for 8 weeks treatment with anti-CD8 or anti-PD1 antibodies (ND n = 5 mice; CD-HFD n = 5 mice; CD-HFD + anti-CD8 n = 5 mice; CD-HFD + anti-PD1 n = 7 mice). h, Assessment of metabolic tolerance by intraperitoneal glucose tolerance test of mice as in g (CD-HFD n = 8 mice; CD-HFD + anti-CD8 n = 10 mice; CD-HFD + anti-PD1 n = 9 mice). i, Relative quantification of hepatic leukocytes of mice as in g (CD3, NK T: CD-HFD n = 9 mice; CD-HFD + anti-CD8 n = 14 mice; CD-HFD + anti-PD1 n = 8 mice; CD4, CD8, CD19, NK, CD11b+, mDC: CD-HFD n = 9 mice; CD-HFD + anti-CD8 n = 17 mice; CD-HFD + anti-PD1 n = 8 mice; pDC: CD-HFD n = 9 mice; CD-HFD + anti-CD8 n = 13 mice; CD-HFD + anti-PD1 n = 8 mice; Kupffer cells (KC): CD-HFD n = 9 mice; CD-HFD + anti-CD8 n = 12 mice; CD-HFD + anti-PD1 n = 8 mice). More MHCII+ myeloid cells were found in the respective sub-populations. j, Flow cytometry analysis for polarization of hepatic CD4+ T cells from mice as in g (CD-HFD n = 12 mice; CD-HFD + anti-CD8 n = 17 mice; CD-HFD + anti-PD1 n = 17 mice). k, Flow cytometric analysis for polarization of hepatic myeloid cells of mice fed for 12 months with CD-HFD and untreated or treated for 8 weeks with anti-PD1 antibodies (CD-HFD n = 8 mice; anti-PD1 + CD-HFD n = 12 mice). l, Flow cytometric analysis for polarization of hepatic CD8+ T cells from mice as in k (CD-HFD n = 10 mice; anti-PD1 + CD-HFD n = 14 mice). m, Confocal analyses revealed clusters of CD8+ T cells with adjacent cleaved caspase 3+ hepatocytes that were strongly increased by anti-PD1-related immunotherapy in liver tissue from mice fed for 12 months with ND or CD-HFD and treated for 8 weeks with IgG or anti-PD1 antibodies, suggesting increased necro-inflammation in the vicinity of CD8+ T cells (n = 27 FOV in 3 mice per group). Scale bars, 30 μm. n, GSEA of RNA-seq data for hepatic tissue from mice fed for 12 months with CD-HFD and treated for 8 weeks with anti-CD8, anti-CD8 + anti-NK1.1 or anti-PD1 antibodies (n = 5 mice per group) revealed enrichment for TNF signalling via NF-κB and inflammatory responses. Deletion of NK1.1+ cells altered the cholesterol homeostasis-related signature, suggesting a link between NK T cells and aberrant cholesterol metabolism. Moreover, tissue from mice treated with anti-PD1 antibodies revealed positive enrichment of apoptosis, inflammatory responses and epithelial–mesenchymal transition, indicating a pro-inflammatory, pro-carcinogenic liver environment upon anti-PD1 treatment. o, Livers from mice fed for 12 months with CD-HFD and treated for 8 weeks with IgG or anti-PD1 antibodies. Arrowheads, tumours or lesions. Scale bar, 10 mm. All data are shown as mean ± s.e.m. b, c, One-way ANOVA and Fisher’s LSD test. h, Two-way ANOVA and Sidak’s multiple comparison test. il, Two-tailed Student’s t-test. m, Two-tailed Mann–Whitney test. Source data
Extended Data Fig. 5
Extended Data Fig. 5. Anti-PD1 treatment drives hepatocarcinogenesis by enhancing an inflammatory and pro-tumorigenic liver microenvironment.
a, Histological staining with H&E and CD8 of hepatic tissue from wild-type or Pdcd1−/− mice fed for 6 months with ND or CD-HFD (H&E: ND n = 8 mice; Pdcd1−/− ND n = 5 mice; CD-HFD n = 9 mice; Pdcd1−/− CD-HFD n = 13 mice; CD8: ND n = 4 mice; CD-HFD n = 5 mice; Pdcd1−/− CD-HFD n = 7 mice). Arrowheads, CD8+ cells. Scale bar, 50 μm. b, Cytokine expression of hepatic CD8+ T cells from mice as in a (ND n = 4 mice; Pdcd1−/− ND n = 5 mice; CD-HFD n = 5 mice; Pdcd1−/− CD-HFD n = 6 mice). c, Tumour or lesion incidence in wild-type or Pdcd1−/− mice fed for 6 months with CD-HFD (CD-HFD n = 6 tumours/lesions in 63 mice; Pdcd1−/− CD-HFD n = 6 tumours/lesions in 13 mice). d, ALT levels for mice as in a (ND n = 9 mice; Pdcd1−/− ND n = 5 mice; CD-HFD n = 9 mice; Pdcd1−/− CD-HFD n = 10 mice). e, NAS evaluation by H&E of mice as in a (ND n = 8 mice; Pdcd1−/− ND n = 5 mice; CD-HFD n = 9 mice; Pdcd1−/− CD-HFD n = 13 mice). f, Quantification of CD8+ cells in hepatic tissue by immunohistochemistry of mice as in a (ND n = 4 mice; Pdcd1−/− ND n = 5 mice; CD-HFD n = 5 mice; Pdcd1−/− CD-HFD n = 7 mice). g, Relative quantification of hepatic leukocytes in mice as in a (ND n = 4 mice; Pdcd1−/− ND n = 5 mice; CD-HFD n = 5 mice; Pdcd1−/− CD-HFD n = 6 mice). h, Immune cancer field (ICF) and ICF patterns of RNA-seq data for hepatic tissue from mice fed for 12 months with ND or CD-HFD and treated for 8 weeks treatment with IgG, anti-PD1 or anti-CD8 antibodies (ND, CD-HFD + anti-PD1, CD-HFD + anti-CD8 n = 5 mice per group; CD-HFD n = 4 mice) through single-sample GSEA. i, mRNA in situ hybridization (left) and quantification (right) for hepatic TNF+ cells from mice as in h (ND n = 25 FOV in 3 mice; CD-HFD n = 27 FOV in 3 mice; CD-HFD + anti-PD1 n = 40 FOV in 3 mice; CD-HFD + anti-CD8 n = 55 FOV in 3 mice). Arrowheads, TNF+ cells. Scale bar, 20 μm. j, GSEA of RNA-seq data for hepatic tissue comparing tumour-bearing mice fed for 12 months with CD-HFD and untreated or treated for 8 weeks with anti-PD1 antibodies (n = 5 mice per group). k, mRNA in situ hybridization (left) and quantification (right) for hepatic TNF+ cells from mice fed for 12 months with CD-HFD and untreated or treated for 8 weeks with anti-PD1 antibodies, with or without tumours (without tumours: CD-HFD n = 30 FOV in 3 mice; CD-HFD + anti-PD1 n = 40 FOV in 3 mice; peri-tumoural: CD-HFD n = 20 FOV in 3 mice; CD-HFD + anti-PD1 n = 21 FOV in 3 mice; intra-tumoural: CD-HFD n = 19 FOV in 3 mice; CD-HFD + anti-PD1 n = 22 FOV in 3 mice). Arrowheads, TNF+ cells. Scale bar, 20 μm. l, Quantification of CD8 staining by immunohistochemistry of peri- and intra-tumoural hepatic tissue from mice fed for 12 months with CD-HFD and untreated or treated for 8 weeks with anti-PD1 antibodies (peri-tumoural: CD-HFD n = 11 mice; CD-HFD + anti-PD1 n = 10 mice; intra-tumoural: CD-HFD n = 5 mice; CD-HFD + anti-PD1 n = 7 mice). m, Histological staining for p62 (right) and quantification (left) of liver tumour tissue from mice fed for 12 months with ND or CD-HFD and untreated or treated for 8 weeks with anti-PD1 antibodies or anti-CD8 antibodies (n = 5 mice per group). Scale bar, 100 μm. n, Genomic aberrations by array comparative genomic hybridization (aCGH) of tumour tissue from mice fed for 12 months with CD-HFD and untreated (n = 9) or treated for 8 weeks with anti-PD1 antibodies (n = 12). All data are shown as mean ± s.e.m. b, di, m, One-way ANOVA and Fisher’s LSD test. c, Two-sided Fisher’s exact test. k, l, Two-tailed Student’s t-test. Source data
Extended Data Fig. 6
Extended Data Fig. 6. CD8+PD1+ TOXhigh T cells with a resident-like character are enriched and are cellular drivers of hepatic necroinflammation and increased hepatocarcinogenesis upon anti-PD1 treatment in mice with NASH.
ac, scRNA-seq analysis of hepatic TCRβ+ cells (a), expression of selected markers in hepatic CD8+ T cells by scRNA-seq comparing CD8+ with CD8+PD1+ T cells (b), and average UMI comparison (c) of hepatic CD8+PD1+ T cells from mice fed for 12 months with CD-HFD and treated for 8 weeks with IgG, anti-PD1 antibodies or anti-CD8 antibodies (n = 3 mice per group). d, Velocity analyses on scRNA-seq data from CD8+ cells from mice fed for 12 months with ND or CD-HFD and treated for 8 weeks with anti-PD1 antibodies (n = 3 mice). Yellow, root cells; yellow; blue, farthest from root. End points: yellow, end point cells; blue, farthest from defined end point. RNA velocity flow: blue cluster, start point; orange cluster, intermediate; green cluster, end point. Arrow shows trajectory of cells. e, Velocity analyses of scRNA-seq data showing correlation of expression of selected genes along the latent time of ND-fed mice (n = 3 mice). Latent time (pseudo-time by RNA velocity): dark colour, start of RNA velocity; yellow, end point of latent time. f, RNA velocity analyses by scRNA-seq indicating transcriptional activity and gene expression of CD8+ cells from mice fed for 12 months with ND or CD-HFD and untreated or treated for 8 weeks with anti-PD1 antibodies (n = 3 mice per group). g, Expression of selected markers in hepatic CD8+PD1+ T cells sorted from TCRβ+ cells by mass spectrometry from mice fed for 12 months with CD-HFD and untreated or treated for 8 weeks with anti-PD1 antibodies (n = 6 mice per group). h, Analyses of CD4+ and CD4+PD1+ T cells derived from livers of NASH mice with or without anti-PD1 treatment indicate minor differences in expression of selected markers in hepatic CD4+ T cells sorted from TCRβ+ cells by scRNA-seq comparing CD4+ with CD4+PD1+ T cells from mice fed for 12 months with CD-HFD and treated for 8 weeks with IgG, anti-PD1 or anti-CD8 antibodies (n = 3 mice per group). i, Comparison of average UMIs for hepatic CD4+ T cells from mice fed for 12 months with CD-HFD and treated for 8 weeks with IgG or anti-PD1 antibodies (n = 3 mice per group). j, Quantification of manual gating (left) and flow cytometry plots (right) for hepatic CD8+PD1+TNF+ cell abundance in mice as in i (CD-HFD n = 8 mice; CD-HFD + anti-PD1 n = 6 mice). k, CellCNN-analysed flow cytometry data for hepatic CD8+ T cells from mice as in i (CD-HFD + IgG n = 6 mice; CD-HFD + anti-PD1 n = 4 mice). l, Immunofluorescence staining for PD1, CD8 and Ki-67 of liver tissue from mice fed for 12 months with ND or CD-HFD and treated for 8 weeks with IgG or anti-PD1 antibodies (n = 2 mice per group). Scale bar, 100 μm. m, In vitro stimulated splenic CD8 T cells from C57Bl/6 mice were treated with anti-PD1 antibody for 72 h. Cell count (left), n = 5 experiments per group; Ki-67 (right), n = 4 experiments per group. np, Quantification of intracellular FOXO1 (n), calcium levels (o), and polarization (p) in CD8+ T cells isolated by flow cytometry from mice fed for 12 months with ND or CD-HFD and untreated or treated for 8 weeks with anti-PD1 antibodies (FOXO1: ND n = 6 mice; CD-HFD n = 5 mice; CD-HFD + anti-PD1 n = 7 mice; calcium: ND n = 13 mice; CD-HFD n = 10 mice; CD-HFD + anti-PD1 n = 10 mice; polarization: ND n = 6 mice; CD-HFD n = 5 mice; CD-HFD + anti-PD1 n = 6 mice). q, Relative quantification by flow cytometry of hepatic CD8+PD1+ cells from mice as in n (ND n = 6 mice; CD-HFD n = 5 mice; CD-HFD + anti-PD1 n = 6 mice). rt, Quantification of intracellular calcium (r), FOXO1 (s) and polarization (t) in CD4+ T cells isolated by flow cytometry from mice as in n (FOXO1: ND n = 6 mice; CD-HFD n = 5 mice; CD-HFD + anti-PD1 n = 7 mice; calcium: ND n = 13 mice; CD-HFD n = 10 mice; CD-HFD + anti-PD1 n = 10 mice; polarization: ND n = 6 mice; CD-HFD n = 5 mice; CD-HFD + anti-PD1 n = 6 mice). u, Relative quantification by flow cytometry of hepatic CD4+PD1+ T cells from mice as in n (ND n = 6 mice; CD-HFD n = 5 mice; CD-HFD + anti-PD1 n = 6 mice). All data are shown as mean ± s.e.m. f, Two-tailed Mann–Whitney test. j, m, Two-tailed Student’s t-test. nu, Two-way ANOVA and Fisher’s LSD test. Source data
Extended Data Fig. 7
Extended Data Fig. 7. CD8+ T cells drive hepatic inflammation and subsequent liver cancer in a TNF-dependent manner upon PD1-targeted immunotherapy.
a, b, Histological evaluation (a) and representative micrographs (b) of Sirius Red, CD4, CD8, PD1, PDL1, F4/80, and MHC-II staining of mice fed for 12months with ND or CD-HFD and untreated or treated for 8 weeks with anti-PD1, anti-PD1 + anti-CD8, anti-TNF, anti-PD1 + anti-TNF, anti-CD4 or anti-PD1 + anti-CD4 antibodies (Sirius Red: ND n = 11 mice; CD-HFD n = 12 mice; CD-HFD + anti-PD1 n = 12 mice; CD-HFD + anti-PD1 + anti-CD8 n = 9 mice; CD-HFD + anti-TNF n = 10 mice; CD-HFD + anti-PD1 + anti-TNF n = 11 mice; CD-HFD + anti-CD4 n = 8 mice; CD-HFD + anti-PD1 + anti-CD4 n = 8 mice; CD4: ND n = 10 mice; CD-HFD n = 11 mice; CD-HFD + anti-PD1 n = 14 mice; CD-HFD + anti-PD1 + anti-CD8 n = 9 mice; CD-HFD + anti-TNF n = 10 mice; CD-HFD + anti-PD1 + anti-TNF n = 11 mice; CD-HFD + anti-CD4 n = 8 mice; CD-HFD + anti-PD1 + anti-CD4 n = 8 mice; CD8: ND n = 10 mice; CD-HFD n = 12 mice; CD-HFD + anti-PD1 n = 14 mice; CD-HFD + anti-PD1 n = 14 mice; CD-HFD + anti-PD1 + anti-CD8 n = 9 mice; CD-HFD + anti-TNF n = 10 mice; CD-HFD + anti-PD1 + anti-TNF n = 11 mice; CD-HFD + anti-CD4 n = 8 mice; CD-HFD + anti-PD1 + anti-CD4 n = 8 mice; PD1: ND n = 12 mice; CD-HFD n = 12 mice; CD-HFD + anti-PD1 n = 14 mice; CD-HFD + anti-PD1 + anti-CD8 n = 8 mice; CD-HFD + anti-TNF n = 10 mice; CD-HFD + anti-PD1 + anti-TNF n = 10 mice; CD-HFD + anti-CD4 n = 8 mice; CD-HFD + anti-PD1 + anti-CD4 n = 8 mice; PDL1: ND n = 10 mice; CD-HFD n = 11 mice; CD-HFD + anti-PD1 n = 14 mice; CD-HFD + anti-PD1 + anti-CD8 n = 9 mice; CD-HFD + anti-TNF n = 10 mice; CD-HFD + anti-PD1 + anti-TNF n = 11 mice; CD-HFD + anti-CD4 n = 8 mice; CD-HFD + anti-PD1 + anti-CD4 n = 8 mice; F4/80: ND n = 11 mice; CD-HFD n = 12 mice; CD-HFD + anti-PD1 n = 14 mice; CD-HFD + anti-PD1 n = 14 mice; CD-HFD + anti-PD1 + anti-CD8 n = 9 mice; CD-HFD + anti-TNF n = 10 mice; CD-HFD + anti-PD1 + anti-TNF n = 11 mice; CD-HFD + anti-CD4 n = 8 mice; CD-HFD + anti-PD1 + anti-CD4 n = 8 mice; MHC-II: ND n = 11 mice; CD-HFD n = 13 mice; CD-HFD + anti-PD1 n = 14 mice; CD-HFD + anti-PD1 n = 14 mice; CD-HFD + anti-PD1 + anti-CD8 n = 9 mice; CD-HFD + anti-TNF n = 10 mice; CD-HFD + anti-PD1 + anti-TNF n = 11 mice CD-HFD + anti-CD4 n = 8 mice; CD-HFD + anti-PD1 + anti-CD4 n = 8 mice). Scale bar, 100 μm. c, d, ALT (c) and quantification (d) of hepatic CD8+PD-1+TNF+ T cells from mice fed for 12 months with ND or CD-HFD and untreated or treated for 8 weeks with anti-PD-1, anti-PD-1 + anti-CD8, anti-TNF, anti-PD-1 + anti-TNF, anti-CD4, or anti-PD-1 + anti-CD4 antibodies (ALT: ND n = 30 mice; CD-HFD n = 47 mice; CD-HFD + anti-PD-1 n = 35 mice; CD-HFD + anti-PD-1 + anti-CD8 n = 9 mice; CD-HFD + anti-TNF n = 10 mice; CD-HFD + anti-PD-1 + anti-TNF n = 11 mice; CD-HFD + anti-CD4 n = 8 mice; CD-HFD + anti-PD-1 + anti-CD4 n = 8 mice; CD8+PD-1+TNF+: ND n = 8 mice; CD-HFD n = 5 mice; CD-HFD + anti-PD-1 n = 3 mice; CD-HFD + anti-PD-1 + anti-CD8 n = 9 mice; CD-HFD + anti-TNF n = 10 mice; CD-HFD + anti-PD-1 + anti-TNF n = 11 mice; CD-HFD + anti-CD4 n = 8 mice; CD-HFD + anti-PD-1 + anti-CD4 n = 8 mice). All data are shown as mean ± s.e.m. All data were analysed by one-way ANOVA and Fisher’s LSD test. Source data
Extended Data Fig. 8
Extended Data Fig. 8. PD1-targeted immunotherapy induces hepatic inflammation, which drives hepatocarcinogenesis in a CD8+ T cell-dependent manner.
a, b, Tumour or lesion load (a) and tumour or lesion size (b) in mice fed for 12 months with CD-HFD and untreated or treated for 8 weeks with anti-PD1, anti-PD1 + anti-CD8, anti-TNF, anti-PD1 + anti-TNF, anti-CD4, or anti-PD1 + anti-CD4 antibodies (CD-HFD n = 19 mice; CD-HFD + anti-PD1 n = 29 mice; CD-HFD + anti-PD1 + anti-CD8 n = 2 mice; CD-HFD + anti-TNF n = 3 mice; CD-HFD + anti-PD1 + anti-TNF n = 3 mice; CD-HFD + anti-CD4 n = 3 mice; CD-HFD + anti-PD1 + anti-CD4 n = 8 mice). c, d, UMAP representation of 63 parameters (serology, flow cytometry, histology) (c) and selected displays of analysed parameters (d) indicating the severity of NASH pathology in mice fed for 12 months with ND or CD-HFD and untreated or treated for 8 weeks with anti-CD8, anti-CD8 + anti-NK1.1, anti-PD1, anti-PD1 + anti-CD8, anti-TNF, anti-PD1 + anti-TNF, anti-CD4, or anti-PD1 + anti-CD4 antibodies (ND n = 22 mice; CD-HFD n = 31 mice; CD-HFD + anti-PD1 n = 41 mice; CD-HFD + anti-PDL1 n = 6 mice; CD-HFD + anti-CD8 n = 24 mice; CD-HFD + anti-CD8 + anti-NK1.1 n = 6 mice; CD-HFD + anti-PD1 + anti-CD8 n = 9 mice; CD-HFD + anti-TNF n = 10 mice; CD-HFD + anti-PD1 + anti-TNF n = 11 mice; CD-HFD + anti-CD4 n = 9 mice; CD-HFD + anti-PD1 + anti-CD4 n = 9 mice). e, Data gathered from hepatic tissue analyses were binary correlated with one another for mice fed for 6 or 12 months with ND or CD-HFD and treated for 8 weeks with anti-CD8, anti-CD8 + anti-NK1.1, anti-PD1, anti-PD1 + anti-CD8, anti-TNF, anti-PD1 + anti-TNF, anti-CD4, or anti-PD1 + anti-CD4 antibodies (ND n = 47 mice; CD-HFD n = 72 mice; CD-HFD + anti-PD1 n = 41 mice; CD-HFD + anti-PDL1 n = 6 mice; CD-HFD + anti-CD8 n = 29 mice; CD-HFD + anti-CD8 + NK1.1 n = 6 mice; CD-HFD + anti-PD1 + anti-CD8 n = 9 mice; CD-HFD + anti-TNF n = 10 mice; CD-HFD + anti-PD1 + anti-TNF n = 11 mice; CD-HFD + anti-CD4 n = 9 mice; CD-HFD + anti-PD1 + anti-CD4 n = 9 mice). All data are shown as mean ± s.e.m. a, b, One-way ANOVA and Dunn’s multiple comparison test. e, Two-tailed Spearman’s correlation. Source data
Extended Data Fig. 9
Extended Data Fig. 9. An inflammatory cellular polarization of T cells can be found in liver biopsies from patients with NAFLD or NASH.
a, b, Flow cytometry plots and quantification of patient-liver-derived PD1+CD8+ T cells (a), and correlation of PD1+CD8+ T cells with BMI, NAS and ALT for healthy participants and patients with NAFLD or NASH (b) (Supplementary Table 1; healthy controls n = 8; NAFLD/NASH n = 16 patients). ce, Flow cytometry plot of FMO control (c), quantification of patient-liver-derived PD1+CD8+ T cells (d), and quantification of CD4, CD8, γδ, NK and NK T cells from healthy participants or patients with NAFLD or NASH (e) (Supplementary Table 1: healthy controls n = 8; NAFLD/NASH n = 16 patients). f, g, Heat map showing median marker expression (f) and quantification of the defined CD45+ subsets from Fig. 3c (g) by flow cytometry derived from hepatic biopsies from control participants and patients with NAFLD or NASH to define distinct marker expression (Supplementary Table 2: control individuals n = 6; NAFLD/NASH n = 11 patients). hj, HSNE representation of defined T cell subsets (h), marker expression (i) and quantification of CD8+CD103+PD1+ cells (j) in liver-derived T cells from control individuals and patients with NAFLD or NASH analysed by cytometry by time of flight (CyTOF) (control n = 11 individuals pooled in 3 analyses; NAFLD/NASH n = 16 patients pooled in 5 analyses). k, l, Selected average marker expression in CD4+ and CD8+ T cell subsets (k) and differential gene expression of CD8+PD1+ versus CD8+ T cells and CD4+PD1+ versus CD4+ T cells by scRNA-seq (l) for control individuals and patients with NAFLD or NASH (control n = 4 individuals; NAFLD/NASH n = 7 patients). All data are shown as mean ± s.e.m. All data were analysed by two-tailed Mann–Whitney test. Source data
Extended Data Fig. 10
Extended Data Fig. 10. PD1 and PDL1 targeted immunotherapy in advanced HCC has a distinct effect depending on disease aetiology.
a, Comparison of RNA-seq data from patients with NASH with varying degrees of fibrosis (F0–F4, Brunt classification) normalized to data from patients with NAFLD from a total of n = 206 patients with NAFLD or NASH. b, c, Immunohistochemical staining (b) and quantification (c) of hepatic PD1+, CD8+, and CD4+ cells from patients with NAFLD or NASH with varying degrees of fibrosis (Supplementary Table 3) (NAFLD n = 9 patients; NASH F0/1 n = 7 patients; NASH F2 n = 12 patients; NASH F3 n = 21 patients; NASH F4 n = 16 patients; CD4: NAFL n = 6 patients; NASH F0/1 n = 4 patients; NASH F2 n = 8 patients; NASH F3 n = 17 patients; NASH F4 n = 9 patients). Scale bar, 100 µm. d, Correlation analysis of PD1 expression against fibrosis grade by immunohistochemical staining (NAFLD/NASH n = 65 patients). e, Immunohistochemical staining and quantification of ratio of PD1+/CD8+ cells in immunohistochemical staining of samples from patient cohort in Supplementary Tables 4–6 (healthy individuals n = 4, NASH n = 26 patients, peri-tumoural NASH–HCC n = 16 patients, peri-tumoural HCC other aetiologies n = 29 patients). Scale bar, 100 µm. f, Immunohistochemical staining and quantification of PD1+ cells and MIB1+ hepatocytes in peri-tumoural and intra-tumoural samples from patients with HCV- or NASH-induced HCC (PD1: peri-tumoural HCV n = 16 tissues from 7 patients; peri-tumoural NASH n = 9 tissues from 2 patients; intra-tumoural HCV n = 10 HCCs from 7 patients; intra-tumoural NASH n = 6 HCCs from 2 patients; MIB1: peri-tumoural HCV n = 16 tissues from 7 patients; peri-tumoural NASH n = 9 tissues from 2 patients; intra-tumoural HCV n = 10 HCCs from 7 patients; intra-tumoural NASH n = 6 HCCs from 2 patients). Arrowheads, PD1+ or MIB1+ cells. Scale bars, 100 μm. g, PRISMA flow chart of the systematic review of targeted immunotherapy in HCC and the selection of articles assessing the clinical outcome of immune checkpoint inhibitors in advanced HCC for inclusion in the systematic review and meta-analysis. ICPI, immune checkpoint inhibitor. A total of 1,243 patients were included in two first-line trials comparing PD1- or PDL1-targeted immunotherapy to sorafenib. In these trials, 707 patients received an immune checkpoint inhibitor (either anti-PD1 or anti-PDL1). hj, HCV and HBV were pooled into a separate category, termed ‘viral’, and a subsequent meta-analysis comparing viral (n = 754) and non-viral HCC (n = 489; mostly NASH and alcohol intake) was performed (h). A subgroup analysis studying the specific effects of non-viral aetiologies (n = 489) on the magnitude of effect of immunotherapy is presented, when compared to HBV (i; n = 473) or HCV (j; n = 281). HRs for each trial are represented by squares; the size of the square represents the weight of the trial in the meta-analysis. The horizontal line crossing the square represents the 95% CI. The diamonds represent the estimated overall effect based on the meta-analysis random effect of all trials. Inverse variance (IV) and random effects methods (Random) were used to calculate HRs, 95% CIs, P values, and the test for overall effect; these calculations were two-sided. Cochran’s Q-test and I2 were used to calculate heterogeneity. All data are shown as mean ± s.e.m. c, e, f, One-way ANOVA and Dunn’s multiple comparison test. d, Two-tailed Spearman’s correlation. Source data

Comment in

References

    1. Llovet JM, et al. Hepatocellular carcinoma. Nat. Rev. Dis. Primers. 2021;7:6. doi: 10.1038/s41572-020-00240-3. - DOI - PubMed
    1. European Association for the Study of the Liver EASL Clinical Practice Guidelines management of hepatocellular carcinoma. J. Hepatol. 2018;69:182–236. doi: 10.1016/j.jhep.2018.03.019. - DOI - PubMed
    1. Zhu AX, et al. Pembrolizumab in patients with advanced hepatocellular carcinoma previously treated with sorafenib (KEYNOTE-224): a non-randomised, open-label phase 2 trial. Lancet Oncol. 2018;19:940–952. doi: 10.1016/S1470-2045(18)30351-6. - DOI - PubMed
    1. El-Khoueiry AB, et al. Nivolumab in patients with advanced hepatocellular carcinoma (CheckMate 040): an open-label, non-comparative, phase 1/2 dose escalation and expansion trial. Lancet. 2017;389:2492–2502. doi: 10.1016/S0140-6736(17)31046-2. - DOI - PMC - PubMed
    1. Finn RS, et al. Atezolizumab plus bevacizumab in unresectable hepatocellular carcinoma. N. Engl. J. Med. 2020;382:1894–1905. doi: 10.1056/NEJMoa1915745. - DOI - PubMed

Publication types

MeSH terms