. 2021 Mar 8:15:600462.
doi: 10.3389/fnins.2021.600462. eCollection 2021.

Dysregulation of MicroRNAs and PIWI-Interacting RNAs in a Caenorhabditis elegans Parkinson's Disease Model Overexpressing Human α-Synuclein and Influence of tdp-1

Affiliations

Dysregulation of MicroRNAs and PIWI-Interacting RNAs in a Caenorhabditis elegans Parkinson's Disease Model Overexpressing Human α-Synuclein and Influence of tdp-1

Linjing Shen et al. Front Neurosci. .

Abstract

MicroRNAs (miRNAs) and PIWI-interacting RNAs (piRNAs) regulate gene expression and biological processes through specific genetic and epigenetic mechanisms. Recent studies have described a dysregulation of small non-coding RNAs in Parkinson's disease (PD) tissues but have been limited in scope. Here, we extend these studies by comparing the dysregulation of both miRNAs and piRNAs from transgenic Caenorhabditis elegans (C. elegans) nematodes overexpressing pan-neuronally human α-synuclein wild-type (WT) (HASNWT OX) or mutant (HASNA53T OX). We observed 32 miRNAs and 112 piRNAs dysregulated in HASNA53T OX compared with WT. Genetic crosses of HASNA53T OX PD animal models with tdp-1 null mutants, the C. elegans ortholog of TDP-43, an RNA-binding protein aggregated in frontal temporal lobar degeneration, improved their behavioral deficits and changed the number of dysregulated miRNAs to 11 and piRNAs to none. Neuronal function-related genes T28F4.5, C34F6.1, C05C10.3, camt-1, and F54D10.3 were predicted to be targeted by cel-miR-1018, cel-miR-355-5p (C34F6.1 and C05C10.3), cel-miR-800-3p, and 21ur-1581 accordingly. This study provides a molecular landscape of small non-coding RNA dysregulation in an animal model that provides insight into the epigenetic changes, molecular processes, and interactions that occur during PD-associated neurodegenerative disorders.

Keywords: Caenorhabditis elegans; PIWI-interacting RNA; microRNA; neurodegenerative disease; synucleinopathies.


Conflict of interest statement

The authors declare that the research was conducted in the absence of any commercial or financial relationships that could be construed as a potential conflict of interest.

Figures

FIGURE 1
FIGURE 1
Hierarchical clustering for DE-miRNAs (A) and DE-piRNAs (B) of mutant/transgenic strains compared with WT strain. The cutoff of DE-miRNAs was p < 0.05 and absolute fold change >2; DE-piRNAs were p < 0.01, FDR < 0.1, and absolute fold change >2. The logarithmic scale represents the range of expression values of DE-miRNAs/DE-piRNAs. The top cluster dendrogram indicates the similarity of different strains based on the average expression values of all DE-miRNAs/DE-piRNAs of each strain. The left cluster dendrogram indicates the similarity of different DE-miRNAs/DE-piRNAs based on the average expression values of each DE-miRNA/DE-piRNA of all strains. The right colored bars show the DE-miRNA/DE-piRNA expression values.
FIGURE 2
FIGURE 2
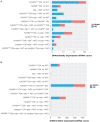
Counts of DE-miRNAs (A) and DE-piRNAs (B) generated from different comparisons. The cutoff of DE-miRNAs was p < 0.05 and absolute fold change > 2; that of DE-piRNAs was p < 0.01, FDR < 0.1, and absolute fold change > 2. The vertical lists show the comparisons. Horizontal bars indicate the DE-miRNAs/DE-piRNAs counts based on the bottom scales. Blue represents upregulated, and red represents downregulated.
FIGURE 3
FIGURE 3
(A–F) GO and KEGG enrichment analysis for the target genes of DE-miRNAs from different comparisons. The cutoff of DE-miRNAs was p < 0.05 and absolute fold change >2. The bar length represents the counts of target genes corresponding to the vertical terms. The bar color represents the p-adjust value of each term. BP, biological process; CC, cellular component; MF, molecular function; KEGG, Kyoto Encyclopedia of Genes and Genomes.
FIGURE 4
FIGURE 4
GO and KEGG enrichment analysis for the target genes of DE-piRNAs (A,B) and network of DE-piRNAs and DEGs (C,D). The cutoff of DE-piRNAs was p < 0.01, FDR < 0.1, and absolute fold change >2. (A,B) The bar length represents the counts of target genes corresponding to the vertical terms. The bar color represents the p-adjust value of each term. BP, biological process; CC, cellular component; MF, molecular function; KEGG, Kyoto Encyclopedia of Genes and Genomes. (C,D) Pink nodes represent DE-piRNAs. Blue nodes represent DEGs. Nodes labeled have a node degree ≥5. The node size represents the node degree.
FIGURE 5
FIGURE 5
Networks of DE-miRNAs, DEGs (differentially expressed genes), and TFs (transcription factors). We obtained networks for only two comparisons: HASNA53T OX vs WT and HASNA53T OX + tdp-1 KO vs HASNA53T OX. DEGs were generated from the RNA-Seq of the same strains in our previous work with the cutoff of p value <0.05 and absolute fold change >2 (Shen et al., 2020). (A,B) Pink nodes represent DE-miRNAs. Orange nodes represent TFs. Blue nodes represent DEGs. The node size represents the node degree. Nodes labeled are the ones with a node degree >3. TFs were written as a vertical word in order to distinguish it from DEGs in these figures. (C,D) The pink rectangles indicate DE-miRNAs. The orange rectangles indicate TFs. The blue rectangles indicate DEGs. Fold change (mean ± SEM) of DE-miRNAs and DEGs are indicated in the parentheses.

Similar articles

Cited by

References

    1. Bartel D. P. (2009). MicroRNAs: target recognition and regulatory functions. Cell 136 215–233. 10.1016/j.cell.2009.01.002 - DOI - PMC - PubMed
    1. Behjati S., Tarpey P. S. (2013). What is next generation sequencing? Arch. Dis. Child Educ. Pract. Ed. 98 236–238. 10.1136/archdischild-2013-304340 - DOI - PMC - PubMed
    1. Bolger A. M., Lohse M., Usadel B. (2014). Trimmomatic: a flexible trimmer for illumina sequence data. Bioinformatics 30 2114–2120. 10.1093/bioinformatics/btu170 - DOI - PMC - PubMed
    1. Buratti E., Baralle F. E. (2012). TDP-43: gumming up neurons through protein-protein and protein-RNA interactions. Trends Biochem. Sci. 37 237–247. 10.1016/j.tibs.2012.03.003 - DOI - PubMed
    1. Buratti E., De Conti L., Stuani C., Romano M., Baralle M., Baralle F. (2010). Nuclear factor TDP-43 can affect selected microRNA levels. FEBS J. 277 2268–2281. 10.1111/j.1742-4658.2010.07643.x - DOI - PubMed

LinkOut - more resources