

Multimodal Assessment of Precentral Anodal TDCS: Individual Rise in Supplementary Motor Activity Scales With Increase in Corticospinal Excitability
- PMID: 33762917
- PMCID: PMC7982814
- DOI: 10.3389/fnhum.2021.639274
Multimodal Assessment of Precentral Anodal TDCS: Individual Rise in Supplementary Motor Activity Scales With Increase in Corticospinal Excitability
Abstract
Background: Transcranial direct current stimulation (TDCS) targeting the primary motor hand area (M1-HAND) may induce lasting shifts in corticospinal excitability, but after-effects show substantial inter-individual variability. Functional magnetic resonance imaging (fMRI) can probe after-effects of TDCS on regional neural activity on a whole-brain level.
Objective: Using a double-blinded cross-over design, we investigated whether the individual change in corticospinal excitability after TDCS of M1-HAND is associated with changes in task-related regional activity in cortical motor areas.
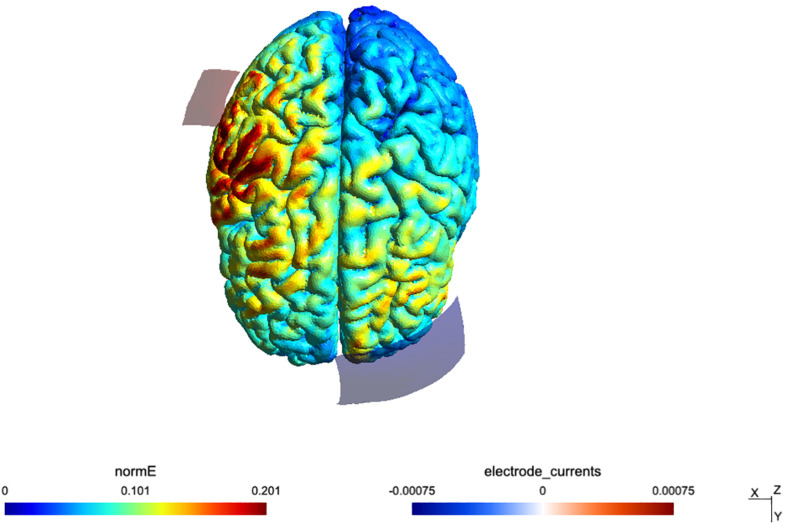
Methods: Seventeen healthy volunteers (10 women) received 20 min of real (0.75 mA) or sham TDCS on separate days in randomized order. Real and sham TDCS used the classic bipolar set-up with the anode placed over right M1-HAND. Before and after each TDCS session, we recorded motor evoked potentials (MEP) from the relaxed left first dorsal interosseus muscle after single-pulse transcranial magnetic stimulation(TMS) of left M1-HAND and performed whole-brain fMRI at 3 Tesla while participants completed a visuomotor tracking task with their left hand. We also assessed the difference in MEP latency when applying anterior-posterior and latero-medial TMS pulses to the precentral hand knob (AP-LM MEP latency).
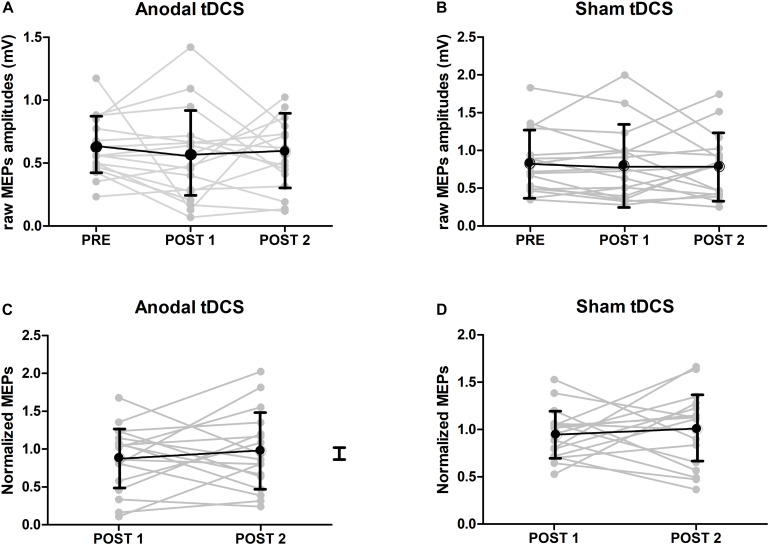
Results: Real TDCS had no consistent aftereffects on mean MEP amplitude, task-related activity or motor performance. Individual changes in MEP amplitude, measured directly after real TDCS showed a positive linear relationship with individual changes in task-related activity in the supplementary motor area and AP-LM MEP latency.
Conclusion: Functional aftereffects of classical bipolar anodal TDCS of M1-HAND on the motor system vary substantially across individuals. Physiological features upstream from the primary motor cortex may determine how anodal TDCS changes corticospinal excitability.
Keywords: functional magnetic resonance imaging (fMRI); inter-individual variability; motor evoked potentials; non-invasive brain stimulation; primary motor cortex (M1); supplementary motor area (SMA); transcrancial magnetic stimulation (TMS); transcranial direct current stimulation (tDCS).
Copyright © 2021 Karabanov, Shindo, Shindo, Raffin and Siebner.
Conflict of interest statement
HS has received honoraria as speaker from Sanofi Genzyme, Denmark and Novartis, Denmark, as consultant from Sanofi Genzyme, Denmark, Lophora, Denmark, and Lundbeck AS, Denmark, and as editor-in-chief (Neuroimage Clinical) and senior editor (NeuroImage) from Elsevier Publishers, Amsterdam, The Netherlands. He has received royalties as book editor from Springer Publishers, Stuttgart, Germany and from Gyldendal Publishers, Copenhagen, Denmark. The remaining authors declare that the research was conducted in the absence of any commercial or financial relationships that could be construed as a potential conflict of interest.
Figures


Similar articles
-
Partially non-linear stimulation intensity-dependent effects of direct current stimulation on motor cortex excitability in humans.J Physiol. 2013 Apr 1;591(7):1987-2000. doi: 10.1113/jphysiol.2012.249730. Epub 2013 Jan 21. J Physiol. 2013. PMID: 23339180 Free PMC article. Clinical Trial.
-
Current intensity- and polarity-specific online and aftereffects of transcranial direct current stimulation: An fMRI study.Hum Brain Mapp. 2020 Apr 15;41(6):1644-1666. doi: 10.1002/hbm.24901. Epub 2019 Dec 20. Hum Brain Mapp. 2020. PMID: 31860160 Free PMC article.
-
Systematic evaluation of the impact of stimulation intensity on neuroplastic after-effects induced by transcranial direct current stimulation.J Physiol. 2017 Feb 15;595(4):1273-1288. doi: 10.1113/JP272738. Epub 2016 Nov 8. J Physiol. 2017. PMID: 27723104 Free PMC article.
-
Improvement of motor control in neurological patients through motor evoked potential changes induced by transcranial direct current stimulation therapy: A meta-analysis study.Gait Posture. 2023 Sep;106:53-64. doi: 10.1016/j.gaitpost.2023.08.014. Epub 2023 Aug 26. Gait Posture. 2023. PMID: 37660514 Review.
-
The effects of transcranial direct current stimulation on corticospinal excitability: A systematic review of nonsignificant findings.Eur J Neurosci. 2023 Aug;58(4):3074-3097. doi: 10.1111/ejn.16073. Epub 2023 Jul 5. Eur J Neurosci. 2023. PMID: 37407275 Review.
Cited by
-
Transcranial direct current stimulation over the posterior parietal cortex improves visuomotor performance and proprioception in the lower extremities.Front Hum Neurosci. 2022 Aug 18;16:876083. doi: 10.3389/fnhum.2022.876083. eCollection 2022. Front Hum Neurosci. 2022. PMID: 36061503 Free PMC article.
-
Differences in motor network reorganization between patients with good and poor upper extremity impairment outcomes after stroke.Brain Imaging Behav. 2024 Dec;18(6):1549-1559. doi: 10.1007/s11682-024-00917-3. Epub 2024 Oct 7. Brain Imaging Behav. 2024. PMID: 39373958
-
Use of a Brain Navigator to Identify the Precentral Knob of the Precentral Gyrus in Normal Subjects.Med Sci Monit. 2022 Jan 18;28:e935181. doi: 10.12659/MSM.935181. Med Sci Monit. 2022. PMID: 35039469 Free PMC article.
References
LinkOut - more resources
Full Text Sources
Other Literature Sources