. 2021 Mar 8:12:586715.
doi: 10.3389/fphar.2021.586715. eCollection 2021.

Mitochondrial Function, Fatty Acid Metabolism, and Body Composition in the Hyperbilirubinemic Gunn Rat

Affiliations

Mitochondrial Function, Fatty Acid Metabolism, and Body Composition in the Hyperbilirubinemic Gunn Rat

Josif Vidimce et al. Front Pharmacol. .

Abstract

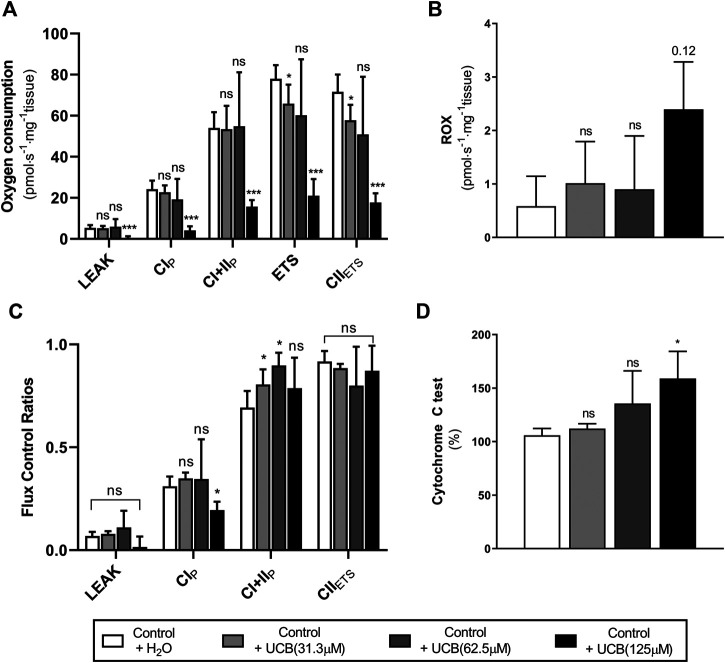
Background: Circulating bilirubin is associated with reduced adiposity in human and animal studies. A possible explanation is provided by in vitro data that demonstrates that bilirubin inhibits mitochondrial function and decreases efficient energy production. However, it remains unclear whether hyperbilirubinemic animals have similar perturbed mitochondrial function and whether this is important for regulation of energy homeostasis. Aim: To investigate the impact of unconjugated hyperbilirubinemia on body composition, and mitochondrial function in hepatic tissue and skeletal muscle. Materials and Methods: 1) Food intake and bodyweight gain of 14-week old hyperbilirubinemic Gunn (n = 19) and normobilirubinemic littermate (control; n = 19) rats were measured over a 17-day period. 2) Body composition was determined using dual-energy X-ray absorptiometry and by measuring organ and skeletal muscle masses. 3) Mitochondrial function was assessed using high-resolution respirometry of homogenized liver and intact permeabilized extensor digitorum longus and soleus fibers. 4) Liver tissue was flash frozen for later gene (qPCR), protein (Western Blot and citrate synthase activity) and lipid analysis. Results: Female hyperbilirubinemic rats had significantly reduced fat mass (Gunn: 9.94 ± 5.35 vs. Control: 16.6 ± 6.90 g, p < 0.05) and hepatic triglyceride concentration (Gunn: 2.39 ± 0.92 vs. Control: 4.65 ± 1.67 mg g-1, p < 0.01) compared to normobilirubinemic controls. Furthermore, hyperbilirubinemic rats consumed fewer calories daily (p < 0.01) and were less energetically efficient (Gunn: 8.09 ± 5.75 vs. Control: 14.9 ± 5.10 g bodyweight kcal-1, p < 0.05). Hepatic mitochondria of hyperbilirubinemic rats demonstrated increased flux control ratio (FCR) via complex I and II (CI+II) (Gunn: 0.78 ± 0.16 vs. Control: 0.62 ± 0.09, p < 0.05). Similarly, exogenous addition of 31.3 or 62.5 μM unconjugated bilirubin to control liver homogenates significantly increased CI+II FCR (p < 0.05). Hepatic PGC-1α gene expression was significantly increased in hyperbilirubinemic females while FGF21 and ACOX1 was significantly greater in male hyperbilirubinemic rats (p < 0.05). Finally, hepatic mitochondrial complex IV subunit 1 protein expression was significantly increased in female hyperbilirubinemic rats (p < 0.01). Conclusions: This is the first study to comprehensively assess body composition, fat metabolism, and mitochondrial function in hyperbilirubinemic rats. Our findings show that hyperbilirubinemia is associated with reduced fat mass, and increased hepatic mitochondrial biogenesis, specifically in female animals, suggesting a dual role of elevated bilirubin and reduced UGT1A1 function on adiposity and body composition.

Keywords: Gunn rat; hyperbilirubinemia; lipids; metabolism; mitochondria; respiration; triglycerides; unconjugated bilirubin (UCB).


Conflict of interest statement

The authors declare that the research was conducted in the absence of any commercial or financial relationships that could be construed as a potential conflict of interest. The handling editor declared a past co-authorship with one of the authors AB.

Figures

FIGURE 1
FIGURE 1
Effect of exogenous UCB on mitochondrial function in juvenile control (normobilirubinemic) liver tissue (n = 5). Mitochondrial respiratory states are identified as intrinsic uncoupling measured in the absence of ADP (LEAK), OXPHOS capacity measured at saturating levels of ADP via CI (CIP) or CI+CII (CI+IIP) and noncoupled respiratory capacity (ETS and CIIETS). (A, B) The rate of respiratory states evaluated based on O2 consumption per mass of tissue at varying UCB concentrations. (C) Respiratory states expressed relative to a common reference state (ETS). (D) Evaluating mitochondrial outer membrane integrity by the addition of cytochrome c, represented as % change in O2 consumption relative to before cytochrome c addition. CI, CII, mitochondrial respiratory chain Complex I and Complex II, respectively; ETS, electron transfer system; ROX, residual O2 consumption; UCB, unconjugated bilirubin. p < 0.05*, <0.01**, <0.001*** compared to control+H2O. ns: non-significant.
FIGURE 2
FIGURE 2
Mitochondrial function in adult female Gunn (hyperbilirubinemic) and control (normobilirubinemic) liver tissue. Mitochondrial respiratory states are identified as intrinsic uncoupling measured in the absence of ADP (LEAK), OXPHOS capacity measured at saturating levels of ADP via CI (CIP) or CI+CII (CI+IIP) and noncoupled respiratory capacity (ETS and CIIETS). (A, D) The rate of respiratory states evaluated based on O2 consumption per mass of tissue. (B) Respiratory states expressed relative to a common reference state (ETS). (C) The rate of respiratory states evaluated based on O2 consumption per protein of citrate synthase. CI, CII, mitochondrial respiratory chain Complex I and Complex II, respectively; ETS, electron transfer system; ROX, residual O2 consumption. p < 0.05*, <0.01**, <0.001*** compared to control. ns: non-significant.
FIGURE 3
FIGURE 3
Mitochondrial function in adult male Gunn (hyperbilirubinemic) and control (normobilirubinemic) liver tissue. Mitochondrial respiratory states are identified as intrinsic uncoupling measured in the absence of ADP (LEAK), OXPHOS capacity measured at saturating levels of ADP via CI (CIP) or CI+CII (CI+IIP) and noncoupled respiratory capacity (ETS and CIIETS). (A, D) Respiratory states evaluated based on O2 consumption per mass of tissue. (B) The rate of respiratory states expressed relative to a common reference state (ETS). (C) The rate of respiratory states evaluated based on O2 consumption per protein of citrate synthase. CI, CII, mitochondrial respiratory chain Complex I and Complex II, respectively; ETS, electron transfer system; ROX, residual O2 consumption. p < 0.05*, <0.01**, <0.001*** compared to control. ns: non-significant.
FIGURE 4
FIGURE 4
Mitochondrial function in adult female (A, B) and male (C, D) Gunn (hyperbilirubinemic) and control (normobilirubinemic) permeabilized soleus fibers. Mitochondrial respiratory states are identified as intrinsic uncoupling measured in the absence of ADP (LEAK), OXPHOS capacity measured at saturating levels of ADP via CI (CIP), CII (CIIP), and CI+II (CI+IIP), and noncoupled respiratory capacity (ETS). (A, C) The rate of respiratory states evaluated based on O2 consumption per mass of tissue. (B, D) Respiratory states expressed relative to a common reference state (CI+IIP). CI, CII, mitochondrial respiratory chain Complex I and Complex II, respectively; ETS, electron transfer system; p < 0.05*, <0.01**, <0.001*** compared to control. ns: non-significant.
FIGURE 5
FIGURE 5
Mitochondrial function in adult female (A, B) and male (C, D) Gunn (hyperbilirubinemic) and control (normobilirubinemic) permeabilized EDL fibers. Mitochondrial respiratory states are identified as intrinsic uncoupling measured in the absence of ADP (LEAK), OXPHOS capacity measured at saturating levels of ADP via CI (CIP), CII (CIIP), and CI+II (CI+IIP), and noncoupled respiratory capacity (ETS). (A, C) The rate of respiratory states evaluated based on O2 consumption per mass of tissue. (B, D) Respiratory states expressed relative to a common reference state (CI+IIP). CI, CII, mitochondrial respiratory chain Complex I and Complex II, respectively; ETS, electron transfer system; EDL, Extensor digitorum longus. p < 0.05*, <0.01**, <0.001*** compared to control. ns: non-significant.
FIGURE 6
FIGURE 6
Hepatic gene expression related to fatty acid metabolism and PPARα activity in adult Gunn (hyperbilirubinemic) and control (normobilirubinemic) rats. Data are presented as mean ± standard error of the mean (SEM). CPT1a, carnitine palmitoyltransferase 1A; ACADVL, acyl-CoA dehydrogenase, very long chain; HADHA, hydroxyacyl-CoA dehydrogenase trifunctional multienzyme complex subunit alpha; FASN, fatty acid synthase; FGF21, fibroblast growth factor 21; ACOX1, acyl-CoA oxidase 1. p < 0.05*, <0.01**, <0.001*** compared to control. ns: non-significant.
FIGURE 7
FIGURE 7
Hepatic gene expression related to mitochondrial biogenesis in adult Gunn (hyperbilirubinemic) and control (normobilirubinemic) rats. Data are presented as mean ± standard error of the mean (SEM). PGC-1α, peroxisome proliferative activated receptor gamma coactivator 1 alpha; NRF1, nuclear respiratory factor 1. p < 0.05*, <0.01**, <0.001*** compared to control. ns: non-significant.
FIGURE 8
FIGURE 8
Mitochondrial quality and density assessed by western blot in adult Gunn (hyperbilirubinemic) and control (normobilirubinemic) liver tissue. (A–E) Protein extracts from liver tissue were investigated for protein expression of subunits representing mitochondrial respiratory complexes (CI-V) adjusted for a loading control (GAPDH). (F) Example western blot analysis of subunits of mitochondrial complexes. CI, complex I subunit NDUFB8; CII, complex II subunit SDHB; CIII, complex III core protein 2; CIV, complex IV subunit 1; CV, complex V subunit alpha. p < 0.05*, <0.01**, <0.001*** compared to control. ns: non-significant.
FIGURE 9
FIGURE 9
Hepatic mitochondrial density measured by citrate synthase activity and energetic state assessed using pAMPK:AMPK ratios in adult Gunn (hyperbilirubinemic) and control (normobilirubinemic) liver tissue. (A) Citrate synthase activity measured in protein extracts from liver tissue standardized for total protein. (B) Phosphorylated AMPK expression over total AMPK measured using Western blot. AMPK, AMP-activated protein kinase; pAMPK, phosphorylated AMPK. p < 0.05*, <0.01**, <0.001*** compared to control. ns: non-significant.

Similar articles

Cited by

References

    1. Bailey S. A., Zidell R. H., Perry R. W. (2004). Relationships between organ weight and body/brain weight in the rat: what is the best analytical endpoint? Toxicol. Pathol. 32, 448–466. 10.1080/01926230490465874 - DOI - PubMed
    1. Bakrania B., Du Toit E. F., Wagner K. H., Headrick J. P., Bulmer A. C. (2016). Pre- or post-ischemic bilirubin ditaurate treatment reduces oxidative tissue damage and improves cardiac function. Int. J. Cardiol. 202, 27–33. 10.1016/j.ijcard.2015.08.192 - DOI - PubMed
    1. Boon A. C., Hawkins C. L., Bisht K., Coombes J. S., Bakrania B., Wagner K. H., et al. (2012). Reduced circulating oxidized LDL is associated with hypocholesterolemia and enhanced thiol status in Gilbert syndrome. Free Radic. Biol. Med. 52, 2120–2127. 10.1016/j.freeradbiomed.2012.03.002 - DOI - PMC - PubMed
    1. Bulmer A. C., Coombes J. S., Blanchfield J. T., Toth I., Fassett R. G., Taylor S. M. (2011). Bile pigment pharmacokinetics and absorption in the rat: therapeutic potential for enteral administration. Br. J. Pharmacol. 164, 1857–1870. 10.1111/j.1476-5381.2011.01413.x - DOI - PMC - PubMed
    1. Bulmer A. C., Verkade H. J., Wagner K. H. (2013). Bilirubin and beyond: a review of lipid status in Gilbert's syndrome and its relevance to cardiovascular disease protection. Prog. Lipid Res. 52, 193–205. 10.1016/j.plipres.2012.11.001 - DOI - PubMed

LinkOut - more resources