. 2021 Mar 8:12:630970.
doi: 10.3389/fphar.2021.630970. eCollection 2021.

Studies on the Changes of Pharmacokinetics Behaviors of Phytochemicals and the Influence on Endogenous Metabolites After the Combination of Radix Bupleuri and Radix Paeoniae Alba Based on Multi-Component Pharmacokinetics and Metabolomics

Affiliations

Studies on the Changes of Pharmacokinetics Behaviors of Phytochemicals and the Influence on Endogenous Metabolites After the Combination of Radix Bupleuri and Radix Paeoniae Alba Based on Multi-Component Pharmacokinetics and Metabolomics

Congcong Chen et al. Front Pharmacol. .

Abstract

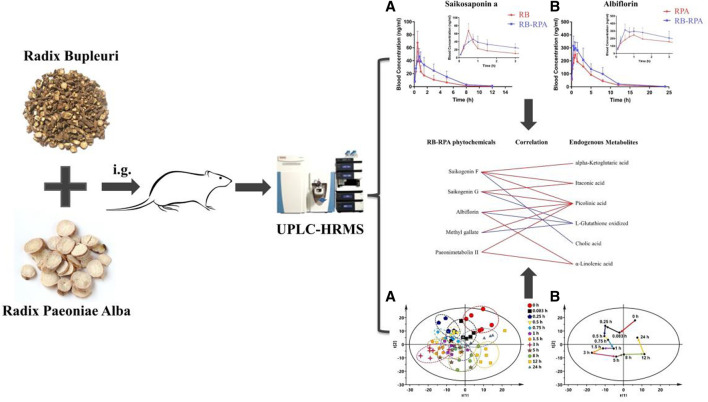
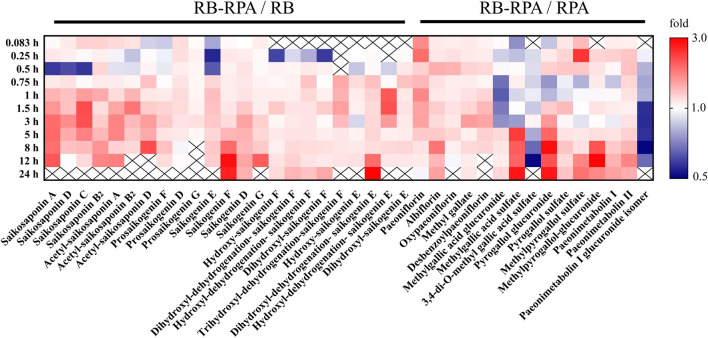
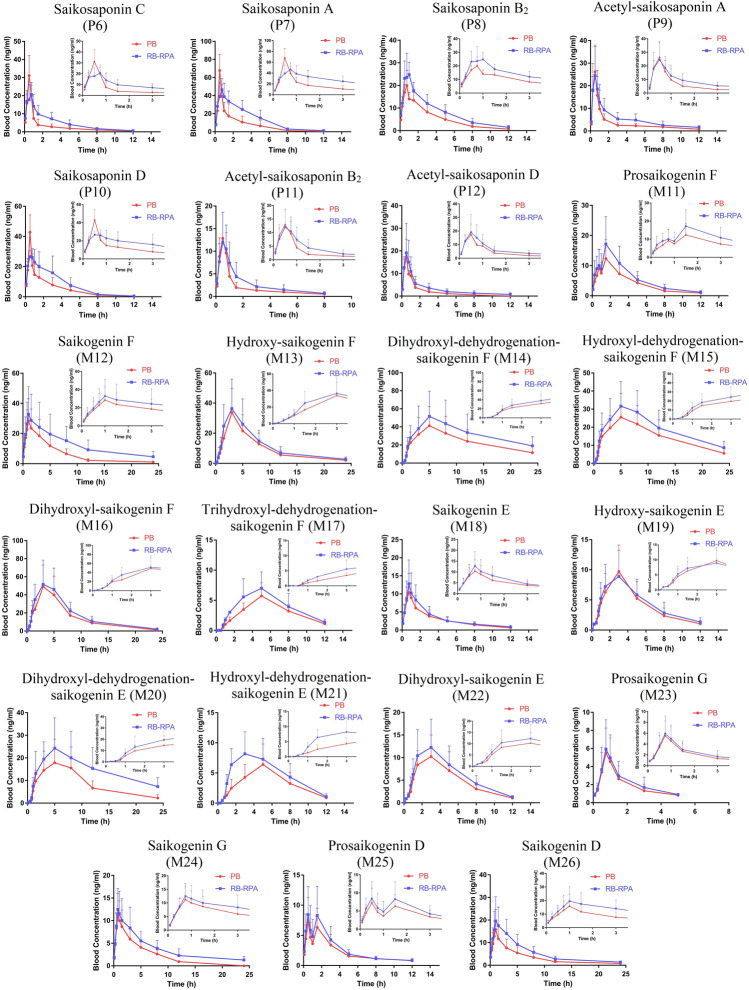
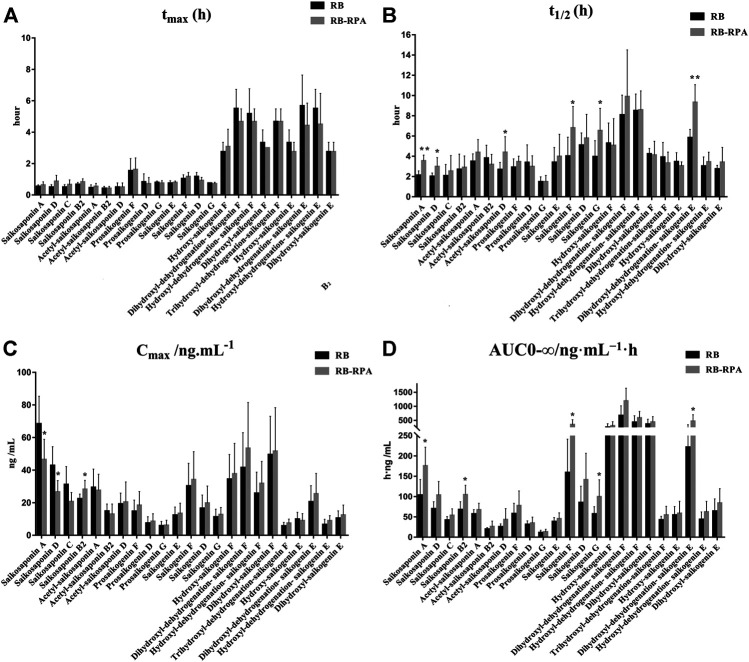
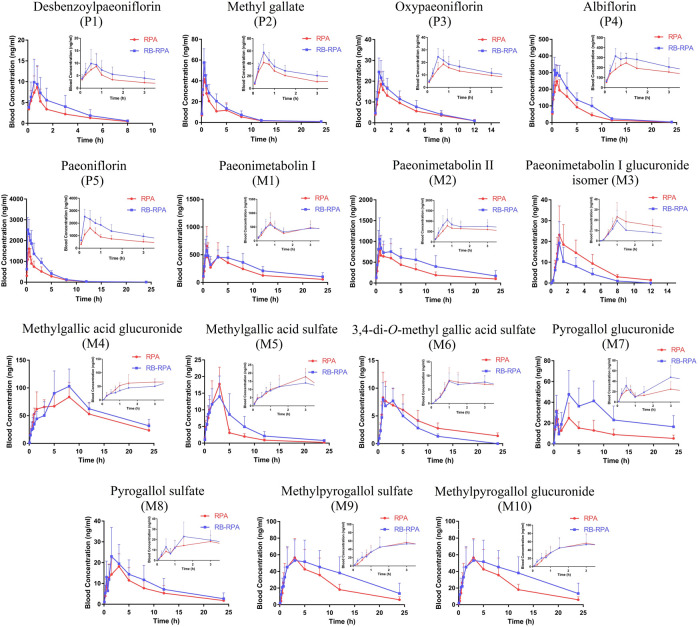
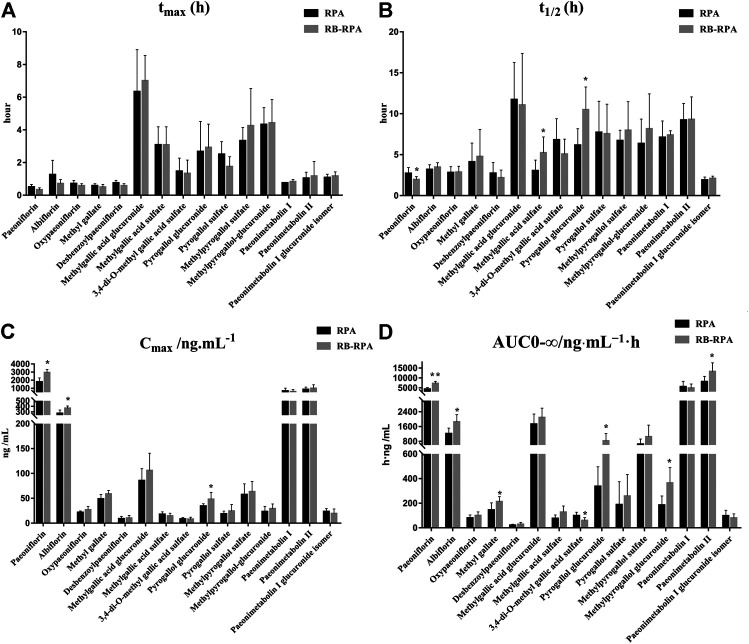
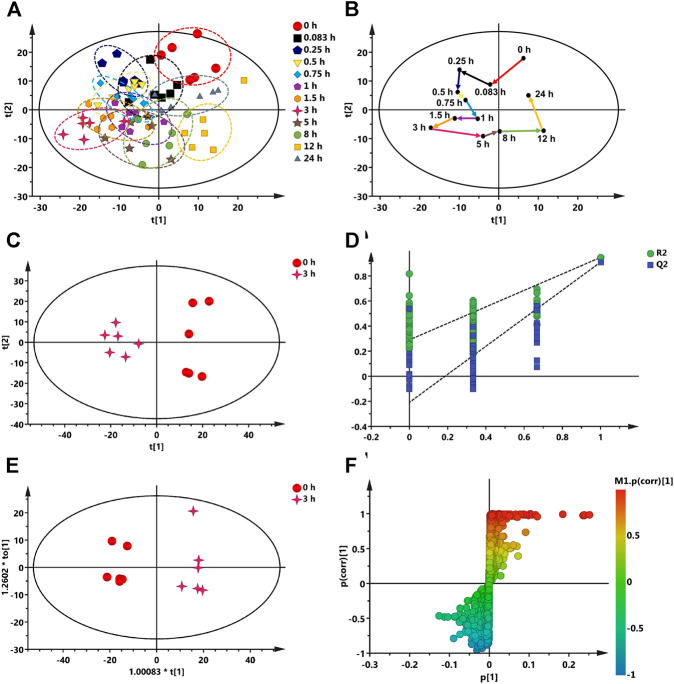
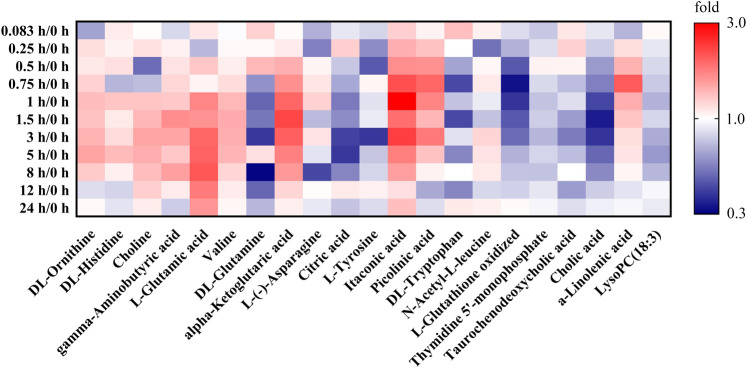
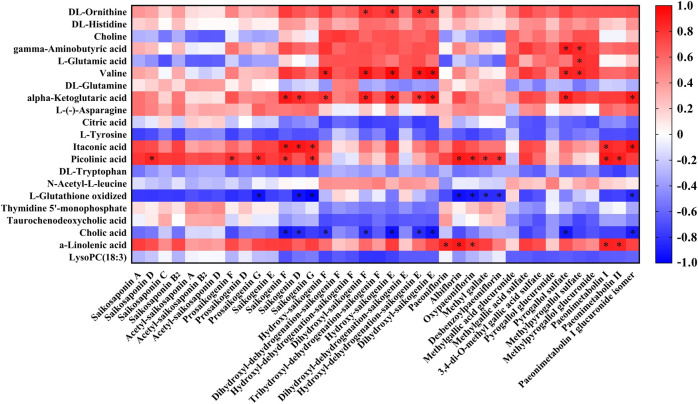
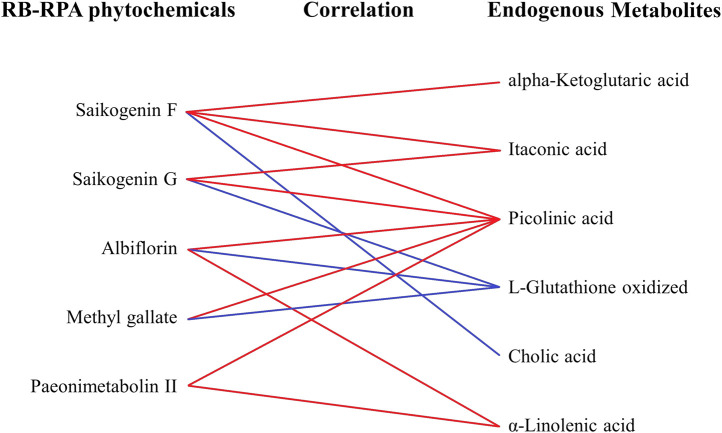
Radix Bupleuri-Radix Paeoniae Alba (RB-RPA) is a classic herb pair, which is commonly used to treat depression by soothing "liver qi stagnation" in the clinic. However, little is yet known concerning the combination mechanism of Radix Bupleuri (RB) and Radix Paeoniae Alba (RPA), their bioactive forms in vivo and the regulatory effects on the organism. The present study aimed to elucidate the changes in multi-component pharmacokinetics (PK) behavior after the combination of RB and RPA by a high-resolution full-scan mode of UPLC-HRMS method (a total of 38 components PK profiles were obtained, of which 23 components come from RB and 15 components come from RPA). Moreover, the metabolomics approach was used to analyze the dynamic response of endogenous metabolites intervened by RB-RPA, and the correlation between concentration-time curves of 38 components from RB-RPA and the dynamic response profiles of endogenous metabolites was characterized by Pearson correlation analysis. The results demonstrated that the combination of RB and RPA could significantly improve the bioavailability of five components in RB, and six components in RPA. Besides, metabolomics results indicated that a total of 21 endogenous metabolites exhibited time-dependent changes in response to the RB-RPA administration, of which 12 endogenous metabolites were significantly increased, and nine endogenous metabolites were significantly decreased. Furthermore, correlation analysis results indicated that the components with significantly improved bioavailability after combination such as saikogenin F, saikogenin G, albiflorin, methyl gallate, paeonimetabolin II were significantly positively correlated with picolinic acid, a metabolite with neuroprotective effect; saikogenin F, saikogenin G were significantly positively correlated with itaconic acid, a endogenous metabolite with anti-inflammatory activity; and albiflorin, paeonimetabolin II were significantly positively correlated with α-linolenic acid, a metabolite with strong protective actions on brain functions. These results indicated that the combination of RB and RPA can enhance each other's neuroprotective and anti-inflammatory activities. In this study, A novel and efficient strategy has been developed to analyze the influence of the combination of RB and RPA in vivo behaviors by combining multi-component pharmacokinetics with metabolomics, which was contributed to clarifying the scientific connotation of herb-herb compatibility.

Keywords: Radix Bupleuri-Radix Paeoniae Alba herb pair; correlation analysis; herb-herb compatibility; metabolomics; multi-component pharmacokinetics.


Conflict of interest statement

The authors declare that the research was conducted in the absence of any commercial or financial relationships that could be construed as a potential conflict of interest.

Figures

None
GRAPHICAL ABSTRACT | A novel and efficient strategy have been developed to analyze the influence of compatibility of RB and RPA in vivo behaviors by combining multi-component pharmacokinetics with metabolomics.
FIGURE 1
FIGURE 1
Comparison of plasma concentrations to reveal PK interactions. The average plasma concentrations (n = 7) between RB-RPA and RB or RPA were compared in heatmap. They were referred to as “X/Y,” where X is the Compatibility group and Y is RB or RPA single group. Red color indicates that the ratio is greater than 1, and the blue color indicates that the ratio is less than 1, see color bar scale. “×” means the data was not detected at this time points.
FIGURE 2
FIGURE 2
Plasma concentration-time profiles (mean ± SD, n = 7) of 23 compounds from RB after oral administration of the RB (single extract) and RB-RPA (RB and RPA compatibility). The compounds represented by the numbers in the figure are consistent with the compounds represented by the numbers in Table 1.
FIGURE 3
FIGURE 3
Main pharmacokinetic parameters of 23 compounds from RB in rat plasma after oral administration of the single extract group (RB) and the compatibility group (RB-RPA). (A) t max (h); (B) t 1/2 (h); (C) C max (ng mL−1); (D) AUC0-∞ (ng mL−1 h). All data were expressed as mean ± SD, (n = 7). *p < 0.05, **p < 0.01 compared with the RB group.
FIGURE 4
FIGURE 4
Plasma concentration-time profiles (mean ± SD, n = 7) of 15 compounds from RPA after oral administration of the RPA (single extract) and RB-RPA (RB and RPA compatibility). The compounds represented by the numbers in the figure are consistent with the compounds represented by the numbers in Table 1.
FIGURE 5
FIGURE 5
Main pharmacokinetic parameters of 15 compounds from RPA in rat plasma after oral administration of the single extract group (RPA) and the compatibility group (RB-RPA). (A) t max (h); (B) t 1/2 (h); (C) C max (ng mL−1); (D) AUC0-∞ (ng mL−1 h). All data were expressed as mean ± SD, (n = 7). *p < 0.05, **p < 0.01 compared with RPA group.
FIGURE 6
FIGURE 6
Multivariate data analysis from UPLC-MS/MS. (A) The dynamic response profiles of endogenous metabolites intervened by RB-RPA based on PCA score plots. (B) A time-dependent trajectory of endogenous metabolite profiles at different time points after RB-RPA intake. (C) PCA score plots from 3 h group and 0 h group. (D) PLS-DA model validation diagram. (E) OPLS-DA score plots from 3 h group and 0 h group. (F) S-plot of OPLS-DA.
FIGURE 7
FIGURE 7
Effect of RB-RPA herb pair intake on rat metabolite endpoints. Each cell in the heat map represents the fold change between at each time points after administration and at time-point 0 before the RB-RPA intake for a particular metabolite. The red color indicates that the ratio is greater than 1, and the blue color indicates that the ratio is less than 1. It visualizes the level of each metabolite at each time points ranging from high (red) over average (white) to low (blue).
FIGURE 8
FIGURE 8
Correlation analysis between the 38 RB-RPA herb pair phytochemicals and the altered 21 endogenous metabolites according to Pearson correlation coefficient. Red color indicated that |r| was a positive value and blue indicated that |r| was a negative value. The darker the color, the larger the |r| value. * represents p < 0.05 and |r| >0.8.
FIGURE 9
FIGURE 9
The correlation between the phytochemicals improved bioavailability after compatibility and the altered endogenous metabolites. The relationships among the phytochemicals and endogenous metabolites were visualized in the form of correlation maps, which are displayed by red (positive) or blue (negative) lines.

References

    1. Ashour M. L., Wink M. (2011). Genus Bupleurum: a review of its phytochemistry, pharmacology and modes of action. J. Pharm. Pharmacol. 63, 305–321. 10.1111/j.2042-7158.2010.01170.x - DOI - PMC - PubMed
    1. Bordon Y. (2018). Itaconate charges down inflammation. Nat. Rev. Immunol. 18, 360–361. 10.1038/s41577-018-0016-4 - DOI - PubMed
    1. Chen C. C., Yin Q. C., Tian J. S., Gao X. X., Qin X. M., Du G. H., et al. (2020). Studies on the potential link between antidepressant effect of Xiaoyao San and its pharmacological activity of hepatoprotection based on multi-platform metabolomics. J. Ethnopharmacol. 249, 112432. 10.1016/j.jep.2019.112432 - DOI - PubMed
    1. Chen Y., Wang J. Y., Yuan L., Zhou L., Jia X. B., Tan X. B. (2011). Interaction of the main components from the traditional Chinese drug pair Chaihu-Shaoyao based on rat intestinal absorption. Molecules 16, 9600–9610. 10.3390/molecules16119600 - DOI - PMC - PubMed
    1. Cheng J. T., Tsai C. L. (1986). Anti-inflammatory effect of saikogenin A. Biochem. Pharmacol. 35, 2483–2487. 10.1016/0006-2952(86)90043-2 - DOI - PubMed

LinkOut - more resources