. 2021 Mar 2:12:638695.
doi: 10.3389/fphys.2021.638695. eCollection 2021.

Phasic Neuronal Firing in the Rodent Nucleus of the Solitary Tract ex vivo

Affiliations

Phasic Neuronal Firing in the Rodent Nucleus of the Solitary Tract ex vivo

Lukasz Chrobok et al. Front Physiol. .

Abstract

Phasic pattern of neuronal activity has been previously described in detail for magnocellular vasopressin neurons in the hypothalamic paraventricular and supraoptic nuclei. This characteristic bistable pattern consists of alternating periods of electrical silence and elevated neuronal firing, implicated in neuropeptide release. Here, with the use of multi-electrode array recordings ex vivo, we aimed to study the firing pattern of neurons in the nucleus of the solitary tract (NTS) - the brainstem hub for homeostatic, cardio-vascular, and metabolic processes. Our recordings from the mouse and rat hindbrain slices reveal the phasic activity pattern to be displayed by a subset of neurons in the dorsomedial NTS subjacent to the area postrema (AP), with the inter-spike interval distribution closely resembling that reported for phasic magnocellular vasopressin cells. Additionally, we provide interspecies comparison, showing higher phasic frequency and firing rate of phasic NTS cells in mice compared to rats. Further, we describe daily changes in their firing rate and pattern, peaking at the middle of the night. Last, we reveal these phasic cells to be sensitive to α 2 adrenergic receptors activation and to respond to electrical stimulation of the AP. This study provides a comprehensive description of the phasic neuronal activity in the rodent NTS and identifies it as a potential downstream target of the AP noradrenergic system.

Keywords: brainstem; multi-electrode array; nucleus of the solitary tract; phasic; timekeeping.


Conflict of interest statement

The authors declare that the research was conducted in the absence of any commercial or financial relationships that could be construed as a potential conflict of interest.

Figures

Figure 1
Figure 1
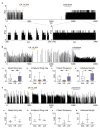
Phasic activity pattern in the rat nucleus of the solitary tract (NTS). (A) Spike sorted single units (in blue) with a corresponding firing rate histogram (bin: 1 s) showing a typical phasic activity in the NTS. The enlarged 200 s of the recording is shown below. (B) Example of tonic discharge. (a) The distribution of firing rates. (b) Inter-spike interval (ISI) histograms. (c) Autocorrelograms with the 95% CI depicted by the grey box. (d) The hazard plot showing the probability of an ISI after each spike. Bins in (a) are 1 Hz, while in (b–d) – 10 ms.
Figure 2
Figure 2
Phasic activity pattern in the rat and mouse hypothalamic paraventricular (PVN) and supraoptic nuclei (SON). (A) Photographs showing example hypothalamic slices mounted on the multi-electrode array with the SON and PVN outlined in black and the location of recording electrodes depicted by red circles. opt – optic tract, f – fornix. (B,C) The panel (B) shows a representative rat PVN phasic unit, whereas (C) depicts a phasic cell in the mouse SON. (a) Single units with their corresponding firing rate histograms (bin: 1 s). (b) Anatomical reconstruction showing the localisation of recorded units. opt – optic tract. (c) ISI histograms. (d) Autocorrelograms with the 95% CIs coded by grey boxes. (e) Hazard plots describing the probability of ISI after each spike. Bins for (d,e) are 10 ms.
Figure 3
Figure 3
Comparison of phasic activity pattern in the mouse and rat NTS. Example phasic firing rate histograms (bin: 1 s) for mouse (A) and rat (B). (C–G) Statistical comparison of the frequency of phasic burst occurrence (phasic frequency), intraburst firing rate, maximum firing rate, intraburst length, and the variability of firing within the intraburst (shown as the SD of firing). The horizon line within the box is median value, while the box indicates interquartile range. Whiskers include all data points. *p < 0.05, **p < 0.01, ****p < 0.0001, Mann-Whitney tests. (H) Photographs of brainstem slices mounted on the multi-electrode array with the dorsal vagal complex outlined in grey and the location of recording electrodes shown in red. (I) Anatomical reconstruction of the recorded phasic cells in the mouse (in red) and rat NTS (in blue). AP – area postrema, CC – central canal, DMV – dorsal motor nucleus of the vagus.
Figure 4
Figure 4
Phasic activity pattern in the NTS is rarely periodic. (A) Example of a rare periodic unit. (B) Representative non-periodic activity. (a) Firing rate histograms (bin: 1 s). (b) Autocorrelograms (bin: 1 s). Grey boxes code 95% CIs. (c) Periodograms. PSD – power spectral density.
Figure 5
Figure 5
Phasic activity in the NTS is not synchronised amongst its neurons. Example pairs of simultaneously recorded NTS neurons displaying phasic activity pattern in mouse (A) and rat (B). (a,b) Firing rate histograms for individual neurons (bin: 1 s). (c,d) Corresponding autocorrelograms (bin: 1 s). (e) Cross correlation between two units. 95% CIs are coded by grey boxes.
Figure 6
Figure 6
Daily variation in the phasic activity pattern in the rat but not mouse NTS. (A) Frequency of phasic bursts occurrence. (B) Firing rate within the intrabursts. (C) Mean intraburst length. All comparisons were calculated with Mann-Whitney tests for mice and Kruskal-Wallis tests for rat data. The horizon line within the box is median value, while the box indicates interquartile range. Whiskers include all data points. *p < 0.05, **p < 0.01. ZT – Zeitgeber time.
Figure 7
Figure 7
Electrical stimulation of the AP alters neuronal activity of phasic neurons in the mouse NTS. (A) Anatomical reconstruction showing the localisation of the stimulation electrodes in the AP (green circles) and phasic cells in the NTS: excited by the AP stimulation (red), inhibited (blue), or exhibiting no response (grey circles). (B) Pie chart summarising the proportion of responsive cells. (C–E) Mean peri-stimulus firing rate plots showing the spike density of all excited, inhibited, and non-responsive cells before and after the AP stimulation. Gaussian probability was generated with Kernel function (width: 50 ms). Grey bar depicts the stimulation time. Shading codes the average SEM for all responses of all neurons in one group.
Figure 8
Figure 8
Phasic neurons in the NTS are sensitive to the activation of α2 adrenergic receptors. (A) Firing rate histogram (bin: 1 s) showing the example effect of α2 adrenergic receptor stimulation with an agonist UK 14,304 (in orange) causing a total silencing of neuronal activity, restored by an antagonist/inverse agonist yohimbine (in purple). The subpanel below shows an enlarged 300 s fragment of the baseline and response to yohimbine. (B) Representative recording of the phasic activity decreased by the UK 14,304 and rebounded after yohimbine. (Ba–d) Statistical summary of the changes in the phasic activity pattern induced by α2 adrenergic receptor compounds. The horizon line within the box is median value, while the box indicates interquartile range. Whiskers include all data points. *p < 0.05, **p < 0.01, ***p < 0.001, Dunn’s multiple comparison tests. (C) Example of the phasic unit excited by the UK 14,304, which activity was restored after yohimbine application. (Ca–d) Summary of the drug-evoked changes. No statistical analysis was performed due to a small group size (n = 3). The horizon line depicts median values. Whiskers include all data points.

Similar articles

Cited by

References

    1. Abegg K., Hermann A., Boyle C. N., Bouret S. G., Lutz T. A., Riediger T. (2017). Involvement of amylin and leptin in the development of projections from the area postrema to the nucleus of the solitary tract. Front. Endocrinol. 8:324. 10.3389/fendo.2017.00324, PMID: - DOI - PMC - PubMed
    1. Adachi A., Kobashi M., Miyoshi N., Tsukamoto G. (1991). Chemosensitive neurons in the area postrema of the rat and their possible functions. Brain Res. Bull. 26, 137–140. 10.1016/0361-9230(91)90198-s, PMID: - DOI - PubMed
    1. Andrew R., Dudek F. (1983). Burst discharge in mammalian neuroendocrine cells involves an intrinsic regenerative mechanism. Science 221, 1050–1052. 10.1126/science.6879204, PMID: - DOI - PubMed
    1. Andrew R. D., Dudek F. E. (1984). Analysis of intracellularly recorded phasic bursting by mammalian neuroendocrine cells. J. Neurophysiol. 51, 552–566. 10.1152/jn.1984.51.3.552, PMID: - DOI - PubMed
    1. Armstrong D. M., Pickel V. M., Joh T. H., Reis D. J., Miller R. J. (1981). Immunocytochemical localization of catecholamine synthesizing enzymes and neuropeptides in area postrema and medial nucleus tractus solitarius of rat brain. J. Comp. Neurol. 196, 505–517. 10.1002/cne.901960312, PMID: - DOI - PubMed

LinkOut - more resources