. 2021 Mar 8:12:631271.
doi: 10.3389/fimmu.2021.631271. eCollection 2021.

PI3Kδ Forms Distinct Multiprotein Complexes at the TCR Signalosome in Naïve and Differentiated CD4+ T Cells

Affiliations

PI3Kδ Forms Distinct Multiprotein Complexes at the TCR Signalosome in Naïve and Differentiated CD4+ T Cells

Daisy H Luff et al. Front Immunol. .

Abstract

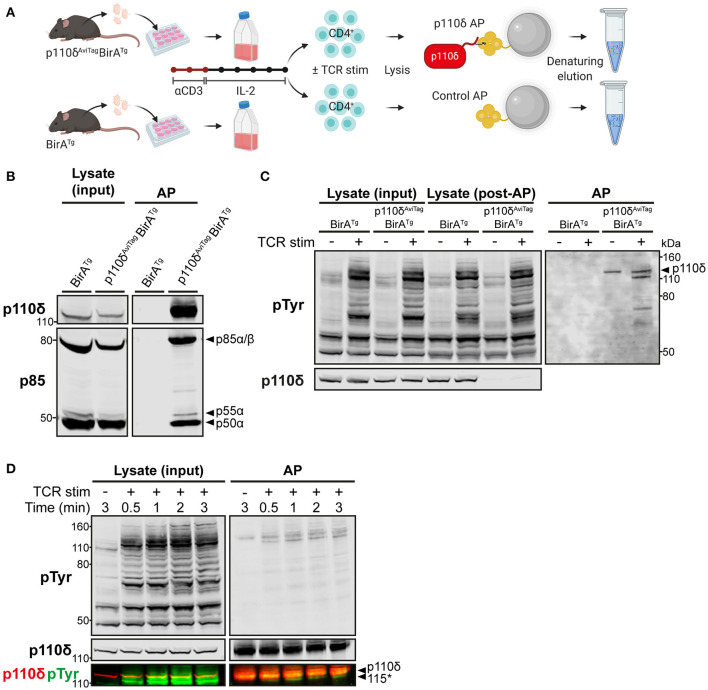
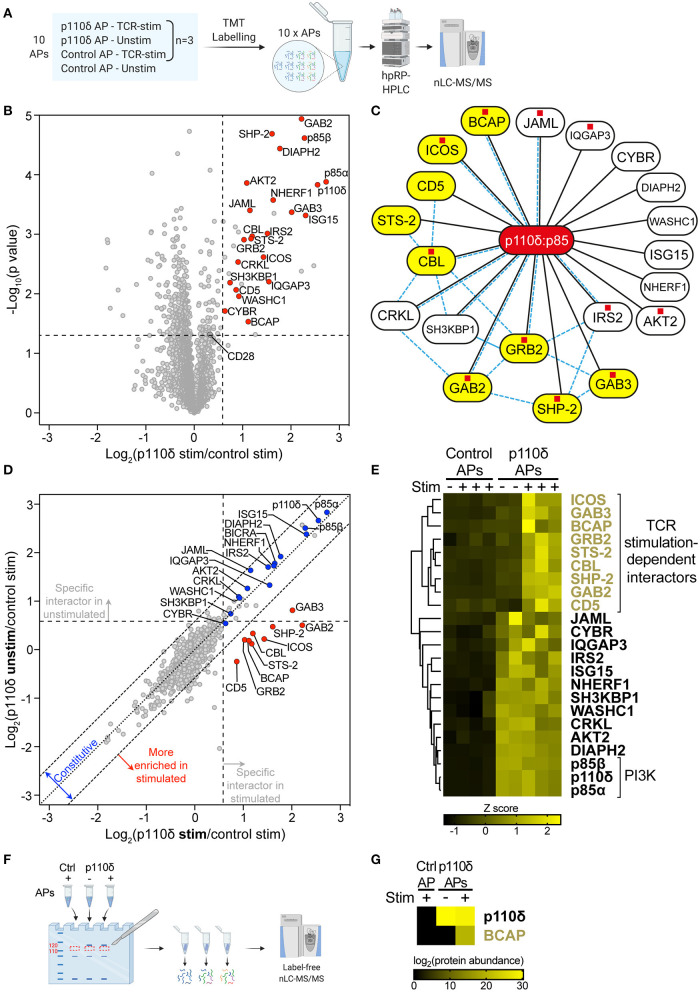
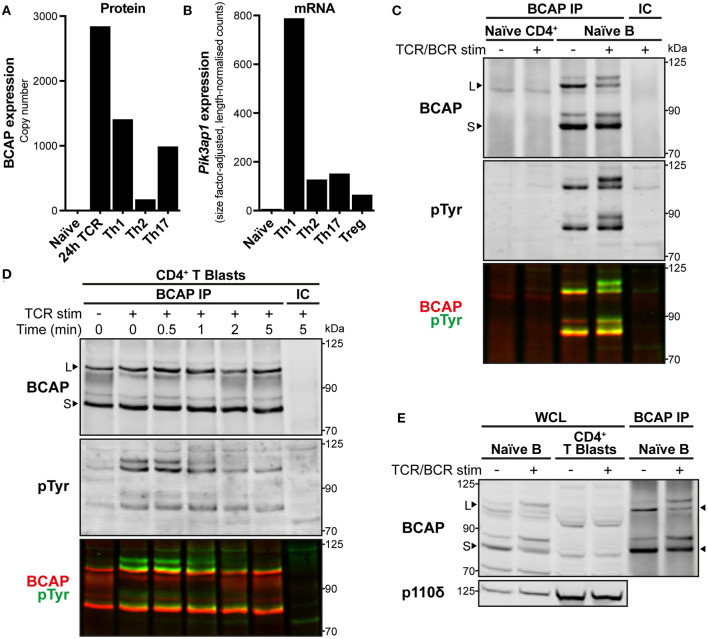
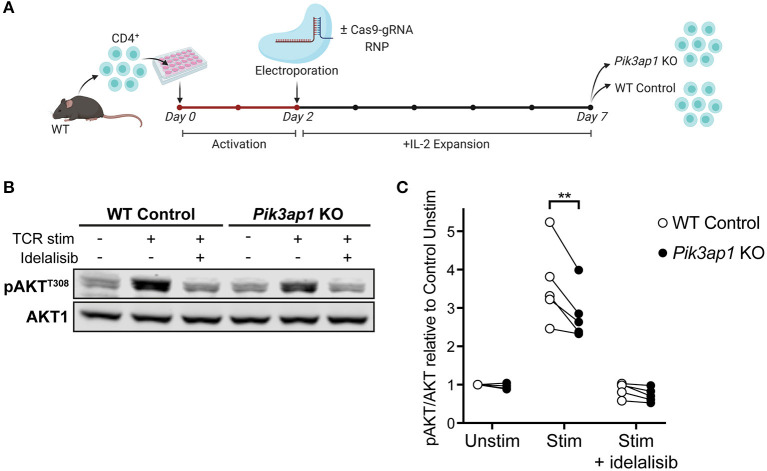
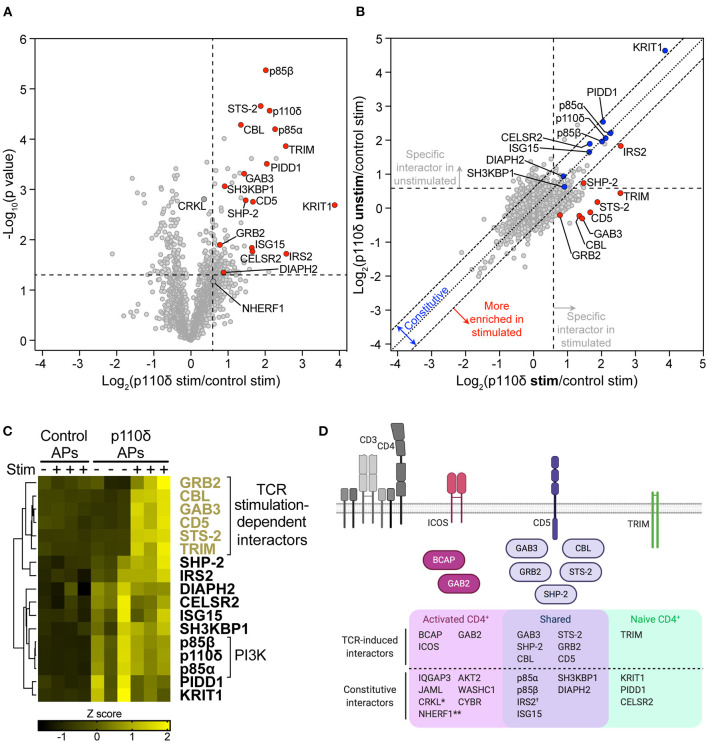
Phosphoinositide 3-kinases (PI3Ks) play a central role in adaptive immunity by transducing signals from the T cell antigen receptor (TCR) via production of PIP3. PI3Kδ is a heterodimer composed of a p110δ catalytic subunit associated with a p85α or p85β regulatory subunit and is preferentially engaged by the TCR upon T cell activation. The molecular mechanisms leading to PI3Kδ recruitment and activation at the TCR signalosome remain unclear. In this study, we have used quantitative mass spectrometry, biochemical approaches and CRISPR-Cas9 gene editing to uncover the p110δ interactome in primary CD4+ T cells. Moreover, we have determined how the PI3Kδ interactome changes upon the differentiation of small naïve T cells into T cell blasts expanded in the presence of IL-2. Our interactomic analyses identified multiple constitutive and inducible PI3Kδ-interacting proteins, some of which were common to naïve and previously-activated T cells. Our data reveals that PI3Kδ rapidly interacts with as many as seven adaptor proteins upon TCR engagement, including the Gab-family proteins, GAB2 and GAB3, a CD5-CBL signalosome and the transmembrane proteins ICOS and TRIM. Our results also suggest that PI3Kδ pre-forms complexes with the adaptors SH3KBP1 and CRKL in resting cells that could facilitate the localization and activation of p110δ at the plasma membrane by forming ternary complexes during early TCR signalling. Furthermore, we identify interactions that were not previously known to occur in CD4+ T cells, involving BCAP, GAB3, IQGAP3 and JAML. We used CRISPR-Cas9-mediated gene knockout in primary T cells to confirm that BCAP is a positive regulator of PI3K-AKT signalling in CD4+ T cell blasts. Overall, our results provide evidence for a large protein network that regulates the recruitment and activation of PI3Kδ in T cells. Finally, this work shows how the PI3Kδ interactome is remodeled as CD4+ T cells differentiate from naïve T cells to activated T cell blasts. These activated T cells upregulate additional PI3Kδ adaptor proteins, including BCAP, GAB2, IQGAP3 and ICOS. This rewiring of TCR-PI3K signalling that occurs upon T cell differentiation may serve to reduce the threshold of activation and diversify the inputs for the PI3K pathway in effector T cells.

Keywords: CD4+ T cells; CRISPR-Cas9; PI3K; TCR signalling; interactomics; p110δ.


Conflict of interest statement

STB and KH were employed by the company AstraZeneca. The remaining authors declare that the research was conducted in the absence of any commercial or financial relationships that could be construed as a potential conflict of interest.

Figures

Figure 1
Figure 1
Specific affinity purification of p110δ complexes from primary CD4+ T cell blasts. (A) Schematic of the affinity purification (AP) protocol. T cells from the lymph nodes of p110δAviTagBirATg and BirATg (control) mice were activated in vitro with anti-CD3 for 48 h and expanded for 5 days with IL-2. Purified CD4+ T cell blasts were then stimulated by CD3-CD4-crosslinking and their cell lysates were subjected to affinity purification (AP) using streptavidin-conjugated magnetic beads, as described in Materials and Methods. Proteins were eluted from the beads by denaturation then subjected to SDS-PAGE, before immunoblotting or nLC-MS/MS analysis. Schematic created with BioRender.com. (B) Immunoblot of control and p110δ APs from BirATg and p110δAviTagBirATg CD4+ T cell blasts, respectively, alongside the whole cell lysate inputs. The membrane was probed with anti-p110δ and anti-pan-p85, which detects all isoforms of p85. Immunoblot from one experiment representative of at least three independent experiments. (C) Immunoblot of control and p110δ APs from BirATg and p110δAviTagBirATg CD4+ T cell blasts, respectively, that had been stimulated for 1 min by CD3-CD4-crosslinking (TCR stim; +) or were left unstimulated (–), alongside whole cell lysates before (input) and after (post-AP) affinity purification to show efficient depletion of p110δ. Membranes were probed with anti-phosphotyrosine (pTyr), to detect phosphorylated tyrosine residues, and anti-p110δ. The black arrowhead indicates p110δ (119.7 kDa). Immunoblot from one experiment representative of at least three independent experiments. (D) Immunoblot of p110δ APs and whole cell lysates from p110δAviTagBirATg CD4+ T cell blasts that had been stimulated for the indicated times by CD3-CD4-crosslinking (TCR stim; +). Bands detected by anti-p110δ and anti-pTyr are overlaid in the bottom panel to show that the unknown co-purified pTyr-protein of ~115 kDa (labelled 115*) runs below p110δ (119.7 kDa). Immunoblot from one experiment representative of two independent experiments.
Figure 2
Figure 2
The p110δ interactome in CD4+ T cell blasts. (A) Schematic of samples analysed by quantitative MS. p110δ and control APs were produced from unstimulated and TCR-stimulated CD4+ T cell blasts in three independent biological-repeat experiments (detailed in Supplementary Figures 3A,B). Peptides were generated from the AP bead eluates then labelled in parallel with 10plex™ isobaric Tandem Mass Tags (TMTs) and combined for high-pH reversed-phase HPLC (hpRP-HPLC) pre-fractionation followed by nLC-MS/MS. (B) Volcano plot of proteins identified by mass spectrometry in APs from CD4+ T cell blasts that had been stimulated for 1 min by CD3-CD4-crosslinking. The plot shows the log2-difference in abundance of each protein in p110δ APs compared to control APs from three independent repeat experiments [Log2(p110δ stim/control stim)] vs. the –Log10-p value, determined by a two-tailed Student's t-test. The thresholds used to determine specific p110δ-interactors (upper-right quadrant) are drawn at 1.5-fold enrichment and p = 0.05. Proteins of interest are represented by red points. CD28 was classed a non-specific background protein. The full list of all proteins identified and t-test results can be found in Supplementary Datasheet 1. (C) Network diagram illustrating the specific p110δ-interactors identified by AP-MS in TCR-stimulated CD4+ T cell blasts (connected to p110δ with black lines). Previously known direct protein-protein interactions with p85 or between p110δ-interactors are indicated with pale blue dashed lines, as referenced in Supplementary Table 1. Proteins containing at least one YxxM motif are labelled with a red square, as listed in Supplementary Table 2. TCR stimulation-dependent p110δ-interactors are coloured yellow. (D) Scatter plot comparing the abundance of identified proteins in p110δ purifications from TCR-stimulated and unstimulated T cell blasts, relative to their abundance in control APs, from three independent repeat experiments. The diagonal dotted line indicates no difference between stimulated and unstimulated cells, while the diagonal dashed lines represent thresholds of 1.5-fold enrichment in either condition. The thresholds used to determine specific p110δ-interactors are drawn as vertical and horizontal dashed lines for stimulated and unstimulated cells, respectively, indicating 1.5-fold enrichment in p110δ APs compared to control APs. Specific interactors of interest are coloured blue (constitutive) and red (stimulation-induced). (E) Heatmap visualizing the Z score-normalised log2-protein abundance of specific p110δ-interactors in control and p110δ APs from unstimulated (–) and TCR-stimulated (+) CD4+ T cell blasts from three independent experiments. The result of hierarchical clustering of the data is represented by a dendrogram. (F) Control and p110δ APs from unstimulated (–) and TCR-stimulated (+) CD4+ T cell blasts were separated by SDS-PAGE. For each sample lane, the region corresponding to 110–120 kDa was excised from the gel and peptides were extracted, digested and analysed by label-free nLC-MS/MS. (G) Heatmap visualizing the log2-protein abundance of p110δ and BCAP in the 110–120 kDa gel slice of the three APs as described in (F). Black cells indicate that the protein was not identified in that sample. The full list of all proteins identified can be found in Supplementary Datasheet 2.
Figure 3
Figure 3
BCAP is upregulated in activated CD4+ T cells and tyrosine-phosphorylated upon TCR stimulation. (A) BCAP protein copy number in mouse naïve CD4+ T cells, 24 h-antigen-activated OT-II CD4+ T cells, and differentiated Th1, Th2, and Th17 CD4+ T cells. Data are from ImmPRes [http://immpres.co.uk; (4)]. (B) Expression of Pik3ap1 mRNA in murine naïve splenic CD4+ T cells, in vitro-activated and polarised Th1, Th2, and Th17 CD4+ T cells, and splenic Tregs. Data are from Th-Express [https://th-express.org; (33)]. Expression levels in each subtype are calculated as read counts normalised by size factor and transcript length. (C) Immunoblot of immunoprecipitates (IPs) from naïve CD4+ T cells and naïve splenic B cells using anti-BCAP (BCAP IP) or IgG isotype-control antibody (IC). Naïve CD4+ T cells were stimulated by CD3-CD4-crosslinking for 30 s and naïve B cells were stimulated with anti-mouse IgM F(ab′ )2 for 2.5 min (TCR/BCR stim; +), or left unstimulated (–). The membrane was probed with anti-BCAP and anti-pTyr and the signals detected for each are overlaid in the third panel in red and green, respectively. Arrowheads indicate the BCAP long (L) and short (S) isoforms. Immunoblot representative of two independent experiments. (D) Immunoblot of IPs from CD4+ T cell blasts using anti-BCAP (BCAP IP) or IgG isotype-control antibody (IC). Cells were stimulated by CD3-CD4-crosslinking (TCR stim; +) for the indicated times or left unstimulated (–). The membrane was probed with anti-BCAP and anti-pTyr and the signals detected for each are overlaid in the third panel in red and green, respectively. Arrowheads indicate the BCAP long (L) and short (S) isoforms. Immunoblot from one experiment representative of three independent experiments. (E) Immunoblot of whole cell lysates (WCL) from an equal number of naïve splenic B cells and CD4+ T cell blasts, alongside BCAP IPs from naïve B cells to show the location of BCAP long (L) and short (S) isoforms, indicated with arrowheads. Naïve B cells were stimulated with anti-mouse IgM F(ab′ )2 for 2.5 min and CD4+ T cell blasts were stimulated by CD3-CD4-crosslinking for 1 min (TCR/BCR stim; +), or left unstimulated (–). The membrane was probed with anti-BCAP and anti-p110δ as a loading reference. Immunoblot representative of at least three independent experiments.
Figure 4
Figure 4
TCR-induced p110δ-AKT signalling is impaired in BCAP-deficient activated CD4+ T cells. (A) Schematic of the CRISPR-Cas9 gene editing protocol used to generate Pik3ap1-KO T cell blasts. Naïve CD4+ T cells from the lymph nodes of one WT mouse were activated in vitro with anti-CD3+anti-CD28 for 48 h then electroporated with (for Pik3ap1 KO) or without (for WT Control) Cas9-gRNA RNPs targeting Pik3ap1 exon 4. Cells were then expanded with IL-2 for 5 days. Pik3ap1 knockout was confirmed on day 5 by sequencing and Tracking of Indels by Decomposition analysis, as described in Supplementary Figure 5. Cells were rested for 1.25 h before TCR stimulation on day 7. (B) Immunoblot for pAKTT308 in Pik3ap1-knockout and WT-control CD4+ T cell blasts following TCR stimulation for 2 min by CD3-CD4-crosslinking (+), or without stimulation (–), in the presence or absence of 200 nM idelalisib. AKT1 was detected as a loading control. Immunoblot representative of five biological repeats. (C) Quantification of pAKTT308 detected by immunoblotting in Pik3ap1-knockout and WT-control CD4+ T cell blasts, stimulated as described in (B). pAKTT308 was normalised to the AKT1 loading control and is expressed relative to that in unstimulated WT-control cells. The lines on the spaghetti plot connect Pik3ap1-knockout (black circles) and WT-control (white circles) cells from the same mouse and experiment. Data are from five biological repeats. Significance was determined by a ratio paired t-test; **p = 0.0088.
Figure 5
Figure 5
The p110δ interactome in naïve CD4+ T cells. (A) Volcano plot of proteins identified by mass spectrometry in APs from naïve CD4+ T cells. The plot shows the log2-difference in abundance of each protein in p110δ APs compared to control APs from TCR-stimulated cells from three independent repeat experiments [Log2(p110δ stim/control stim)] vs. the –Log10-p value, determined by a two-tailed Student's t-test. Cells had been stimulated for 1 min by CD3-CD4-crosslinking. The thresholds used to determine specific p110δ-interactors (upper-right quadrant) are drawn at 1.5-fold enrichment and p = 0.05. Proteins of interest are represented by red points. Proteins identified as specific p110δ-interactors in CD4+ T blasts that fall outside of the thresholds in naïve cells (CRKL, NHERF1) are filled dark grey. The full list of all proteins identified and t-test results can be found in Supplementary Datasheet 3. (B) Scatter plot comparing the abundance of identified proteins in p110δ purifications from TCR-stimulated and unstimulated naïve CD4+ T cells, relative to their abundance in control APs, from three independent repeat experiments. The diagonal dotted line indicates no difference between stimulated and unstimulated cells, while the diagonal dashed lines represent thresholds of 1.5-fold enrichment in either condition. The thresholds used to determine specific p110δ-interactors are drawn as vertical and horizontal dashed lines for stimulated and unstimulated cells, respectively, indicating 1.5-fold enrichment in p110δ APs compared to control APs. Specific interactors of interest are coloured blue (constitutive) and red (stimulation-induced). (C) Heatmap visualizing the Z score-normalised log2-protein abundance of specific p110δ-interactors in control and p110δ APs from unstimulated (–) and TCR-stimulated (+) naïve CD4+ T cells from three independent experiments. The result of hierarchical clustering of the data is represented by a dendrogram. (D) Diagram illustrating the proteins identified as part of the p110δ interactome in naïve CD4+ T cells and activated CD4+ T cell blasts. The Venn diagram shows p110δ-interactors common to the two cell differentiation stages (purple) and those identified in only in naïve (green) or activated (pink) CD4+ T cells. TCR stimulation-dependent interactors are also drawn as cartoons above the Venn diagram following the same colour scheme. NB.: *CRKL was weakly-enriched with p110δ (1.28-fold; p = 0.0016) in stimulated naïve T cells; **NHERF1 was inconsistently enriched with p110δ in stimulated naïve cells (1.52-fold; p = 0.0675); The association of IRS2 with p110δ in naïve cells was increased in TCR-stimulated compared to unstimulated cells, but was constitutive in T cell blasts.

Similar articles

Cited by

References

    1. Rameh LE, Cantley LC. The role of phosphoinositide 3-kinase lipid products in cell function. J Biol Chem. (1999) 274:8347–50. - PubMed
    1. Vanhaesebroeck B, Guillermet-Guibert J, Graupera M, Bilanges B. The emerging mechanisms of isoform-specific PI3K signaling. Nat Rev Mol Cell Biol. (2010) 11:329–41. 10.1038/nrm2882 - DOI - PubMed
    1. Kok K, Nock GE, Verrall EAG, Mitchell MP, Hommes DW, Peppelenbosch MP, et al. . Regulation of p110δ PI 3-kinase gene expression. PLoS ONE. (2009) 4:e5145. 10.1371/journal.pone.0005145 - DOI - PMC - PubMed
    1. Howden AJM, Hukelmann JL, Brenes A, Spinelli L, Sinclair LV, Lamond AI, et al. . Quantitative analysis of T cell proteomes and environmental sensors during T cell differentiation. Nat Immunol. (2019) 20:1542–54. 10.1038/s41590-019-0495-x - DOI - PMC - PubMed
    1. Costello PS, Gallagher M, Cantrell DA. Sustained and dynamic inositol lipid metabolism inside and outside the immunological synapse. Nat Immunol. (2002) 3:1082–9. 10.1038/ni848 - DOI - PubMed

Publication types

MeSH terms