. 2021 Mar 12:9:e11085.
doi: 10.7717/peerj.11085. eCollection 2021.

Segmental analysis by speckle-tracking echocardiography of the left ventricle response to isoproterenol in male and female mice

Affiliations

Segmental analysis by speckle-tracking echocardiography of the left ventricle response to isoproterenol in male and female mice

Elisabeth Walsh-Wilkinson et al. PeerJ. .

Abstract

We studied by conventional and speckle-tracking echocardiography, the response of the left ventricle (LV) to a three-week continuous infusion of isoproterenol (Iso), a non-specific beta-adrenergic receptor agonist in male and female C57Bl6/J mice. Before and after Iso (30 mg/kg/day), we characterized LV morphology and function as well as global and segmental strain. We observed that Iso reduced LV ejection in both male (-8.7%) and female (-14.7%) mice. Several diastolic function parameters were negatively regulated in males and females such as E/A, E/E', isovolumetric relaxation time. Global longitudinal (GLS) and circumferential (GCS) strains were reduced by Iso in both sexes, GLS by 31% and GCS by about 20%. For the segmental LV analysis, we measured strain, strain rate, reverse strain rate, peak speckle displacement and peak speckle velocity in the parasternal long axis. We observed that radial strain of the LV posterior segments were more severely modulated by Iso than those of the anterior wall in males. In females, on the other hand, both posterior and anterior wall segments were negatively impacted by Iso. Longitudinal strain showed similar results to the radial strain for both sexes. Strain rate, on the other hand, was only moderately changed by Iso. Reverse strain rate measurements (an index of diastolic function) showed that posterior LV segments were negatively regulated by Iso. We then studied the animals 5 and 17 weeks after Iso treatment. Compared to control mice, LV dilation was still present in males. Ejection fraction was decreased in mice of both sex compared to control animals. Diastolic function parameters, on the other hand, were back to normal. Taken together, our study indicates that segmental strain analysis can identify LV regions that are more negatively affected by a cardiotoxic agent such as Iso. In addition, cessation of Iso was not accompanied with a complete restoration of cardiac function after four months.

Keywords: Adrenergic suractivation; Cardiac toxicity; Heart; Isoproterenol; Mouse; Sex differences; Speckle-tracking echocardiography; Strain; Takotsubo syndrome.


Conflict of interest statement

The authors declare there are no competing interests.

Figures

Figure 1
Figure 1. Speckle tracking strain analysis.
Radial and longitudinal strains can be obtained using the parasternal long axis (PSLAX) view. The six segments are also identified. Characters colors correspond to those used in the graphs for each of these LV segments. Ant, anterior, Post, posterior. Before after effects of Iso on the strain. Radial (A–B) and longitudinal (C–D) peak strains were obtained using the parasternal long axis view. The six segments are identified. Characters colors correspond to those used in the graphs for each of these LV segments.Radial (E–F and G–H) and longitudinal (I–J and K–L) peak strains were grouped either as from the base, the midsection or the apex or as from the anterior or the posterior segments in males (left panels) and females (right panels). Ant, anterior, Post, posterior. Males are represented on the left panels and females on the right. Results are represented as violin plots ( n = 8–10). Inner black lines represent quartiles of the data. Significance between groups was calculated with paired Student’s T-test. *, p < 0.05, **, p < 0.01, ***, p < 0.001 and ****, p < 0.0001 between corresponding pre-Iso and Iso animals.
Figure 2
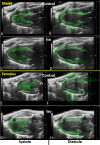
Figure 2. PSLAX LV wall trace tendency before and after Iso.
LV wall trace tendency is expressed as velocity vectors for >48 points around the endocardium in systole (left panels) and diastole (right panels) before and after Iso in males (top panels) and female mice (bottom panels). Images of velocity vectors corresponds to the maximal peak (systole) and minimal peak (diastole) of the average curve of all six segments curves for speckle velocity in PSLAX. As evidenced by these PSLAX B-mode views, velocity vector orientation and length varies during the cardiac cycle. Vertical (radial) and horizontal (longitudinal) components of each vector do not correspond necessarily to the respective peak value of each orthogonal component.
Figure 3
Figure 3. Peak SR and Peak reverse SR (rSR).
In the background is represented a screen caption of an M-mode loop of three cardiac cycles. In green, the EKG is superposed at the top. Radial strain rate curves are depicted for each SAX segment and an “average” curve in black. Notice that all curves begin at the R wave of the EKG. As evidenced by this representation, the first SR peak (top yellow circle) corresponds to the maximal SR (1/s) whereas the second peak (bottom yellow circle) is inverted and happens during the early stage of LV relaxation as evidenced by the M-mode image underneath. A male mouse after three weeks of Iso is represented. B-H. Before after effects of Iso on strain rate (SR) and reverse strain rate (rSR). Radial (B–C) and longitudinal (D–E) peak SR and rSR (F–H) are illustrated. Characters colors correspond to those used in the graphs for each of these LV segments. Ant, anterior; Post, posterior; SW, septal wall and FW, free wall. Males are represented on the left panels and females on the right. Results are represented as violin plots (n = 8–10). Inner black lines represent quartiles of the data. Significance between groups was calculated with paired Student’s T-test. *, p < 0.05, **, p < 0.01 and ***, p < 0.001 between corresponding pre-Iso and Iso groups.
Figure 4
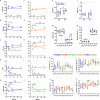
Figure 4. Reversibility of Iso treatment.
(A–J) Head-to-head longitudinal comparison of several echo parameters of control (open circles) and Iso-treated (closed circles) male (blue) and female (orange) mice. EDV, end-diastolic volume; ESV, end-systolic volume; EF, ejection fraction and IVRT, Isovolumetric relaxation time. *, p < 0.05, **, p < 0.01, ***, p < 0.001 and ****, p < 0.0001 between corresponding control and Iso animals using unpaired Student’s T-test. #, p < 0.05; ##, p < 0.01; ###, p < 0.001 and ####, p < 0.0001 between measurements at different times using ANOVA and Tukey’s pos t-test. K–L, Global longitudinal strain (GLS) and global circumferential strain (GCS) at week 20 in male and female mice treated or not with Iso for 3 weeks. M–N, Average radial and longitudinal peak strains at week 20. O–R, Radial and longitudinal peak strains at week 20 in male and female mice treated or not with Iso. The six segments are identified. Results are represented as violin plots (n = 8–10). Inner black lines represent quartiles of the data. Significance between groups was calculated with unpaired Student’s T-test. *, p < 0.05; **, p < 0.01 and ***, p < 0.001 between corresponding control (Ctrl) and Iso animals.

Similar articles

Cited by

References

    1. Ali A, Redfors B, Lundgren J, Alkhoury J, Oras J, Gan LM, Omerovic E. Effects of pretreatment with cardiostimulants and beta-blockers on isoprenaline-induced takotsubo-like cardiac dysfunction in rats. International Journal of Cardiology. 2019;281:99–104. doi: 10.1016/j.ijcard.2018.12.045. - DOI - PubMed
    1. An X, Wang J, Li H, Lu Z, Bai Y, Xiao H, Zhang Y, Song Y. Speckle tracking based strain analysis is sensitive for early detection of pathological cardiac hypertrophy. PLOS ONE. 2016;11:e0149155. doi: 10.1371/journal.pone.0149155. - DOI - PMC - PubMed
    1. Angelini P, Gamero MT. What can we learn from animal models of Takotsubo syndrome? International Journal of Cardiology. 2019;281:105–106. doi: 10.1016/j.ijcard.2019.01.064. - DOI - PubMed
    1. Chang SC, Ren S, Rau CD, Wang JJ. Isoproterenol-induced heart failure mouse model using osmotic pump implantation. Methods in Molecular Biology. 2018;1816:207–220. doi: 10.1007/978-1-4939-8597-5-16. - DOI - PMC - PubMed
    1. Damen FW, Berman AG, Soepriatna AH, Ellis JM, Buttars SD, Aasa KL, Goergen CJ. High-frequency 4-dimensional ultrasound (4DUS): a reliable method for assessing murine cardiac function. Tomography. 2017;3:180–187. doi: 10.18383/j.tom.2017.00016. - DOI - PMC - PubMed

LinkOut - more resources