. 2021 Mar 5:9:615639.
doi: 10.3389/fbioe.2021.615639. eCollection 2021.

A Parallel Perifusion Slide From Glass for the Functional and Morphological Analysis of Pancreatic Islets

Affiliations

A Parallel Perifusion Slide From Glass for the Functional and Morphological Analysis of Pancreatic Islets

Torben Schulze et al. Front Bioeng Biotechnol. .

Abstract

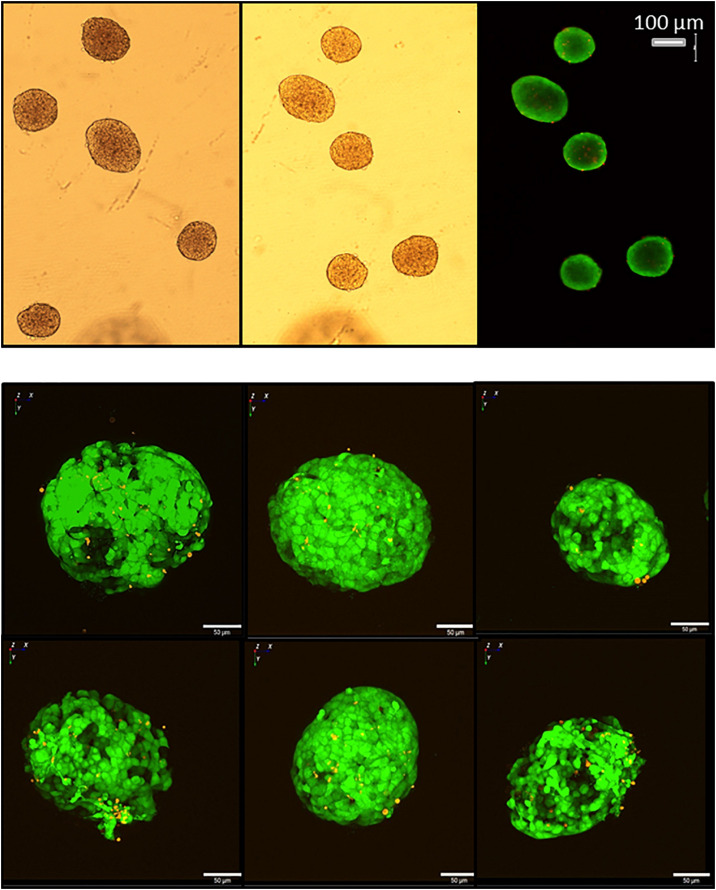
An islet-on-chip system in the form of a completely transparent microscope slide optically accessible from both sides was developed. It is made from laser-structured borosilicate glass and enables the parallel perifusion of five microchannels, each containing one islet precisely immobilized in a pyramidal well. The islets can be in inserted via separate loading windows above each pyramidal well. This design enables a gentle, fast and targeted insertion of the islets and a reliable retention in the well while at the same time permitting a sufficiently fast exchange of the media. In addition to the measurement of the hormone content in the fractionated efflux, parallel live cell imaging of the islet is possible. By programmable movement of the microscopic stage imaging of five wells can be performed. The current chip design ensures sufficient time resolution to characterize typical parameters of stimulus-secretion coupling. This was demonstrated by measuring the reaction of the islets to stimulation by glucose and potassium depolarization. After the perifusion experiment islets can be removed for further analysis. The live-dead assay of the removed islets confirmed that the process of insertion and removal was not detrimental to islet structure and viability. In conclusion, the present islet-on-chip design permits the practical implementation of parallel perifusion experiments on a single and easy to load glass slide. For each immobilized islet the correlation between secretion, signal transduction and morphology is possible. The slide concept allows the scale-up to even higher degrees of parallelization.

Keywords: NAD(P)H- and FAD-autofluorescence; borosilicate glass; calcium; femtosecond laser-structuring; insulin secretion; islet of langerhans; microfluidic perifusion system.


Conflict of interest statement

The authors declare that the research was conducted in the absence of any commercial or financial relationships that could be construed as a potential conflict of interest.

Figures

FIGURE 1
FIGURE 1
Design of the microfluidic system for parallel perifusion of single isolated islets. (a) View of the glass chip containing 5 parallel microchannels, each with a single well of 500 μm depth. The chip consists of 2 layers bonded together after structuring. The total thickness of the chip is 1.4 mm. (b) Detail of the chip surface, showing the inlet (arrow) through which the islet can be inserted into the well. (c) Isometric drawing of the parallel perifusion slide after attaching the glass chip to the metal frame. The metal frame holds PVC fittings to connect with the tubing. For size comparison a microscope objective is placed above the part where the wells are located. (d) 3D schematic view of the islet inlet, the microchannel shape and the pyramidal well below the inlet containing a spheroidal islet of 150 μm diameter. (e) Entire perifusion slide with attached tubing placed on the stage of an upright fluorescence microscope. The cover slip sealing the inlets is clearly visible. (f) A mouse islet (arrow) being inserted into the inlet above the well by use of an Eppendorf pipette.
FIGURE 2
FIGURE 2
Laser structuring of borosilicate glass. (a) 3D image of the microchannel generated by depth measurements after the ablation process and the blow-off of debris. The channel is contained in the upper half of the parallel perifusion slide and is seen here from below. Note the nearly paraboloid shape which was intended to minimize turbulent flow in the channels. (b) Surface of the channel wall after wet cleaning procedure before bonding. Note the residual roughness of the glass surface as given by the Rz value of nearly 20. (c) Heating of the glass chip to just below the melting temperature reduced the surface roughness more than five-fold.
FIGURE 3
FIGURE 3
The pyramidal well for islet retention. (a) Appearance of a mouse islet within the well as seen from above with a 40x dry objective in transmitted light. (b) Appearance of the same islet as in (a) under epifluorescent excitation of TMRE fluorescence, labeling the mitochondria within the islet cells. (c) Appearance of a mouse islet within the well as seen from below with a 10x dry objective in transmitted light on an inverted microscope stage. (d) Appearance of the same islet as in (c) under epifluorescent excitation of Fura-2 AM fluorescence to determine [Ca2+]i changes.
FIGURE 4
FIGURE 4
Simulation of medium exchange in the microfluidic system at 37°C. (A) 3D view of the microchannel and the pyramidal well containing an islet of 150 μm diameter. The time point is 1 min after the new medium (blue) has entered the microchannel and displaces the pre-existent medium (red). The upper part of the islet has just got into contact with the new medium. The pre-existent medium in the inlet is completely separated from the islet. (B) Time sequence of the fluid exchange, shown for the longitudinal section at the centreline of the microchannel and the well. The pre-existent medium (red) is displaced by the new medium (blue) at a pump rate of 40 μl per min. The time point 0 is set when the new medium is 1 mm away from the well. The upper row gives the results for the empty system, the middle row for an islet of 150 μm diameter, and the lower row for an islet of 250 μm diameter. The exchange velocity is influenced by the occupation of the well and by the size of the islet within the well.
FIGURE 5
FIGURE 5
Simulation of the medium exchange at 37°C at the surface of islets of different diameters. For the simulation 20 points were evenly distributed over the surface of spheroidal islets of different diameter. The line color codes for the position of the point of simulated measurement, the color code is the same for all islets. The diagrams show the decrease of the pre-existent medium on the surface of (A) an islet of 50 μm diameter, (B) an islet of 150 μm diameter, and (C) an islet of 250 μm diameter. The time-dependent decrease of the mean value of all 20 measuring points is given in (D) for these three islets and, additionally, for an islet of 300 μm diameter. It becomes clear that the exchange process is substantially faster for islets of 250 μm than for those of 150 μm diameter, but does not accelerate much further with larger islets. The effect of diffusional exchange between the media was not included in the simulation. (E) Distribution of the 20 simulation points over the surface of an ideal spheroidal islet.
FIGURE 6
FIGURE 6
Simulation of pressure and shear stress exerted on an islet in the well. The benefit of a fast medium exchange has to be weighed against the forces exerted on the islet in the well. The simulation of pressure (A) and of shear stress (B) on the surface of a 150 μm islet suggests that only minimal mechanical force is exerted at the flow rates used for the simulations and the experiments (40 μl/min).
FIGURE 7
FIGURE 7
Simultaneous measurement in perifused islets of the NAD(P)H autofluorescence, the FAD autofluorescence and the fluorescence of the Ca2+ indicator Cal 630. Three islets of different size were loaded with Cal 630 AM, placed in wells, one each per well, and perifused with KR medium. A fourth well was left empty to provide a background signal. The wells were sequentially scanned, each islet being excited with three wavelengths to generate the dark blue NAD(P) H-, the green FAD-, and the red Cal 630 fluorescence. In the blank well a slight blue fluorescence was visible by cellular debris from a preceding experiment (upper panel). From 6 to 16 min the perifusion was switched to a medium containing 40 mM KCl. The intensity was normalized to the values at 6 min. The single traces of the Cal 630 fluorescence are shown in the middle graph, the mean values ± SEM of all three fluorescences are shown in the lower graph. Note the lack of fluorescence increase in the blank well and the increase of both NAD(P)H- and FAD-fluorescence during KCl depolarization.
FIGURE 8
FIGURE 8
Multiparametric measurements in parallel perifused islets stimulated with glucose. Five islets were loaded with Cal 630 AM, placed in the wells, one each per well, and perifused with KR medium. From 5 to 20 min the glucose concentration of the perifusion medium was raised to 25 mM. The intensity was normalized to the values at 8 min (the time point when the medium reached the wells). The single fluorescence traces per islet are shown in the upper row, the single fluorescence traces per parameter are shown in the middle row. The lower graph shows the mean values ± SEM of the traces shown above. The onset of the oscillatory pattern of the cytosolic Ca2+ concentration (Cal 630 fluorescence) after 5 min contrasts with the continuous increase of the NAD(P)H-fluorescence and the continuous decrease of the FAD-fluorescence.
FIGURE 9
FIGURE 9
Multiparametric measurements in parallel perifused islets, sequentially stimulated with glucose and KCl. Five islets were loaded with Cal 630 AM, placed in the wells, one each per well, and perifused with KR medium containing 5 mM glucose. From 10 to 25 min the perifusion medium contained 25mM glucose and 40–55 min 40 mM KCl. The fluorescence intensities of NAD(P)H (upper panel), FAD (middle panel) and Cal 630 (lower panel) were normalized to the values at 5 min (the time point when the medium reached the wells). Note the inter-islet heterogeneity and the intra-islet homogeneity of the response to the stimuli. Interestingly, the FAD-response is less heterogeneous than the NAD(P)H-response. Only one islet shows Ca2+ oscillation.
FIGURE 10
FIGURE 10
Insulin secretion of parallel perifused islets in the microfluidic system. Five islets of similar size were placed in the wells, one each per well, and perifused with KR medium. The efflux of the medium was collected by a 96 well plate and the insulin content of the fractions was determined by ultrasensitive ELISA. (A) From 40 to 60 min the glucose concentration of the perifusion medium was increased from 5 to 25mM glucose. Shown are the single values and the means of five independently perifused islets. Note the incomplete return to prestimulatory values during the wash-out of the glucose stimulus. (B) From 15 to 27 min the islets were stimulated with 500 μM tolbutamide and from 51 to 64 min with 40 mM KCl. Shown are the single values and the means of five independently perifused islets. This experiment was conducted at 22 °C. Still, there is a substantial increase of secretion in response to 40 mM KCl.
FIGURE 11
FIGURE 11
Relation between the stimulus pattern and the secretory response of parallel perifused islets in the microfluidic system. Five islets of similar size were placed in the wells, one each per well, and perifused with KR medium. The efflux of the medium was collected by a 96 well plate and the insulin content of the fractions was determined by ultrasensitive ELISA. From 25 to 55 min the islets were stimulated with 40mM KCl. This experiment was conducted at 37°C and each channel was perfused at a rate of 20 μl/min. Shown are the curves of five independently dye (TMB)-perfused channels to visualize the square wave stimulation by KCl (upper panel) and the secretion curves of five independently perifused islets responding to the square wave-stimulus (middle panel). The respective mean values ± SEM of secretion (closed circles) and dye perfusion (open circles) are depicted in the lower panel. The dashed lines indicate the time required from the onset of increase until steady state. When no SEM range is visible, it is smaller than the symbol size.
FIGURE 12
FIGURE 12
Islet morphology before and after removal from the microfluidic system. One day-cultured mouse islets were placed in the wells as shown in Figure 3a, removed by use of an Eppendorf pipette and inspected by microscopy. Upper row: islet of about 200μm (left) and 250μm (right) diameter before insertion into the well. Lower row: the same islets after removal from the microfluidic system. Note that the blood vessel remnant of the right islet has been shortened, but otherwise the islets appear intact. DIC-contrast, the length of the scale bar is 150 μm.
FIGURE 13
FIGURE 13
Live/dead assay of islets before and after removal from the microfluidic system. Upper micrographs: islets were inserted in and removed from the parallel perifusion slide and loaded thereafter with calcein (green fluorescence) and ethidium homodimer III (red fluorescence). Transmitted light micrograph before insertion (left) and transmitted light and fluorescence micrographs 5 min after removal from the chip (middle and right). Red nuclei are sparse, the entirety of the islets is labeled by calcein. Lower micrographs: calcein- and ethidium-loaded islets were imaged by spinning disk confocal microscopy before (upper row) and after insertion into the slide and removal (lower row). The number of red fluorescent nuclei indicating cell death did not increase and were only located in the islet periphery. The length of the scale bars is 50 μm.

Similar articles

Cited by

References

    1. Ahlqvist E., Storm P., Käräjämäki A., Martinell M., Dorkhan M., Carlsson A., et al. (2018). Novel subgroups of adult-onset diabetes and their association with outcomes: a data-driven cluster analysis of six variables. Lancet Diabetes Endocrinol. 6 361–369. 10.1016/s2213-8587(18)30051-2 - DOI - PubMed
    1. Alcazar O., Buchwald P. (2019). Concentration-dependency and time profile of insulin secretion: dynamic perifusion studies with human and murine islets. Front. Endocrinol. (Lausanne). 10:680. 10.3389/fendo.2019.00680 - DOI - PMC - PubMed
    1. Arrojo e Drigo R., Ali Y., Diez J., Srinivasan D. K., Berggren P. O., Boehm B. O. (2015). New insights into the architecture of the islet of Langerhans: a focused cross-species assessment. Diabetologia 58 2218–2228. 10.1007/s00125-015-3699-0 - DOI - PubMed
    1. Ashcroft F. M., Rorsman P. (1989). Electrophysiology of the pancreatic beta-cell. Prog. Biophys. Mol. Biol. 54 87–143. - PubMed
    1. Bandak B., Yi L., Roper M. G. (2018). Microfluidic-enabled quantitative measurements of insulin release dynamics from single islets of Langerhans in response to 5-palmitic acid hydroxy stearic acid. Lab Chip 18 2873–2882. 10.1039/c8lc00624e - DOI - PMC - PubMed

LinkOut - more resources