

Quantification of Cardiac Kinetic Energy and Its Changes During Transmural Myocardial Infarction Assessed by Multi-Dimensional Seismocardiography
- PMID: 33763456
- PMCID: PMC7982421
- DOI: 10.3389/fcvm.2021.603319
Quantification of Cardiac Kinetic Energy and Its Changes During Transmural Myocardial Infarction Assessed by Multi-Dimensional Seismocardiography
Abstract
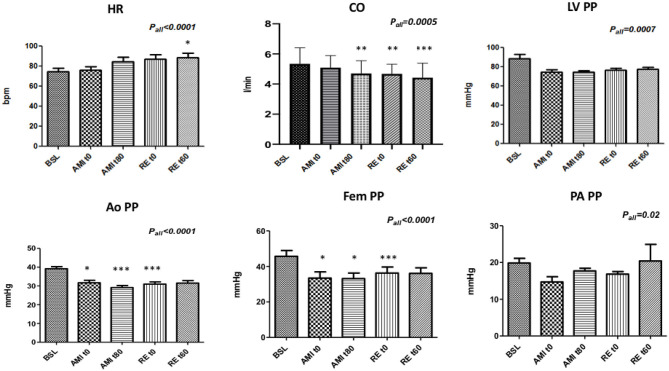
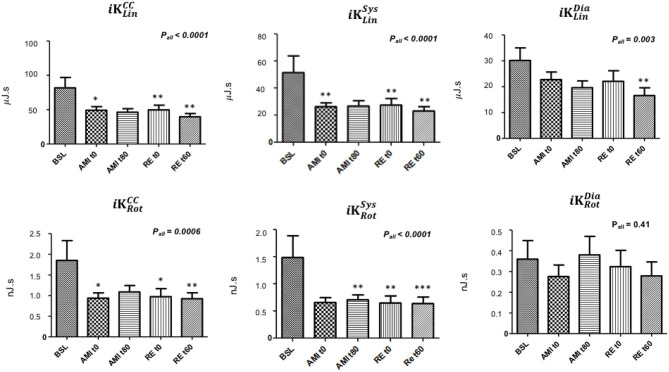
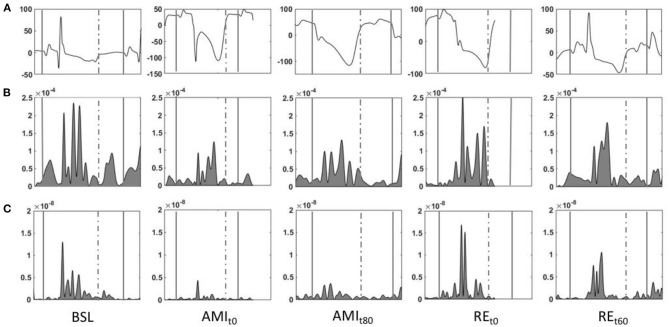
Introduction: Seismocardiography (SCG) records cardiac and blood-induced motions transmitted to the chest surface as vibratory phenomena. Evidences demonstrate that acute myocardial ischemia (AMI) profoundly affects the SCG signals. Multidimensional SCG records cardiac vibrations in linear and rotational dimensions, and scalar parameters of kinetic energy can be computed. We speculate that AMI and revascularization profoundly modify cardiac kinetic energy as recorded by SCG. Methods: Under general anesthesia, 21 swine underwent 90 min of myocardial ischemia induced by percutaneous sub-occlusion of the proximal left anterior descending (LAD) coronary artery and subsequent revascularization. Invasive hemodynamic parameters were continuously recorded. SCG was recorded during baseline, immediately and 80 min after LAD sub-occlusion, and immediately and 60 min after LAD reperfusion. iK was automatically computed for each cardiac cycle (iK CC ) in linear (iK Lin ) and rotational (iK Rot ) dimensions. iK was calculated as well during systole and diastole (iK Sys and iK Dia , respectively). Echocardiography was performed at baseline and after revascularization, and the left ventricle ejection fraction (LVEF) along with regional left ventricle (LV) wall abnormalities were evaluated. Results: Upon LAD sub-occlusion, 77% of STEMI and 24% of NSTEMI were observed. Compared to baseline, troponins increased from 13.0 (6.5; 21.3) ng/dl to 170.5 (102.5; 475.0) ng/dl, and LVEF dropped from 65.0 ± 0.0 to 30.6 ± 5.7% at the end of revascularization (both p < 0.0001). Regional LV wall abnormalities were observed as follows: anterior MI, 17.6% (three out of 17); septal MI, 5.8% (one out of 17); antero-septal MI, 47.1% (eight out of 17); and infero-septal MI, 29.4% (five out of 17). In the linear dimension, , , and dropped by 43, 52, and 53%, respectively (p < 0.0001, p < 0.0001, and p = 0.03, respectively) from baseline to the end of reperfusion. In the rotational dimension, and dropped by 30 and 36%, respectively (p = 0.0006 and p < 0.0001, respectively), but did not change (p = 0.41). All the hemodynamic parameters, except the pulmonary artery pulse pressure, were significantly correlated with the parameters of iK, except for the diastolic component. Conclusions: In this very context of experimental AMI with acute LV regional dysfunction and no concomitant AMI-related heart valve disease, linear and rotational iK parameters, in particular, systolic ones, provide reliable information on LV contractile dysfunction and its effects on the downstream circulation. Multidimensional SCG may provide information on the cardiac contractile status expressed in terms of iK during AMI and reperfusion. This automatic system may empower health care providers and patients to remotely monitor cardiovascular status in the near future.
Keywords: acute myocardial infarction; animal model for acute coronary syndrome; cardiac monitoring; kinetic energy; seismocardiography.
Copyright © 2021 Morra, Pitisci, Su, Hossein, Rabineau, Racape, Gorlier, Herpain, Migeotte, Creteur and van de Borne.
Conflict of interest statement
P-FM, DG, and AHo declare having direct ownership of shares in Healthcare Company. The remaining authors declare that the research was conducted in the absence of any commercial or financial relationships that could be construed as a potential conflict of interest.
Figures
References
-
- Hossein A, Mirica DC, Rabineau J, Del Rio JI, Morra S, Gorlier D, et al. Publisher correction: accurate detection of dobutamine-induced haemodynamic changes by kino-cardiography: a randomised double-blind placebo-controlled validation study. Sci Rep. (2020) 10:5459. 10.1038/s41598-020-61864-9 - DOI - PMC - PubMed
-
- Calvo M, Bonnet JL, Le Rolle V, Lemonnier M, Yasuda S, Oosterlinck W, et al. Evaluation of Three-Dimensional Accelerometers for the Study of Left Ventricular Contractility. Computing in Cardiology Conference (CinC). Maastricht: IEEE; (2018). 10.22489/CinC.2018.176 - DOI
LinkOut - more resources
Full Text Sources
Other Literature Sources
Medical